R
E
V
IS
Ã
O
R
E
V
IE
W
1
Institute for Risk Assessment Sciences, University of Utrecht. Jenalaan 18d, 3584 CK. 2059 Utrecht Netherlands. [email protected] 2
Netherlands
Environmental Assessment Agency, Bilthoven, the Netherlands
Do the Health Benefits of Cycling Outweigh the Risks?
Os benefícios à saúde em andar de bicicleta superam os riscos?
Resumo Embora uma mudança do uso de carro
para bicicleta possa trazer efeitos benéficos para a saúde devido à diminuição da poluição do ar e a um aumento da atividade física, esta mudança também pode trazer efeitos adversos à saúde como exposição à poluição e risco de acidentes de trân-sito, os quais podem superar os benefícios. Nós resumimos a literatura sobre poluição do ar, aci-dentes de trânsito e atividade física, utilizando revisões sistemáticas suplementadas com estudos recentes. Quantificamos também o impacto na causa de mortalidade se 500 mil pessoas fizessem a transição de carro para bicicleta em viagens cur-tas diárias na Holanda. Estimamos que os efeitos benéficos do aumento da atividade física são subs-tancialmente maiores do que o efeito potencial da mortalidade por inalação de ar poluído e aumen-to de acidentes de trânsiaumen-to. Os benefícios sociais são ainda maiores devido a uma modesta redução na poluição do ar e nos acidentes de trânsito. Em média, os benefícios de saúde devido ao uso da bicicleta são substancialmente maiores do que os riscos relativos a dirigir um carro para pessoas em transição do modo de transporte.
Palavras-chave Poluição do ar, Bicicleta, Mu-dança, Atividade física, Acidentes de trânsito
Abstract Although from a societal point of view a
modal shift from car to bicycle may have benefi-cial health effects due to decreased air pollution emissions and increased levels of physical activity, shifts in individual adverse health effects such as higher exposure to air pollution and risk of a traf-fic accident may prevail. We have summarized the literature for air pollution, traffic accidents, and physical activity using systematic reviews sup-plemented with recent key studies. We quantified the impact on all-cause mortality when 500,000 people would make a transition from car to bicy-cle for short trips on a daily basis in the Nether-lands. We estimate that beneficial effects of in-creased physical activity are substantially larger (3–14 months gained) than the potential mortal-ity effect of increased inhaled air pollution doses (0.8–40 days lost) and the increase in traffic acci-dents (5–9 days lost). Societal benefits are even larger because of a modest reduction in air pollu-tion and traffic accidents. On average, the esti-mated health benefits of cycling were substantially larger than the risks relative to car driving for individuals shifting their mode of transport.
Key words Air pollution, Biking, Modal shift, Physical activity, Traffic accidents
H
ar
Recently, policy interest in promoting cycling as a mode of transport has increased substantially within Europe. Several capitals, such as Copen-hagen, Denmark (in 1995), Helsinki, Finland (2000), Oslo, Norway (2002), Stockholm, Swe-den (2006), Barcelona, Spain (2007), Paris, France (2007), and Brussels, Belgium (2009), have im-plemented low-cost rental systems aimed at stim-ulating commuters to use bicycles for the typical-ly short urban trips. Motive for these policies is more often the reduction of traffic congestion than promotion of health. In 2005, the European Union formulated an important area of action: “address-ing the obesogenic environment to stimulate phys-ical activity” (Commission of the European Com-munities 2005). Attitudes and policies toward ac-tive commuting have recently been discussed (Lorenc et al. 2008; Ogilvie et al. 2004). The Trans-port, Health, and Environment Pan-European Programme (THE PEP) provides guidance to policy makers and local professionals on how to stimulate cycling and walking (THE PEP 2009). The promotion of walking and cycling is a prom-ising way to increase physical activity across the population by integrating it into daily life.
Promoting cycling for health reasons implies that the health benefits of cycling should outweigh the risks of cycling. Although society may benefit from a shift from private car use to bicycle use (e.g., reduced air pollution emission), disadvan-tages to individuals may occur. Although individ-uals may benefit from increased physical activity, at the same time they inhale more pollutants be-cause of increased breathing rates. The risks of being involved in traffic accidents may increase, as well as the severity of an accident. A study in Vancouver, Canada (Marshall et al. 2009), illus-trated that, especially in the city center, high-walk-ability neighborhoods had high traffic density, leading to high air pollution concentrations for a traffic-related primary pollutant [nitric oxide (NO)] but not for a secondary pollutant (ozone). For cycling, similar issues may occur.
The aim of this review is to assess quantita-tively whether the health benefits of the use of a bicycle instead of a private car for short trips out-weigh the health risks. The risks and benefits are evaluated both for the individuals who shift from car driving to cycling and for society as a whole.
Materials and Methods
We focus on the comparison of private car driv-ing versus cycldriv-ing because most trips are made by car, and the use of the private car is related to
many negative aspects, including congestion, use of physical space, reduction of outdoor activi-ties, air pollution, and noise. In the Netherlands, 20% and 30% of total car trips (totaling 15.9 million trips/day) are, respectively, for shopping and commuting purposes (Beckx et al. 2009a, 2009b; Mobiliteitsonderzoek Nederland 2007). Approximately 50% of all car trips are < 7.5 km, which is short enough to make travel by bicycle a feasible alternative.
In the quantitative comparison between car driving and cycling, we considered air pollution, traffic accidents, and physical activity as main exposures. We summarize the relevant evidence of health effects related to air pollution, traffic accidents, and physical activity separately. For these sections, we made use of published (sys-tematic) reviews, supplemented with more recent key studies.
Health effects related to air pollution, traffic accidents, and physical activity differ—for exam-ple, traffic accidents resulting in injuries and phys-ical activity affecting cardiovascular disease. Therefore, we compare potential effects of these exposures (in conjunction with driving or cycling) on mortality rather than morbidity. In addition, epidemiologic evidence of associations of these exposures with mortality is stronger than asso-ciations with other outcomes, particularly for physical activity. All three exposures have been associated with mortality, so a common metric can be used to quantify their potential effects, and mortality is reported more consistently than other health outcomes. In particular, minor in-juries associated with traffic accidents are much more likely to be underreported than are deaths due to traffic accidents.
d
e C
o
le
tiv
a, 16(
12)
:4731-4744,
2011
not substantially affected our conclusions. The scenario is used mostly to calculate travel time and kilometers driven, inputs needed to calculate air pollution, physical activity, and accident im-pacts, combined with more generic concentra-tion–response functions.
We express mortality impacts in life-years gained or lost estimated with life table tions (Miller and Hurley 2003). For the calcula-tion we used a populacalcula-tion of 500,000 people 18– 64 years of age, distributed in age categories com-parable to the 2008 Dutch population [Statistics Netherlands (CBS) 2008]. We estimated the ef-fects on this population for a lifetime.
Air Pollution Exposures and Health Effects
Air pollution exposure during cycling and car driv-ing. Since the 1990s various studies have mea-sured air pollution exposure levels associated with different modes of transport (Kaur et al. 2007). In recent studies, the emphasis has been on fine and ultrafine particulate matter [aerodynamic diameter < 2.5 µm (PM2.5) and < 0.1 µm (UFP),
respectively], because these are the main pollut-ants related to human health effects. Driving or cycling in traffic may result in air pollution expo-sures that are substantially higher than overall urban background concentrations (Kaur et al. 2007). Consequently, even relatively short times spent in traffic may contribute significantly to daily exposures (Beckx et al 2009a, 2009b; Fruin
et al. 2004; Marshall et al. 2006; Van Roosbroeck
et al. 2007). Table 1 summarizes studies that
spe-cifically compared exposures during car driving and cycling within the same study.
Overall, air pollution exposures experienced by car drivers were modestly higher than those experienced by cyclists, with mean ratios of 1.16 for PM2.5, 1.01 for UFP, and 1.65 for elemental
carbon or soot. However, increased physical ac-tivity results in higher minute ventilation (vol-ume of air inhaled in one minute) for cyclists than for car drivers, with estimates from two Dutch studies reporting that the minute ventila-tion of cyclists was 2.3 times (van Wijnen et al. 1995) and 2.1 times (Zuurbier et al. 2009) higher than that of car drivers. Therefore, inhaled doses of PM2.5 and, to a lesser extent, elemental carbon
may be higher in cyclists. The difference in expo-sure between cyclists and car drivers depends on a large number of factors, such as selected route, car speed, trip duration, car type, ventilation sta-tus (open windows, mechanical ventilation), driving behavior, street configuration, and
weath-er conditions (Kaur et al. 2007). Trip duration might also be higher for cyclists, although this may be highly dependent on the setting. For ex-ample, in a study conducted in 11 Dutch cities, there was no difference in the time required to bicycle versus drive short distances (Boogaard et al. 2009), but for longer trips cars were faster than cyclists (Zuurbier et al. 2010).
Health effects of in-traffic exposures. The short
exposures typical for commuting have not been studied extensively in air pollution epidemiology, in contrast to 24-hr average exposures or long-term (annual average) exposures [World Health Organization (WHO) 2006]. Several studies have documented that long-term exposure to traffic-related air pollution is associated with adverse health effects, including increased mortality (WHO 2006).
Table 2 summarizes the few epidemiologic studies of in-traffic air pollution exposures, sug-gesting that these exposures result in physiologic changes (including airway and systemic inflam-mation and lung function decrements) in healthy adults and asthmatics and possibly more severe adverse effects (myocardial infarction).
Furthermore, there is a fairly substantial body of evidence of human controlled exposure stud-ies in which volunteers have been exposed for 1– 2 hr to diesel exhaust and to filtered air for com-parison [see Supplemental Material, Table 1 (doi:10.1289/ehp.0901747)]. Typically, the evalu-ated exposures (100–300 ìg/m3
) are higher than those encountered in ambient air, although not excessively. Because of ethical concerns, only phys-iologic effects have been studied with this study design. These studies have documented airway and systemic inflammation after exposure to die-sel exhaust in patients and in healthy subjects.
Assessment of the modal shift impact on
mor-tality related to air pollution exposure.
Individu-al effects. Because the physiologic changes ob-served in epidemiologic and controlled exposure studies likely play a role in the pathway to cardiac events of long-term exposure, it is plausible that these more adverse effects may occur in suscepti-ble subjects. We calculated the potential impact on mortality of a transition from using a car to a bicycle for a 30-min (7.5-km) or 1-hr (15-km) commute based upon relative risk estimates from long-term exposure studies of mortality in asso-ciation with PM2.5 (Pope et al. 2002) and black
smoke (BS) (Beelen et al. 2008).
H
ar
to long-term air pollution exposure is determined by the inhaled daily dose of PM2.5 or BS. First, we
calculated the inhaled pollution dose during com-muting (car driving or cycling) and noncommut-ing hours based on prior information concern-ing minute ventilation rates (liters per minute)
and PM2.5 and BS exposures (micrograms per
cubic meter) during sleep, rest, driving, or cy-cling. Next, we estimated the total daily dose for PM2.5 and BS (micrograms per day) for driving
or cycling. We then used the ratio of the total daily doses for the two travel modes to derive an
City
Amsterdam
Copenhagen
London
London
London
Huddersfield, UK
11 Dutch cities
Arnhem, the Netherlands
Mean
Study design
Two inner-city routes traveled for about 1 hr in January and May 1990 (n = 55 and 41) Two cars and two cyclists on a 7.6-km inner-city route in the morning of two days in summer 1998
Three routes from the center (one central, two to more outward sections) in July 1999 and February 2000 (n = 96 cycle trips and 54 car trips) Two short (~ 1 km) routes (one heavy traffic, one mixed) traveled in spring 2003 during early morning, lunchtime, and afternoon
Two short (~ 1 km) routes (one heavy traffic, one mixed) traveled in spring 2003 during early morning, lunchtime, and afternoon
7-mile journey from village to Huddersfield, cycle along a major highway and a separate bicycle path (six samples in September/October 1996) Simultaneous cycle and car drives between same start and end points in afternoon in 11 large Dutch cities, ~ 12 routes in each city; sampling duration, ~ 3 hr/city (1 day per city in autumn 2006)
2-hr morning rush hour exposures of cyclists and car and bus passengers on an urban route in a medium-size city Simple mean of ratios from applicable studies
Polluant
COBETX
BTEX TSP
PM2.5
EC
EC
PM2.5
UFP CO
Abs
UFP PM2.5
UFP PM2.5
Abs
PM2.5
EC and Abs UFP
Mean concentration
car (µg/m3
)
4,833 332
44 44
37 29
39
38 99,736 1,300
7.6
25,545 49
40,351 78 8.8
Table 1. Air pollution exposures during cycling and car driving.
Abbreviations: Abs, absorbance (10–5
m), a marker for (diesel) soot; BTEX, sum of benzene, toluene, ethylbenzene and xylene; CO, carbon monoxide; EC, elemental carbon, equivalent to (diesel) soot; TSP, total suspended dust; UFP, ultrafine particle count (per cubic centimeter).
Mean concentration
cycling (µg/m3
)
1,730 99
150 75
28 18
25
34 93,968 1,100
2.7 6.3
24,329 45
44,258 72 6.0
Ratio car/cycle
2.8 3.4
0.3 0.6
1.32 1.6
1.6
1.12 1.06 1.18
2.6 1.2
1.05 1.11
0.91 1.09 1.48
1.16 1.65 1.01
Reference
van Wijnen et al. 1995 Rank et al. 2001
Adams et al. 2001
Gegisian 2003
Kaur et al. 2005
Kingham et al. 1998
Boogaard et al. 2009
d
e C
o
le
tiv
a, 16(
12)
:4731-4744,
2011
“equivalent” change in PM2.5 or BS concentration
(micrograms per cubic meter) that could be nor-malized to the 10 ìg/m3 increase in long-term exposures used by Pope et al. (2002) and Beelen
et al. (2008) to estimate the relative risk
associat-ed with the estimatassociat-ed change in long-term PM2.5
and BS exposures that would result from a shift to commuting by bicycle instead of by car.
Study population
Sixty mild to moderate asthmatic adults in London
Subjects (n = 691) with MI in Augsburg
Nine healthy young U.S. policemen
Twelve healthy young subjects
Design
Exposure during 2 hr walking in OS or HP, pre/postexposure physiologic measurements: median PM2.5 concentration, 28 (OS) vs.
11 µg/m3 (HP); median EC, 7.5 vs.
1.3 µg/m3; median UFP, 63,700 vs.
18,300 particles/cm3
Case–crossover study comparing the frequency of participation in traffic in the hours before the MI and a control period (24–72 hr before MI)
Physiologic measurements before and after 8-hr work shift; average in-vehicle PM2.5, 24 µg/m3
Physiologic measurements before and after 1-hr cycling trip from city center to university in Utrecht
Main findings
Asymptomatic decrease in lung function and increase in inflammation after walking in OS compared with HP; changes most consistently associated with EC and UFP; per 1-µg/m3
significant increase in EC decrement in lung function of ~ 1% decrement in lung function and ~ 2% increase in exhaled NO (inflammation) RR = 2.92 for participation in traffic in the hour before the MI; increased risk found for all transport means (car, bicycle, public transport)
Significant increases of heart rate variability, ectopic beats, blood inflammatory and coagulation markers, and red blood cell volume; per 10-µg/m3
PM2.5 effect on C-reactive protein, +32%;
neutrophils, +6%; von Willebrand factor, +12%; and ectopic beats, +20%
Statistically nonsignificant 1–3% decrements in lung function per 105/m
soot concentration and a 15% increase in exhaled NO per 38,000 particles/cm3
Table 2. Epidemiological studies of air pollution exposure in traffic.
Abbreviations: EC, elemental carbon; HP, Hyde Park; MI, myocardial infarction; NO, nitric oxide; OS, Oxford Street; RR, relative risk; UFP, ultrafine particle count.
Comments
OS has diesel traffic
only
May be stressors other than air pollution
Reference
McCreanor et al. 2007
Peters et al. 2004
Riediker et al. 2004
Strak et al. 2010
Travel mode
PM2.5
Car Cycle Car Cycle BS Car Cycle Car Cycle
Duration of travel (hr/day)
0.5 0.5 1.0 1.0
0.5 0.5 1.0 1.0
PM2.5/BS
concentration
(µg/m3)
40,0 34.5 40.0 34.5
30.0 18.2 30.0 18.2
Table 3. Potential mortality impact of cycling compared with car driving, for 0.5- and 1-hr commute, estimated for PM2.5
and BS.a
RR, relative risk. a
Supplemental Material, Table 2 (doi:10.1289/ehp.0901747), gives details on calculations and assumptions. b
Total dose includes other time periods. cRR for cycling versus car driving.
R R mortality,
traffic 5x more toxic
1.026
1.053
1.006
1.012
Inhaled dose
(µg/day)
12.0 22.8 24.0 45.5
9.0 12.0 18.0 24.0
Total doseb for
car or bicycle
(µg/day)
246 257 252 274
126 129 132 138
Equivalent change in
PM2.5 or BS
(µg/m3
)
0.9
1.8
0.2
0.5
R R mortality,
equal
toxicityc
1.005
1.010
1.001
H
ar
Assuming equal toxicity of particles, the esti-mated relative risk associated with the change in PM2.5 inhalation due to cycling instead of car
driv-ing ranges from 1.005 to 1.010. If we assume that traffic PM is more toxic than ambient PM2.5 in
general, these relative risk estimates range from 1.026 to 1.053. This assumption is supported by an analysis of PM from different sources, indi-cating the strongest associations with mortality from traffic particles (Laden et al. 2000). If the assessment is based on BS, relative risk estimates are smaller (between 1.001 and 1.012).
Societal effects. The modal shift will reduce overall air pollution levels, which may result in health benefits of the general city population. An indication of the potential reduction in air pollu-tion was obtained by using the Dutch dispersion model CAR (Calculation of Air pollution from Road traffic) (Eerens et al. 1993). For a typical major urban street with a traffic intensity of 10,000 vehicles/day, for a 12.5% reduction in traffic intensity, concentration reductions were 1.3 µg/ m3
for nitrogen dioxide (NO2) and 0.4 µg/m 3
for particles with aerodynamic diameter < 10 µm (PM10). The relative risk of long-term exposure to NO2 expressed per 10 µg/m
3
increase on all-cause mortality is 1.10 (Tonne et al. 2008). This implies that for the approximately 800,000– 1,600,000 subjects living in major streets in the Netherlands, mortality rates could be 1.012 times lower. This relative risk is of the same order of magnitude as the estimated increased risk to the cyclist described in the previous section and ap-plies to a larger population.
Accidents
According to the WHO (2004), road traffic inju-ries accounted for approximately 2% of all glo-bal deaths, making them the 11th leading cause of global deaths. The rates of road traffic death vary considerably among countries, transport mode, type of area (urban or rural), and person. Among several European countries, the highest fatality rates are about 3.5 times higher than the lowest figures [see Supplemental Material, Fig-ure 1 (doi:10.1289/ehp.0901747)] (International Transport Forum 2010).
How safe is cycling compared with car driving
for an individual? Table 4 shows the estimated
numbers of traffic deaths per age category per billion passenger kilometers traveled by bicycle and by car (driver and passenger) in the Nether-lands for 2008 (CBS 2008). These data suggest that there are about 5.5 times more traffic deaths
per kilometer traveled by bicycle than by car for all ages, and that cycling is riskier than travel by car for all age groups except young adults (15–30 years of age), with about 9 times more deaths among those < 15 years of age, and 17 times more deaths among those > 80 years of age. The com-parison in Table 4 probably overestimates the difference between cyclists and car drivers for short trips, because the relatively safe long car trips driven on highways are included. Across Europe, 8% of traffic deaths occur on the mo-torways, whereas 25% of the kilometers driven are on motorways (European Road Transport Safety 2008). Risks for nonfatal accidents are high-er for cyclists than for car drivhigh-ers, as well [Sup-plemental Material, Table 3 (doi:10.1289/ ehp.0901747)].
How safe is cycling compared with car driving
for society? For society, the risk that car drivers
present to cyclists and pedestrians must also be taken into account. For the Netherlands, an anal-ysis has compared the risks of a fatal accident for car drivers and cyclists, including the risk to oth-er road usoth-ers (Dekostoth-er and Schollaoth-ert 1999). The analysis excluded motorways, because cyclists cannot use these roads. Mortality rates were sim-ilar for car drivers and cyclists (20.8 vs. 21.0 deaths per million kilometers traveled). People older than 50 years are less frequently involved in fatal acci-dents when driving a car than when driving a
Age category (years)
< 15 15-20 20-30 30-40 40-50 50-60 60-70 70-80 > 80 Total average (all ages) Total average (20-70 years of age)
Bicycle
4.9 5.4 4.2 3.9 6.6 9.6 18.6 117.6 139.6 12.2
8.2
Car
0.6 7.4 4.6 2.0 1.0 1.2 1.6 7.6 8.1 2.2
1.9
Table 4. Traffic deaths per age category per billion
passenger kilometers by bicycle and by car in the Netherlands.a
Data from CBS (2008). a
Estimated as age-specific and traffic mode–specific number of traffic deaths divided by amount of kilometers driven per age and traffic mode in the Netherlands for the year 2008.
Ratio
8.6 0.7 0.9 2.0 6.9 7.9 11.7 15.4 17.1 5.5
d
e C
o
le
tiv
a, 16(
12)
:4731-4744,
2011
bicycle, but the opposite is true for people 18–49 years of age [Supplemental Material, Table 4 (doi:10.1289/ehp.0901747)]. Jacobsen (2003) showed that in different European countries, the number of traffic deaths of cyclists is inversely related to the amount of cycling [Supplemental Material, Figure 2 (doi:10.1289/ehp.0901747)], suggesting a “safety-in-numbers” effect.
Assessment of the modal shift impact on traffic
accidents related mortality. For 18- to
64-year-old individuals, the risk of a fatal accident while cycling is about 4.3 times higher compared with the same distance by car (Table 4). The fatal traf-fic accident rate for cyclists 20–70 years of age is about 8.2 deaths per billion passenger kilometers traveled, whereas the risk for car drivers and pas-sengers the rate is 1.9 deaths per billion passen-ger kilometers traveled (Table 4). A population of 500,000 commuting 7.5 km/day will commute 1.36785 billion km/year (7.5 km/day × 365 days/ year × 500,000). From the data shown in Table 4, we estimate that this amount of car travel would result in approximately 2.6 deaths/year (1.9 × 1.36785). An equivalent amount of bicycle travel would result in approximately 11.2 deaths/year (8.2 × 1.36785). In the Netherlands, the all-cause mortality rate for 18- to 64-year-old persons is 235.1 per 100,000 per year (CBS 2008) or 1,176 persons per 500,000 per year. Hence, among 18-to 64-year-olds, the relative risk of all-cause mor-tality associated with a 7.5 km/day shift from driving to cycling would be [1,176 + (11.2 – 2.6)]/ 1,176 = 1.007. When we use age-specific data, rel-ative risks ranged from 0.996 to 1.010. For the 15-km scenario, age specific relative risks ranged from 0.993 to 1.020.
The societal impact of a modal switch on the number of fatal accidents largely depends on which people switch from car to bicycle. If it is the average population, the impact (including risk presented to other road users) would be practi-cally zero [Supplemental Material, Table 4 (doi:10.1289/ehp.0901747)], but if young car driv-ers switched to a bicycle, it would decrease the number of fatal accidents. The opposite is true for elderly car drivers.
Physical Activity
Levels of inactivity are high in virtually all devel-oped and developing countries. The WHO (2007a) estimates that 60–80% of the world’s population does not meet the recommendations required to induce health benefits. For Europe 62.4% inactive adults are estimated ranging from 43.3%
(Swe-den) to 87.7% (Portugal) (Varo et al. 2003). In the Netherlands about 62% of the population is sed-entary (Varo et al. 2003). The WHO estimates that the prevalence of physical inactivity accounts for 22% of cardiovascular disease prevalence glo-bally (WHO 2007a). There is sufficient evidence for an association between physical activity and mortality, cardiovascular disease (hypertension), diabetes, obesity, cancer (colon and breast), os-teoporosis, and depression (Bauman 2004; War-burton et al. 2006). Because only a few studies specifically reported on the beneficial health ef-fects of cycling, we also summarized the quantita-tive evidence of beneficial health effects of physical activity, making use of review papers.
Cycling and physical activity recommendation.
Recently, the American College of Sports Medicine and the American Heart Association published an updated recommendation for physical activity (Haskell et al. 2007). To promote and maintain health, all healthy adults 18–65 years of age need moderate-intensity aerobic physical activity for a minimum of 30 min on 5 days each week or vigor-ous-intensity aerobic activity for a minimum of 20 min on 3 days each week. Also, combinations of moderate- and vigorous-intensity activity can be performed to meet this recommendation. For young people, 60 min of moderate to vigorous physical activity on a daily basis is recommended (Strong et al. 2005). In several physical activity stud-ies, metabolic equivalent of task (MET) is used as an indicator of physical activity, and the minimum goal should be in the range of 500–1,000 MET min/ week. Leisure cycling or cycling to work (15 km/hr) has a MET value of 4 and is characterized as a moderate activity (Ainsworth et al. 2000). Hence, a person shifting from car to bicycle for a daily short distance of 7.5 km would meet the minimum rec-ommendation (7.5 km at 15 km/hr = 30 min) for physical activity in 5 days (4 MET × 30 min × 5 days = 600 MET min/week).
Health effects and assessment of the modal shift
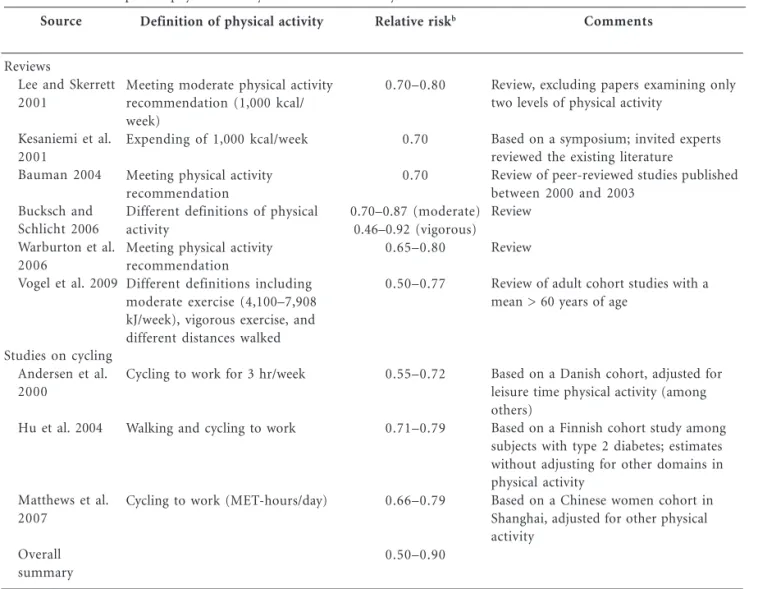
impact on mortality. Table 5 provides summary
H
ar
(Bauman 2004; Lee and Skerrett 2001;
Warbur-ton et al. 2006).
Three studies have directly assessed mortality related to cycling to work. In a prospective study in Copenhagen, the relative risk of the group bi-cycling to work was 0.72 [95% confidence interval (CI), 0.57–0.91] compared with other modes of transport after multivariate adjustment, includ-ing leisure-time physical activity (Andersen et al. 2000). The relative risk for physically active groups compared with the sedentary group decreased with activity level: 0.68, 0.61, and 0.53 (Andersen
et al. 2000). In the Shanghai Women’s Health Study,
exercise and cycling for transportation were both inversely and independently associated with all-cause mortality (Matthews et al. 2007). Hazard ratios were 0.79 (95% CI, 0.61–1.01) for the group cycling 0.1–3.4 metabolic equivalent hours per day and 0.66 (95% CI, 0.40–1.07) for the group cy-cling > 3.4 metabolic equivalent hours per day,
compared with the noncycling group. A Finnish study that combined cycling and walking to work versus nonactive commuting also showed signif-icantly lower relative risks for active commuters in the range of 0.71 and 0.79 (Hu et al. 2004). According to the reviews and the three cycling stud-ies, the relative risk for all-cause mortality is in the range of 0.50–0.90 (Table 5).
An expert panel determined a generally linear relationship between physical activity level and the rates of all-cause mortality, total cardiovas-cular disease, and coronary heart disease inci-dence and mortality (Kesaniemi et al. 2001). There is thus evidence that health gains occur for phys-ically active and nonactive persons, although the magnitude of these benefits may differ.
To calculate the potential impact of the mod-al shift on mortmod-ality, we directly used the range of relative risk estimates (0.50–0.90) presented in Table 5.
Source
Reviews
Lee and Skerrett 2001
Kesaniemi et al. 2001
Bauman 2004
Bucksch and Schlicht 2006 Warburton et al. 2006
Vogel et al. 2009
Studies on cycling Andersen et al. 2000
Hu et al. 2004
Matthews et al. 2007
Overall summary
Definition of physical activity
Meeting moderate physical activity recommendation (1,000 kcal/ week)
Expending of 1,000 kcal/week
Meeting physical activity recommendation
Different definitions of physical activity
Meeting physical activity recommendation
Different definitions including moderate exercise (4,100–7,908 kJ/week), vigorous exercise, and different distances walked
Cycling to work for 3 hr/week
Walking and cycling to work
Cycling to work (MET-hours/day)
Relative riskb
0.70–0.80
0.70
0.70
0.70–0.87 (moderate) 0.46–0.92 (vigorous)
0.65–0.80
0.50–0.77
0.55–0.72
0.71–0.79
0.66–0.79
0.50–0.90
Table 5. Potential impact of physical activity on all-cause mortality in various reviewsa and cohort studies.
aReviews used are often overlapping (reviewing the same evidence). bComparing physically active with physically less active. Comments
Review, excluding papers examining only two levels of physical activity
Based on a symposium; invited experts reviewed the existing literature
Review of peer-reviewed studies published between 2000 and 2003
Review
Review
Review of adult cohort studies with a mean > 60 years of age
Based on a Danish cohort, adjusted for leisure time physical activity (among others)
Based on a Finnish cohort study among subjects with type 2 diabetes; estimates without adjusting for other domains in physical activity
d
e C
o
le
tiv
a, 16(
12)
:4731-4744,
2011
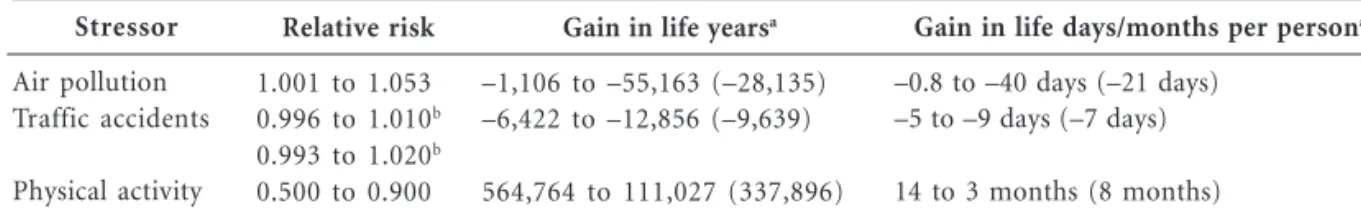
Comparison of Life Years Gained or Lost
For the people who shift from car to bicycle use for short trips, we estimated that the beneficial effect on all-cause mortality rates of the increased physical activity due to cycling is substantially larger (relative risk, 0.50–0.90) than the potential mortality effect of increased inhaled air pollution doses (relative risk, 1.001–1.053) and the effect on traffic accidents (age-specific relative risk, 0.993–1.020). The estimated gain in life expect-ancy per person from an increase in physical ac-tivity ranged from 3 to 14 months (Table 6). The estimated life expectancy lost because of air pol-lution (0.8–40 days) and traffic accidents (5–9 days) was much smaller. On average, the bene-fits of cycling were about 9 times larger than the risks of cycling, compared with car driving for the individuals making the shift, calculated as 337,896/(28,135 + 9,639). The estimated number of life years gained still exceeded the losses when the lowest estimate for physical activity was com-pared with the highest estimate for air pollution and traffic accidents (benefits/risks ratio of 2).
The largest estimated gain in life years was for the elderly [Supplemental Material, Table 6 (doi:10.1289/ehp.0901747)]. The ratio of life years gained to lost was 8.4 for persons < 40 years of age, 8.6 for persons 40–64 years of age, and 10.8 for persons > 65 years of age.
The relative benefits of a 7.5-km versus 15-km distance are probably similar. A 15-15-km dis-tance (1-hr commute) increases the life-years lost for air pollution from 20 to 40 days based on PM2.5 and increases the life-years lost for traffic
accidents from 5 to 9 days. The total estimated number of days lost per person is thus 49 for a 15-km distance and 25 for a 7.5-km distance. The relative risk of physical activity is difficult to quan-tify with the approach employed here. Using the data from Matthews et al. (2007), the relative risk would be 0.79 for the 7.5-km distance and 0.66
for the 15-km distance, assuming 4 MET associ-ated with cycling. These relative risks translate in 280 and 173 days gained, respectively.
Overall Discussion
Principal findings. We quantitatively compared the
health benefits from physical activity with the risks related to air pollution and traffic accidents be-tween cycling and car driving for short trips, dis-tinguishing the individuals who shift modes of travel from society as a whole. Estimated inhaled air pollution doses were higher in cyclists. The risk of a fatal traffic accident is higher for cyclists than for car drivers. Substantial benefits of phys-ical activity have been demonstrated, including decreased cardiovascular disease and mortality.
For the people who shift from car to bicycle, we estimated that the well-documented benefi-cial effect of increased physical activity due to cy-cling resulted in about 9 times more gains in life-years than the losses in life life-years due to increased inhaled air pollution doses and traffic accidents. For the society as a whole this can be even larger because of reduced air pollution emissions. If the risk presented to other road users is included, the risk of a fatal traffic accident is virtually the same for cyclists and car drivers.
Strengths and weaknesses. The strength of our
assessment is especially the quantitative compar-ison of benefits and risks, in a common scenario for the three stressors evaluated. It could be ar-gued that the Copenhagen (Andersen et al. 2000) and Chinese studies (Matthews et al. 2007) of the effects of bicycling on mortality have already demonstrated the net effect of physical activity on all-cause mortality, including the negative ef-fects of fatal traffic accidents and air pollution. However, the size of the potential negative health effects was not quantified separately in those stud-ies. Therefore it is difficult to transfer the net
ef-Stressor
Air pollution Traffic accidents
Physical activity
Relative risk
1.001 to 1.053 0.996 to 1.010b
0.993 to 1.020b
0.500 to 0.900
Gain in life yearsa
–1,106 to –55,163 (–28,135) –6,422 to –12,856 (–9,639)
564,764 to 111,027 (337,896)
Table 6. Summary of impact on all-cause mortality for subjects shifting from car to bicycle.
Gain in life days/months per persona
–0.8 to –40 days (–21 days) –5 to –9 days (–7 days)
14 to 3 months (8 months)
a
H
ar
fect of these studies to other locations, where traffic accident rates and air pollution may be different. Because in our assessment the separate risks have been disentangled, it is possible to make assess-ments for different settings, by using other input data (e.g., traffic mortality rates).
We performed our calculations for the Neth-erlands, where an extensive cycling infrastructure exists and priority is given to cyclists over other traffic—factors that contribute to regular cycling. Restrictions to car use through traffic calming in residential areas and car-free zones influence cy-cling behavior as well (Pucher and Dijkstra 2003). Apart from the highest average distance cycled per person, the Netherlands is also one of the safest countries in terms of fatal traffic accidents. In such countries as the United Kingdom, Spain, and France, the risk of a fatal traffic accident for cyclists is substantially higher, probably also rel-ative to car driving [Supplemental Material, Fig-ure 2 (doi:10.1289/ehp.0901747)]. When we re-peated the traffic accident calculations for the United Kingdom, where the risk of dying per 100 million km for a cyclist is about 2.5 times higher [Supplemental Material, Figure 2 (doi:10.1289/ ehp.0901747)] and assuming the same fatality risk for car drivers as in the Netherlands, resulting life expectancy losses were approximately 14 days/ person, based on 2005 population data from the United Kingdom and Wales. Overall, benefits of cycling are still 7 times larger than the risks.
Calculations on mortality impacts were per-formed for people 18–64 years of age, because people in that age range are more likely to make the modal shift. Age-specific analysis showed that the relative benefits of cycling are highest in the older age categories. This may have been even more pronounced if we had taken into account that the relative risks of physical activity may be larger for the elderly (Vogel et al. 2009). The em-pirical evidence for higher relative risks in elderly related to long-term exposure to air pollution is weak; for example, in the large American Cancer Society study there were no differences in relative risk for PM2.5 (Pope et al. 2002). We did not
in-clude children in our assessment because they are unable to drive a car, so a modal shift is not pos-sible. Because of our focus on mortality effects (being extremely rare in children), we could not quantitatively compare risks for children as car passengers or as cyclists for physical activity and air pollution. The benefits of physical activity in children are considered important, however, both for current and for future health.
Overall relative risks may largely reflect the response from sensitive subgroups. For all
stres-sors, the elderly are likely more susceptible, and we documented in an additional analysis that the ratio of benefits and risks was highest for e” 65-year-olds. For air pollution, subjects with preex-isting cardiorespiratory disease may be more susceptible, and for physical activity, sedentary people may be more susceptible; these are sub-groups that may partly overlap. Hence, both the risks and benefits may be higher than in the pop-ulation average analysis.
In summary, it is unlikely that the conclusion of substantially larger benefits from cycling than risks is strongly affected by the assumptions made in the scenario, including the use of data from the Netherlands. Because concentration–re-sponse functions are mostly based on studies in Europe and North America, they may not apply in developing countries. For air pollution, there are no studies on long-term mortality effects in developing countries. The generally higher am-bient air pollution concentrations could lead to higher losses in life-years comparing cycling and car driving. Traffic accident statistics for the Neth-erlands are probably not transferable to devel-oping countries. For physical activity, there is ev-idence from a Chinese study (Matthews et al. 2007), with very similar benefits. Hence, very large differences in concentration–response functions for air pollution and traffic accidents from the functions we used would be necessary to tip the balance between benefits and risks.
For air pollution, there is considerable evi-dence that long-term and short-term exposures are related to increased cardiopulmonary mor-tality (Brunekreef and Holgate 2002). There are no studies of mortality effects specifically related to in-traffic exposures. We estimated the effect of shifting mode using two major long-term mor-tality cohort studies (Beelen et al. 2008; Pope et al. 2002), making assumptions about the contribu-tion of traffic participacontribu-tion to the total inhaled dose of PM2.5 and (diesel) soot. Relative risks
comparing cycling and car driving were small for both approaches, with the lower estimates based upon BS probably most realistic, because this component is more specific for traffic emissions. The actual risk may be smaller because cy-clists could more easily choose a low-traffic route. The substantial influence of route has been doc-umented in various monitoring and modeling studies (Adams et al. 2001; Hertel et al. 2008;
King-ham et al. 1998; Strak et al. 2010). A study in
d
e C
o
le
tiv
a, 16(
12)
:4731-4744,
2011
exposures (Kaur et al. 2005). For cyclists, posi-tion on the road is likely important as well, be-cause it determines distance to motorized traffic emissions. Urban planning may also contribute by separating cycle lanes from heavily trafficked roads (Thai et al. 2008).
For society, reduced overall air pollution lev-els may result in lower mortality from long-term exposure of city dwellers. The potential benefits we estimated based on NO2 reductions were in
the same order of magnitude as the potential risks for the individuals shifting. Table 4 shows that the modal shift will lead to an increase in traffic accident deaths. The relative risk may be lower than we used because of the “safety-in-numbers” effect [Supplemental Material, Figure 2 (doi:10.1289/ehp.0901747)]. Car drivers may take more account of cyclists, resulting in fewer acci-dents per car-kilometer, when cyclists form a big-ger part of the traffic (Jacobsen 2003). Traffic fatality and injury rates in Germany and the Neth-erlands (with relatively high levels of cycling and walking) were relatively low compared with those of the United States (Pucher and Dijkstra 2003). However, whether this reduction is attributable to a safety-in-numbers effect or a result of more biking lanes cannot easily be disentangled. The WHO concluded that if promotion of active com-muting is accompanied by suitable transport planning and safety measures, active commuters are likely to benefit from the safety-in-numbers effect (WHO 2007b). The relative risks could also be higher because the less experienced cyclists making the shift could be more vulnerable to ac-cidents. We cannot quantify this effect.
Even when origin and destination are the same, cars and bicycles often take different routes (Witlox 2007). The same short trip for a car may be 20–50% longer than for a bicycle (our calcula-tions are based on comparisons per kilometer). If we could make a trip-based comparison, a lower relative risk for fatal accidents for cyclists com-pared with car drivers would be found. Further-more, we did not take into account the concept of constant travel time budgets (van Wee et al. 2006): A change of travel time will be compensated by a change of destination. When taking the bicycle, the shop next door is preferred over the shop with greater choices farther away. These factors would lead to lower relative risks than we used.
Relative risks for different physical activity definitions (total physical activity, meeting the physical activity guideline, active commuting) were quite consistent. An important issue is wheth-er the comparison between subjects with lowwheth-er and higher physical activity can be used to assess
the health effects of a change in physical activity related to a shift toward active commuting. Bau-man (2004) showed that persons who were al-ready in the highest quartile of fitness at baseline had a significantly lower mortality when they became even more active. In another study, peo-ple who went from unfit to fit over a 5-year peri-od had 44% relative risk reduction compared with people who remained unfit (Blair et al. 1995). The largest improvements in health status are seen in inactive persons who change their lifestyle and become physically active (Warburton et al. 2006). A review by Erikssen et al. (1998) suggest-ed similar health benefits from an increase in physical activity for active and sedentary persons. Already active persons could have lower benefits of the extra physical activity, leading to relative risks up to 0.90. If only active persons shift mode of transport, lower overall benefits of cycling compared with car driving will be found (ratio of life-years gained vs. lost, 4 instead of 9).
An increase in cycling does not necessarily lead to an increase in total physical activity, if it is asso-ciated with reduced activity in another domain (For-syth et al. 2008; Thomson et al. 2008). The empiri-cal evidence for substitution is weak, and increased fitness could also lead to more physical activity in leisure time. If we assume that for 25% of the pop-ulation no health gains occur because of substitu-tion, the ratio of benefits to risks (central estimates from Table 6) would be reduced from 8.9 to 6.7. Only if for 89% of the population no increase in total physical activity occurs because of substitu-tion would benefits and risk become equal.
We have not considered the negative effects of physical activity on health—namely, muscu-loskeletal injury and fatal and nonfatal cardiac events (Institute of Medicine 2007). Cycling can be considered a moderate type and duration of sport and has lower injury risk than do more vigorous types (running, scholastic athletics) and longer durations of physical activity (Hootman
et al. 2001; Parkkari et al. 2004). Exercise has acute
cardiac risks as well, but the absolute risk of a cardiac event during exercise seems to be low (In-stitute of Medicine 2007). Regular physical activ-ity also reduces the acute risk of a cardiovascular event (Tofler and Muller 2006).
Restriction to mortality. We limited the
physi-H
ar
cal activity and health-related quality of life (Bize
et al. 2007). The largest cross-sectional study
showed that people meeting the recommended levels of physical activity had an adjusted odds ratio of “having 14 or more unhealthy days dur-ing the previous months” of 0.4 (95% CI, 0.36– 0.45) over the inactive subjects (Bize et al. 2007). Quality of life may even further improve apart from the increases in life-years. Concentration– response functions for air pollutants and mor-bidity outcomes such as hospital admissions are lower than for mortality: in the range of 1% com-pared with 6% per 10-ìg/m3 increase in PM2.5
(WHO 2006). Traffic injuries may differ even more between cyclists and car drivers than fatal accidents [Supplemental Material, Table 4 (doi:10.1289/ehp.0901747)], if underreporting of especially cyclist accidents is accounted for. This would reduce the ratio between benefits and risks. We did not include all stressors in the quanti-tative evaluation. Cycling contributes to other benefits, including reduced emissions of carbon dioxide relevant for reducing climate change, re-duced use of physical space (e.g., related to park-ing), and reduced traffic noise for city dwellers, which may result in less annoyance. We are not aware of exposure studies or health effects stud-ies that have compared traffic noise during trans-port for cyclists and car drivers.
Suggestions for policy. Our study suggests that
policies stimulating cycling likely have net benefi-cial effects on public health. Policies should be accompanied by safety measures and efforts to limit hazards, for example, by infrastructural choices (building cycling lanes away from major roads to limit cyclists’ air pollution exposures)
or limitations such as a ban on car traffic during school start and end hours near schools. Policies may take the age dependence of the traffic acci-dent relative risks into account—for example, by stimulating especially the young to increase cy-cling. However, this may not be the optimal choice for the beneficial effects of cycling.
Assessing what traffic policies are effective in promoting a population shift from using cars toward cycling (and walking) is beyond the scope of this review. A recent review showed that tar-geted behavior change programs can change the behavior of motivated subgroups, resulting in a 5% shift of all trips at the population level in the largest study (Ogilvie et al. 2004). However, ef-fects of similar programs on the general, less motivated population are unclear. Those pro-grams may benefit from taking the public’s views into account and learning from good practices (e.g., THE PEP 2009). In particular, perceptions of walking and cycling as dangerous activities are an important barrier to the promotion of active transport (Lorenc et al. 2008).
Conclusions
On average, the estimated health benefits of cy-cling were substantially larger than the risks of cycling relative to car driving. For the society as a whole, this can be even larger because there will be a reduction in air pollution emissions and even-tually fewer traffic accidents. Policies stimulating cycling are likely to have net beneficial effects on public health, especially if accompanied by suit-able transport planning and safety measures.
Andersen LB, Schnohr P, Schroll M, Hein HO. 2000. All-cause mortality associated with physical activi-ty during leisure time, work, sports, and cycling to
work. Arch Intern Med 160:1621–1628.
Bauman AE. 2004. Updating the evidence that physical activity is good for health: an epidemiological
re-view 2000–2003. J Sci Med Sport 7:6–19.
Beckx C, Arentze T, Int Panis L, Janssens D, Vankerkom J, Wets G. 2009a. An integrated activity-based mod-elling framework to assess vehicle emissions:
ap-proach and application. Environ Plann B Plann Des
36:1086–1102.
References
Adams HS, Nieuwenhuijsen MJ, Colvile RN, McMullen
MAS, Khandelwal P. 2001. Fine particle (PM2.5)
per-sonal exposure levels in transport
microenviron-ments, London, UK. Sci Total Environ 279:29–44.
Adams HS, Nieuwenhuijsen MJ, Colvile RN, Older MJ, Kendall M. 2002. Assessment of road users’ ele-mental carbon personal exposure levels, London, UK. Atmos Environ 36:5335–5342.
Ainsworth BE, Haskell WL, Whitt MC, Irwin ML, Swartz
AM, Strath SJ, et al. 2000. Compendium of physical
activities: an update of activity codes and MET
d
e C
o
le
tiv
a, 16(
12)
:4731-4744,
2011
Beckx C, Int Panis L, Arentze T, Janssens D, Wets G. 2009b. Disaggregation of nation-wide dynamic pop-ulation exposure estimates in the Netherlands:
ap-plications of activity-based transport models.
At-mos Environ 43:5454–5462.
Beelen R, Hoek G, van den Brandt PA, Goldbohm RA,
Fischer P, Schouten LJ, et al. 2008. Long-term
ef-fects of traffic-related air pollution on mortality in
a Dutch cohort (NLCS-AIR study). Environ Health
Perspect 116:196–202.
Bize R, Johnson JA, Plotnikoff RC. 2007. Physical activ-ity level and health-related qualactiv-ity of life in the
general adult population: a systematic review. Prev
Med 45:401–415.
Blair SN, Kohl HW 3rd, Barlow CE, Paffenbarger RS Jr, Gibbons LW, Macera CA. 1995. Changes in physi-cal fitness and all-cause mortality. A prospective
study of healthy and unhealthy men. JAMA
273:1093–1098.
Boogaard H, Borgman F, Kamminga J, Hoek G. 2009. Exposure to ultrafine and fine particles and noise
during cycling and driving in 11 Dutch cities.
At-mos Environ 43:4234–4242.
Brunekreef B, Holgate ST. 2002. Air pollution and health.
Lancet 360:1233–1242.
Bucksch J, Schlicht W. 2006. Health-enhancing physical activity and the prevention of chronic diseases—an
epidemiological review. Soz Praventivmed 51:281–
301.
CBS (Statistics Netherlands). 2008. Traffic and Trans-port. Available: http://www.cbs.nl/en-GB/menu/ themas/verkeer-vervoer/cijfers/default.htm [access-ed 1 October 2009].
Commission of the European Communities. 2005. Green Paper. Promoting Healthy Diets and Physical Ac-tivity: A European Dimension for the Prevention of Overweight, Obesity and Chronic Diseases. Avail-able: http://ec.europa.eu/health/ph_determinants/ life_style/nutrition/documents/nutrition_gp_en.pdf [accessed 1 October 2009].
Dekoster J, Schollaert U. 1999. Cycling: The Way Ahead
for Towns and Cities. European Commission. Avail-able: http://ec.europa.eu/environment/archives/ cycling/cycling_en.pdf [accessed 1 October 2009]. Eerens HC, Sliggers CJ, van den Hout KD. 1993. The CAR model: the Dutch method to determine city
street air quality. Atmos Environ 27B:389–399.
Erikssen G, Liestol K, Bjornholt J, Thaulow E, Sandvik L, Erikssen J. 1998. Changes in physical fitness and
changes in mortality. Lancet 352:759–762.
European Road Transport Safety. 2008. Home page. Available: http://www.etsc.eu/home.php [accessed 1 June 2010].
Forsyth A, Hearst M, Oakes JM, Schmitz KH. 2008. Design and destinations: factors influencing
walk-ing and total physical activity. Urban Stud 45:1973–
1996.
Fruin SA, Winer AM, Rodes CE. 2004. Black carbon concentrations in California vehicles and estima-tion of in-vehicle diesel exhaust particulate matter
exposures. Atmos Environ 38:4123–4133.
Gegisian I. 2003. Personal Exposure to Elemental Carbon
at an Intersection in London [thesis]. London: Im-perial College.
Haskell WL, Lee IM, Pate RR, Powell KE, Blair SN,
Franklin BA, et al. 2007. Physical activity and public
health: updated recommendation for adults from the American College of Sports Medicine and the
American Heart Association. Med Sci Sports Exerc
39:1423–1434.
Hertel O, Hvidberg M, Ketzel M, Storm L, Stausgaard L. 2008. A proper choice of route significantly reduc-es air pollution exposure – a study on bicycle and
bus trips in urban streets. Sci Total Environ 389:58–
70.
Hootman JM, Macera CA, Ainsworth BE, Martin M, Addy CL, Blair SN. 2001. Association among phys-ical activity level, cardiorespiratory fitness, and risk
of musculoskeletal injury. Am J Epidemiol 154:251–
258.
Hu G, Eriksson J, Barengo NC, Lakka TA, Valle TT,
Nissinen A, et al. 2004. Occupational, commuting,
and leisure-time physical activity in relation to to-tal and cardiovascular morto-tality among Finnish
subjects with type 2 diabetes. Circulation 110:666–
673.
Institute of Medicine. 2007. Adequacy of Evidence for
Physical Activity Guidelines Development: Workshop Summary. Washington, DC: National Academies Press.
International Transport Forum. 2010. Home page. Avail-able: http://www.internationaltransportforum.org/ [accessed 1 October 2009].
Jacobsen PL. 2003. Safety in numbers: more walkers
and bicyclists, safer walking and bicycling. Inj Prev
9:205–209.
Kaur S, Nieuwenhuijsen MJ, Colvile RN. 2005. Pedes-trian exposure to air pollution along a major road
in Central London, UK. Atmos Environ 39:7307–
7320.
Kaur S, Nieuwenhuijsen MJ, Colvile RN. 2007. Fine particulate matter and carbon monoxide exposure concentrations in urban street transport
microen-vironments. Atmos Environ 41:4781–4810.
Kesaniemi YK, Danforth E Jr, Jensen MD, Kopelman PG, Lefebvre P, Reeder BA. 2001. Dose-response issues concerning physical activity and health: an
evidence-based symposium. Med Sci Sports Exerc
33:S351–S358.
Kingham S, Meaton J, Sheard A, Lawrenson O. 1998. Assessment of exposure to traffic-related fumes
during the journey to work. Transp Res D Transp
Environ 3:271–274.
Laden F, Neas LM, Dockery DW, Schwartz J. 2000. As-sociation of fine particulate matter from different
sources with daily mortality in six U.S. cities.
Envi-ron Health Perspect 108:941–947.
Lee IM, Skerrett PJ. 2001. Physical activity and all-cause
mortality: what is the dose-response relation? Med
Sci Sports Exerc 33:S459–S471, S493–S494. Lorenc T, Brunton G, Oliver S, Oliver K, Oakley A.
2008. Attitudes to walking and cycling among chil-dren, young people and parents: a systematic
re-view. J Epidemiol Community Health 62:852–857.
Marshall JD, Brauer M, Frank LD. 2009. Healthy
neigh-borhoods: walkability and air pollution. Environ
H
ar
Marshall JD, Granvold PW, Hoats AS, McKone TE, Deakin E, Nazaroff WW. 2006. Inhalation intake of ambient air pollution in California’s South Coast
Air Basin. Atmos Environ 40:4381–4392.
Matthews CE, Jurj AL, Shu XO, Li HL, Yang G, Li Q, et
al. 2007. Influence of exercise, walking, cycling, and
overall nonexercise physical activity on mortality
in Chinese women. Am J Epidemiol 165:1343–1350.
McCreanor J, Cullinan P, Nieuwenhuijsen MJ,
Stewart-Evans J, Malliarou E, Jarup L, et al. 2007.
Respira-tory effects of exposure to diesel traffic in persons
with asthma. N Engl J Med 357:2348–2358.
Miller BG, Hurley JF. 2003. Life table methods for
quan-titative impact assessments in chronic mortality. J
Epidemiol Community Health 57:200–206. Mobiliteitsonderzoek Nederland. 2007. Tabellenboek
[in Dutch]. Available: http://www.rws.nl/dvs/Imag-es/Tabellenboek%20MON% 202007%20v1.0_tcm 178-177711.pdf [accessed 1 March 2010].
Ogilvie D, Egan M, Hamilton V, Petticrew M. 2004. Pro-moting walking and cycling as an alternative to
us-ing cars: systematic review. Br Med J 329:763–766.
Parkkari J, Kannus P, Natri A, Lapinleimu I, Palvanen
M, Heiskanen M, et al. 2004. Active living and
inju-ry risk. Int J Sports Med 25:209–216.
Peters A, von Klot S, Heier M, Trentinaglia I, Hormann
A, Wichmann HE, et al. 2004. Exposure to traffic
and the onset of myocardial infarction. N Engl J
Med 351:1721–1730.
Pope CA III, Burnett RT, Thun MJ, Calle EE, Krewski
D, Ito K, et al. 2002. Lung cancer, cardiopulmonary
mortality, and long-term exposure to fine
particu-late air pollution. JAMA 287:1132–1141.
Pucher J, Dijkstra L. 2003. Promoting safe walking and cycling to improve public health: lessons from the
Netherlands and Germany. Am J Public Health
93:1509–1516.
Rank J, Folke J, Jespersen PH. 2001. Differences in cy-clists and car drivers exposure to air pollution from
traffic in the city of Copenhagen. Sci Total Environ
279:131–136.
Riediker M, Cascio WE, Griggs TR, Herbst MC,
Brom-berg PA, Neas L, et al. 2004. Particulate matter
ex-posure in cars is associated with cardiovascular
ef-fects in healthy young men. Am J Respir Crit Care
Med 169:934–940.
Strak M, Boogaard H, Meliefste K, Oldenwening M,
Zuurbier M, Brunekreef B, et al. 2010. Respiratory
health effects of ultrafine and fine particle exposure
in cyclists. Occup Environ Med 67:118–124.
Strong WB, Malina RM, Blimkie CJ, Daniels SR, Dishman
RK, Gutin B, et al. 2005. Evidence based physical
ac-tivity for school-age youth. J Pediatr 146:732–737. Thai A, McKendry I, Brauer M. 2008. Particulate matter
exposure along designated bicycle routes in
Vancou-ver, British Columbia. Sci Total Environ 405:26–35.
THE PEP (Transport, Health and Environment Pan-European Programme). 2009. Welcome to Healthy Transport. Available: http://www.healthytransport. com/ [accessed 1 October 2009].
Thomson H, Jepson R, Hurley F, Douglas M. 2008. Assessing the unintended health impacts of road transport policies and interventions: translating
re-search evidence for use in policy and practice. BMC
Public Health 8:339; doi: 10.1186/1471-2458-8-339 [Online 30 September 2008].
Tofler GH, Muller JE. 2006. Triggering of acute cardio-vascular disease and potential preventive strategies.
Circulation 114:1863–1872.
Tonne C, Beevers S, Armstrong B, Kelly F, Wilkinson P. 2008. Air pollution and mortality benefits of the London Congestion Charge: spatial and
socioeco-nomic inequalities. Occup Environ Med 65:620–627.
Van Roosbroeck S, Jacobs J, Janssen NA, Oldenwening M, Hoek G, Brunekreef B. 2007. Long-term
person-al exposure to PM2.5, soot and NOx in children
attending schools located near busy roads, a
vali-dation study. Atmos Environ 41:3381–3394.
Van Wee B, Rietveld P, Meurs H. 2006. Is average daily travel time expenditure constant? In search of
ex-planations for an increase in average travel time. J
Transport Geogr 14:109–122.
van Wijnen JH, Verhoeff AP, Jans HW, van Bruggen M. 1995. The exposure of cyclists, car drivers and
pe-destrians to traffic-related air pollutants. Int Arch
Occup Environ Health 67:187–193.
Varo JJ, Martinez-Gonzalez MA, De Irala-Estevez J, Kearney J, Gibney M, Martinez JA. 2003. Distribu-tion and determinants of sedentary lifestyles in the
European Union. Int J Epidemiol 32:138–146.
Vogel T, Brechat PH, Lepretre PM, Kaltenbach G, Ber-thel M, Lonsdorfer J. 2009. Health benefits of
phys-ical activity in older patients: a review. Int J Clin
Pract 63:303–320.
Warburton DE, Nicol CW, Bredin SS. 2006. Health
ben-efits of physical activity: the evidence. CMAJ
174:801–809.
World Health Organization (WHO). 2004. World Health Report on Road Traffic Injury Prevention. Geneva: WHO.
World Health Organization (WHO). 2006. WHO Air Quality Guidelines. Global Update 2005. Copenhagen:WHO Regional Office for Europe. World Health Organization (WHO). 2007a. Increasing
Physical Activity Reduces Risk of Heart Disease and Diabetes. Geneva:WHO.
World Health Organization (WHO). 2007b. Economic Assessment of Transport Infrastructure and Poli-cies. Methodological Guidance on the Economic Appraisal of Health Effects Related to Walking and Cycling. Geneva:WHO.
Witlox F. 2007. Evaluating the reliability of reported
distance data in urban travel behaviour analysis. J
Transport Geogr 15:172–183.
Zuurbier M, Hoek G, Oldenwening M, Lenters V,
Me-liefste K, van den Hazel P, et al. 2010. Commuters’
exposure to particulate matter air pollution is af-fected by mode of transport, fuel type and route.
Environ Health Perspect 118:783–789.
Zuurbier M, Hoek G, Van den Hazel P, Brunekreef B. 2009. Minute ventilation of cyclists, car and bus passengers: an experimental study. Environ Health 8:48; doi:10.1186/1476-069X-8-48 [Online 27 Octo-ber 2009].