Comparison of Electrocardiographic Criteria for
Iden-tifying Left Ventricular Hypertrophy in Athletes from
Different Sports Modalities
Nelson Samesima,I,*,#Luciene Ferreira Azevedo,II,#Luciana Diniz Nagem Janot De Matos,II,IVLeandro Santini Echenique,IVCarlos Eduardo Negrao,II,IIICarlos Alberto PastoreI
IUnidade Clı´nica de Eletrocardiografia, Instituto do Coracao (InCor), Hospital das Clinicas HCFMUSP, Faculdade de Medicina, Universidade de Sao Paulo,
Sao Paulo, SP, BR. IIUnidade de Reabilitacao Cardiovascular e Fisiologia do Exercicio, Instituto do Coracao (InCor), Hospital das Clinicas HCFMUSP, Faculdade de Medicina, Universidade de Sao Paulo, Sao Paulo, SP, BR.IIIDepartamento de Biodinaˆmica do Movimento do Corpo Humano, Escola de Educac¸a˜o Fı´sica e Esporte, Universidade de Sao Paulo, Sao Paulo, SP, BR.IVHospital Israelita Albert Einstein, Sa˜o Paulo, SP, BR.
OBJECTIVES: In athletes, isolated electrocardiogram high voltage criteria are widely used to evaluate left ventricular hypertrophy, but positive findings are thought to represent normal electrocardiogram alterations. However, which electrocardiogram criterion can best detect left ventricular hypertrophy in athletes of various sport modalities remains unknown.
METHODS:Five electrocardiogram criteria used to detect left ventricular hypertrophy were tested in 180 male athletes grouped according to their sport modality: 67% low-static and high-dynamic components and 33% high-static and high-dynamic components of exercise. The following echocardiogram parameters are the gold standard for diagnosing left ventricular hypertrophy: left ventricular mass index X134 g.m-2, relative wall thicknessX0.42 mm, left ventricular diastolic diameter indexX32 mm.m-2, septum wall thicknessX13 mm, and posterior wall thicknessX13 mm. Results for the various criteria were compared using the kappa coefficient. Significance was established atpo0.05.
RESULTS: Fifty athletes (28%) presented with left ventricular hypertrophy according to electrocardiogram findings, with the following sensitivities and specificities, respectively: 38-53% and 79-83% (Perugia), 22-40% and 89-91% (Cornell), 24-29% and 90% (Romhilt-Estes), 68-87% and 20-23% (Sokolow-Lyon), and 0% and 99% (Gubner). The Perugia and Cornell criteria had higher negative predictive values for the low-static and high-dynamic subgroup. Kappa coefficients were higher for Romhilt-Estes, Cornell and Perugia criteria than for Sokolow-Lyon and Gubner criteria.
CONCLUSION: All five evaluated criteria are inadequate for detecting left ventricular hypertrophy, but the Perugia, Cornell and Romhilt-Estes criteria are useful for excluding its presence. The Perugia and Cornell criteria were more effective at excluding left ventricular hypertrophy in athletes involved in a sport modality with low-static and high-dynamic component predominance.
KEYWORDS: ECG Criteria; Left Ventricular Hypertrophy; Dynamic Exercise; Static Exercise; Cardiac Adaptation.
Samesima N, Azevedo LF, De Matos LD, Echenique LS, Negrao CE, Pastore CA. Comparison of Electrocardiographic Criteria for Identifying Left Ventricular Hypertrophy in Athletes from Different Sports Modalities. Clinics. 2017;72(6):343-350
Received for publication onDecember 9, 2016;First review completed onJanuary 4, 2017;Accepted for publication onFebruary 17, 2017
*Corresponding author. E-mail: [email protected]
#These authors contributed equally to this work.
’ INTRODUCTION
The initial publications on the correlation of electrocardio-gram (ECG) results for left ventricular hypertrophy (LVH), which were mostly based on voltage criteria (e.g., Sokolow-Lyon,
Cornell, Gubner and many others), have shown the very low sensitivity and high specificity of ECG (1-5). However, none of these criteria were developed to evaluate an athlete’s heart, despite knowledge regarding the relevant heart adap-tations caused by high intensity exercise training (6-10). This physiologic cardiac remodeling is related to chamber enlarge-ment and increased volume and wall thickness, leading to an augmented left ventricular (LV) mass with normal sys-tolic and diassys-tolic functions (10). Moreover, the sport modality appears to influence cardiac remodeling and con-sequently the degree of LVH; these factors depend on the combination of the intensity (low, medium or high) of both the dynamic and static components of exercise (8,10-12).
DOI:10.6061/clinics/2017(06)03
Copyright&2017CLINICS–This is an Open Access article distributed under the terms of the Creative Commons License (http://creativecommons.org/licenses/by/ 4.0/) which permits unrestricted use, distribution, and reproduction in any medium or format, provided the original work is properly cited.
Interestingly, some resting ECG features, such as sinus bradycardia, first and second (Mobitz I) degree atrioventricular blocks, early repolarization, and isolated high QRS voltages, that are usually found in both amateur and professional athletes, were reported in some studies (8, 11). Many ECGs that fulfill the Sokolow-Lyon voltage criteria for LVH in trained athletes have been reported (8, 13-16). Although the previous finding by Pelliccia et al. (8) verified that there were 20% more abnormal ECGs when using the criterion of an isolated QRS voltage increase, Calore et al. (14) suggested that positive results for an isolated QRS voltage increase should not be used in highly trained athletes when evaluating LVH. Accordingly, the Sokolow-Lyon criterion (QRS voltage analysis) seems to be inadequate for young competitive athletes (15). Singla et al. (16) confirmed that a high isolated QRS amplitude is a physiological exercise training response, rather than a pathological risk factor, as was postulated for athletes (11). Nevertheless, there is no clear information regarding the usefulness of other ECG criteria or regarding which criteria is the most appropriate for detecting LVH in athletes. In addition, whether the cardiac adaptation provoked by different sport modalities (12) influences the ECG-based detection of LVH in athletes is unknown. Accordingly, the present study attempts to determine which of five ECG criteria for LVH based on echocardiographic parameters best applies to athletes depending on their sport modality.
’ METHODS
Population and Study Protocol - This cross-sectional retrospective study was conducted in 180 healthy profes-sional and amateur male endurance athletes (76 soccer players, 44 long distance runners, 11 road cyclists, 25 rowers, 8 triathletes and 16 boxers; 15 to 60 years of age) who were engaged in competitive training and were listed in the database of the sport and exercise outpatient facility of a tertiary hospital. According to the Task Force 8: Classifica-tion of Sports (12), our study group was divided into two subgroups based on their components of exercise: low-static and high-dynamic (LSHD–66.7%) and high-static and
high-dynamic (HSHD–33.3%) components of exercise. The
present study was approved by the Institutional Ethics Committee for the Analysis of Research Projects (#0101/09) in accordance with the rules of this ethics committee and our country, with no need for individual signed consent forms.
Structural and Functional Cardiac Evaluations- Echocar-diography is routinely performed to evaluate all athletes who are enrolled in the sport and exercise outpatient facility. Two-dimensional and Doppler echocardiographic studies were performed to assess the morphology of the left ventricle (LV) using a cardiac ultrasound machine (HP/Philips Sonos 5500–
Davis Medical Electronics Inc., The Netherlands). LV cavity diameters were obtained using M-mode with 2-dimensional guidance according to the guidelines of the American Society of Echocardiography (17). The LV mass was calculated as 0.8[1.04(LVDD + PWT + SWT)3 – LVDD3] + 0.6, with
values provided in grams; (LVDD = left ventricular diastolic diameter; PWT = posterior wall thickness; SWT = septum wall thickness). The volumes were measured according to the modified Simpson’s rule, and the ejection fraction was calculated as (EDV - ESV) / EDV (EDV = end-diastolic volume; ESV = end-systolic volume). Relative wall thickness (RWT) was calculated as (2 x PWT) /LVDD. All of the echocardiographic analyses were performed with the inves-tigator blinded to the ECG information.
The following criteria, considered the gold standards, were used to identify left ventricular hypertrophy (LVH) in the athletes (9,17-19). The results of this examination were accepted as a positive identification of LVH for the fol-lowing conditions:
Left ventricular mass index (LVMI)X134 g.m-2 Relative wall thickness (RWT)X0.42 mm
Left ventricular diastolic diameter index (LVDDI)X32
mm.m-2
Septum wall thickness (SWT)X13 mm and/or Posterior wall thickness (PWT)X13 mm
The ECG criteria were tested against echocardiographic parameters for the following four subgroups: (1) LVMI; (2) RWT; (3) LVDDI and/or SWT and/or PWT; (4) LVMI or RWT or LVDDI and/or SWT and/or PWT.
12-Lead Resting Electrocardiogram - All athletes under-went 12-lead ECG examination after five minutes of resting. The ECG and echocardiogram of each athlete were obtained within the range of six months, a period in which the athletes maintained an exercise training regimen. Tracings were taken with a Philips PageWriter Trim II electrocardiograph (Philips Medical Systems, Andover, MA, USA) at 25 mm/sec after the proper calibration for an amplitude of 1 mV/cm. The usual ECG parameters (heart rate, Pr interval, QRS duration, QT and QTc intervals, and P, QRS and T axes) were analyzed. The following five criteria that are most commonly used by the Hospital Electrocardiology Unit were chosen to iden-tify LVH:
1. Sokolow-Lyon (2):
R wave(V1/V2)+S wave(V5/V6)X35 mm
2. Romhilt-Estes score (X5 points) (4):
3 points:
Frontal plane: R or S wavesX20 mm or Horizontal plane: R or S wavesX30 mm Morris index (left atrial enlargement in lead V1) Strain pattern (ST segment deviation and negative T
wave in lead V6)
2 points:
Left axis deviation
1 point:
QRS durationX100 ms Intrinsicoid deflection
Although the 4-point score in the Romhilt-Estes analysis implies the possible presence of LVH, only one athlete among 17 was diagnosed with LVH according to echocar-diographic criteria. Therefore, for our study, we decided to consider the 4-point score as a negative result for LVH.
3. Cornell (3):
R wave(aVL)+S wave(V3)X28 mm
4. Gubner (1):
R wave(DI)+S wave(DIII)X22 mm
5. Perugia (5):
R wave(aVL)+S wave(V3)X24 mm or strain pattern or
Anthropometric and Maximal Cardiopulmonary Exercise Capacity Evaluations - Height and body mass were mea-sured to the nearest 0.1 cm and 0.1 kg, respectively. Body mass index was determined as weight (kg) divided by height squared (m2). Body surface area was obtained using the Dubois and Dubois formula (20). The individuals performed a progressive cardiopulmonary exercise test (93% and 33% of the athletes in LSHD and HSHD subgroups, respectively) on their specific ergometers (Treadmill: Inbramed Millennium ATL, Inbrasport, Porto Alegre, RS, Brazil; Cycle: Ergoline GmbH, ViaSprint 150P Analog, Palm Springs, CA, EUA; and Indoor rowing ergometer: Concept 2 PM4, model D, Vermont, USA) using a ramp protocol. The test duration ranged 8 to 17 minutes, as previously recommended (21). The oxygen and carbon dioxide outputs were measured via breath-by-breath analysis (Vmax SERIES 229, SensorMedics Corporation, California, USA) as described in a previous study (22).
Statistical Analyses
Data for all variables are presented as the mean±SD. The
results using ECG criteria to diagnose LVH were compared to the results obtained by echocardiography. Continuous vari-ables were compared using the non-paired T test, and categorical variables were analyzed using Fisher’s exact test (sensitivity, specificity, positive predictive value - PPV, and negative predictive value - NPV). The kappa coefficient was used to verify the agreement between each type of ECG criteria and the gold standard echocardiographic parameters. Kappa values were classified as o0 - Poor; 0–0.20 - Slight; 0.21–0.40 - Fair; 0.41–0.60 - Moderate; 0.61–0.80 - Substantial;
and 0.81–1.00 - Almost perfect (23). Statistical analyses were
performed using SPSS software. A p value p0.05 was considered significant.
’ RESULTS
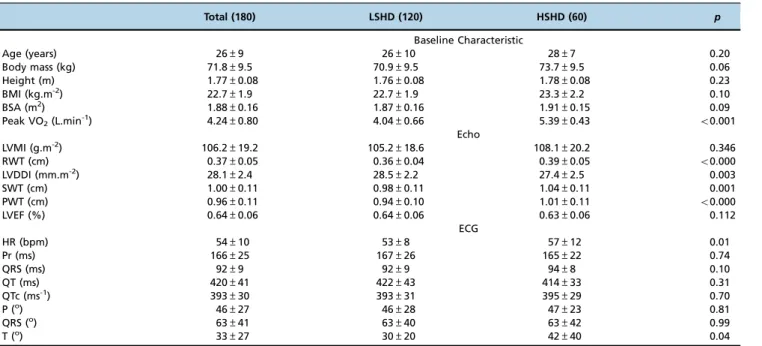
The characteristics and echocardiographic and ECG param-eters of the athletes are shown in Table 1. The athletes had normal weights (BMI from 18.5–24.9 kg.m-2), and the peak
VO2 values indicated that athletes had a high cardiopul-monary capacity. The HSHD subgroup had a higher peak VO2. Most athletes presented with LVH echocardiographic criteria within the normal range for this population. How-ever, in 50 athletes (27.8%), at least one of the five measure-ments (LVMI, RWT, LVDDI, SWT, or PWT) was higher than the cutoff value for LVH, and the number of elevated values was equally distributed between the LSHD and HSHD sub-groups. As a result of the predominance of the static exercise component in the HSHD subgroup, LVDDI was lower and RWT, SWT and PWT were higher in the HSHD subgroup than in the LSHD subgroup. The ECG findings were within the normal range for an adult male population. Each ECG criterion for LVH was applied, and the results were later compared to the echocardiogram results. The sensitivity, specificity, PPV, NPV and kappa coefficients are presented in Tables 2 to 5.
Left Ventricular Mass Indexvs.ECG Criteria–The Perugia criterion was the only criteria that provided significant accuracy for correctly identifying LVH when using LVMI for the total cohort, as well as for the LSHD subgroup, in which the criteria presented an elevated negative predictive value. Despite this result, the kappa coefficient was considered fair. None of the other criteria showed any significant results, but they did exhibit lower kappa values than that of the Perugia criterion (Table 2).
Relative Wall Thickness vs. ECG Criteria –The Romhilt-Estes and Perugia criteria provided significant accuracy for correctly identifying LVH when using RWT for all athletes, and each of these criteria presented an elevated negative
Table 1-Baseline Parameters.
Total (180) LSHD (120) HSHD (60) p
Baseline Characteristic
Age (years) 26±9 26±10 28±7 0.20
Body mass (kg) 71.8±9.5 70.9±9.5 73.7±9.5 0.06
Height (m) 1.77±0.08 1.76±0.08 1.78±0.08 0.23
BMI (kg.m-2) 22.7±1.9 22.7±1.9 23.3±2.2 0.10
BSA (m2) 1.88±0.16 1.87±0.16 1.91±0.15 0.09
Peak VO2(L.min-1) 4.24±0.80 4.04±0.66 5.39±0.43 o0.001
Echo
LVMI (g.m-2) 106.2±19.2 105.2±18.6 108.1±20.2 0.346
RWT (cm) 0.37±0.05 0.36±0.04 0.39±0.05 o0.000
LVDDI (mm.m-2) 28.1±2.4 28.5±2.2 27.4±2.5 0.003
SWT (cm) 1.00±0.11 0.98±0.11 1.04±0.11 0.001
PWT (cm) 0.96±0.11 0.94±0.10 1.01±0.11 o0.000
LVEF (%) 0.64±0.06 0.64±0.06 0.63±0.06 0.112
ECG
HR (bpm) 54±10 53±8 57±12 0.01
Pr (ms) 166±25 167±26 165±22 0.74
QRS (ms) 92±9 92±9 94±8 0.10
QT (ms) 420±41 422±43 414±33 0.31
QTc (ms-1) 393±30 393±31 395±29 0.70
P (o) 46±27 46±28 47±23 0.81
QRS (o) 63±41 63±40 63±42 0.99
T (o) 33±27 30±20 42±40 0.04
predictive value. The sport modality subgroups were not significantly different. Regardless of the accuracy, the kappa coefficient was considered fair for the Romhilt-Estes criterion and slight for the Perugia criterion. None of the other criteria provided any significant results other than low kappa values (Table 3).
Left Ventricular Diastolic Diameter Index and/or Septum and/or Posterior Wall Thickness vs. ECG Criteria - The Cornell and Perugia criteria provided significant accuracy for correctly identifying LVH when using LVDDI and/or Septum and/or PWT for all of the athletes and for the LSHD subgroup. Both criteria presented an elevated nega-tive predicnega-tive value. Despite the accuracy, the kappa coefficient was considered fair for the Cornell criteria and slight for the Perugia criterion. None of the other criteria had any significant results other than low kappa values (Table 4). Left Ventricular Mass Index or Relative Wall Thickness or Left Ventricular Diastolic Diameter Index and/or Septum and/or Posterior Wall Thickness vs. ECG Criteria - When using at least one of the three above-mentioned echocardio-graphic criteria together, the Cornell, Romhilt-Estes and Perugia criteria provided significant accuracy for correctly
identifying LVH for all of the athletes. The sport modality subgroups did not show any significant results. The three criteria presented elevated negative predictive values, and the kappa coefficient was considered fair for the Perugia criterion and slight for the Cornell and Romhilt-Estes criteria. None of the other criteria presented any significant results other than low kappa values (Table 5).
’ DISCUSSION
The present study highlights the poor accuracy of the five tested ECG criteria in correctly identifying LVH based on the results of the gold standard echocardiogram method in a population of athletes. The Perugia, Cornell and Romhilt-Estes ECG criteria presented high negative predictive values, which could be helpful for excluding the presence of LVH in athletes. Specifically, the Perugia and Cornell criteria were more effective for excluding LVH in athletes involved in sport modalities with a predominance of the dynamic com-ponent. We understand that concentric and eccentric physio-logical cardiac adaptations occur in athletes involved in sport modalities with this characteristic. Thus, the pathological
Table 2-LVMI x Electrocardiogram Criteria.
Total (179) LSHD (119) HSHD (60)
Estimate CI (95%) Estimate CI (95%) Estimate CI (95%)
Lower Upper Lower Upper Lower Upper
Sokolow-Lyon
Sensitivity 82.6 61.2 95.1 100.0 71.5 100.0 66.7 34.9 90.1
Specificity 23.1 16.7 30.5 15.7 9.5 24.1 39.6 25.8 54.7
PPV 13.7 8.4 20.5 10.8 55.1 18.5 21.6 9.8 38.3
NPV 90.0 76.4 97.2 100.0 80.5 100.0 82.6 61.2 95.5
P 0.789 0.361 0.752
Kappa Coefficient 0.018 -0.037 0.073 0.033 0.008 0.058 0.035 -0.134 0.204
Cornell
Sensitivity 26.1 10.2 48.4 27.3 6.0 61.0 25.0 5.5 57.2
Specificity 89.1 83.1 93.5 91.7 84.8 96.1 83.3 69.8 92.5
PPV 26.1 10.2 48.4 25.0 5.5 57.2 27.3 6.0 61.0
NPV 89.1 83.1 93.5 92.5 85.8 96.7 81.6 68.0 91.2
P 0.086 0.082 0.677
Kappa Coefficient 0.152 -0.030 0.334 0.182 -0.071 0.435 0.086 -0.188 0.360
Gubner
Sensitivity 0 0 0.1 0 0 28.5 --- ---
---Specificity 99.4 96.5 100.0 99.1 95.0 100.0 --- ---
---PPV 0 0 97.5 0 0 97.5 --- ---
---NPV 87.1 81.3 91.6 96.7 83.9 95.3 --- ---
---P 1.000 1.000
---Kappa Coefficient -0.011 -0.031 0.009 -0.016 -0.045 0.013 --- ---
---Romhilt-Estes
Sensitivity 26.1 10.2 48.4 18.2 2.3 51.8 33.3 9.9 65.1
Specificity 87.8 81.6 92.5 93.5 87.1 98.0 75.0 60.4 86.3
PPV 24.0 9.3 45.1 22.2 2.8 60.0 25.0 7.3 52.4
NPV 89.0 82.9 93.4 91.8 85.0 96.2 81.8 67.3 91.8
P 0.101 0.195 0.716
Kappa Coefficient 0.134 -0.044 0.312 0.127 -0.122 0.376 0.074 -0.187 0.335
Perugia
Sensitivity 47.8 26.8 69.4 45.5 16.8 76.6 50.0 21.1 78.9
Specificity 80.8 73.7 86.6 86.1 78.1 92.0 68.8 53.7 81.4
PPV 26.8 14.2 42.9 25.0 8.6 49.1 28.6 11.3 52.2
NPV 91.3 85.3 95.4 93.9 87.3 97.7 84.6 69.5 94.1
P 0.006 0.019 0.312
Kappa Coefficient 0.214 0.049 0.379 0.231 0.006 0.456 0.146 -0.101 0.393
cardiac increase would involve additional electrocardio-graphic changes in addition to the high voltage changes.
In our study, physiologic LVH was identified using at least one of the echocardiographic criteria in 50 athletes of the total cohort (27.7%). When considering each ECG criterion alone, the Perugia criterion was the one that came closest to the echocardiographic LVH diagnosis (23.3%), followed by the Romhilt-Estes score (13.9%) and the Cornell criterion (13.3%). The approximation for the Perugia criterion may have been influenced by both the Cornell and Romhilt-Estes criteria. In contrast, the Sokolow-Lyon criterion overesti-mated (77.8%) the presence of LVH, and the Gubner criterion underestimated it (0.6%). Of the three ECG criteria that presented significant results for sensitivity and specificity, the Perugia criterion showed a higher sensitivity (38-53%), followed by the Cornell criterion (22-40%) and the Romhilt-Estes score (24-29%). Notably, the sensitivity of the Perugia-based identification increased when the LVMI and LVDDI and/or septum and/or PWT echocardiographic criteria were used. Although Schillaci et al. (24) (hypertensive and older individuals) evaluated a different population, their Perugia ECG criterion sensitivity was comparable to that of our study (39%). Our sensitivity results for the Romhilt-Estes and
Cornell criteria were similar to that of Gasperin et al. (35% and 38%, respectively), who studied healthy individuals (25). In the original publication (4), the sensitivity for the Romhilt-Estes criterion was much higher (60%) than in our present study. However, this difference is probably due to the popu-lation they studied, which included individuals with serious cardiac disease. These results confirm that none of the studied ECG criteria were valid for identifying LVH in athletes. In addition, in our study, all of the criteria provided similar specificity results: the Perugia (79-83%), Cornell (89-91%) and Romhilt-Estes (90%) specificities were compar-able to the results in healthy individuals (25) but were slightly lower than those for a population with heart disease (4,24).
Subgroup analyses showed that the Perugia (Tables 2 and 4) and Cornell (Table 4) criteria could provide important addi-tional information for the LSHD subgroup. The sensitivity was 46-55% and 36%, and the specificity was 86% and 92% (Perugia and Cornell, respectively). These two ECG criteria could be useful for excluding the presence of LVH in athletes involved in sport modalities with low-static and high-dynamic components of exercise, such as long distance running and soccer.
All diagnoses of LVH were equally distributed in the LSHD and HSHD subgroups (25 athletes each). LVH was
Table 3-RWT x Electrocardiogram Criteria.
Total (179) LSHD (119) HSHD (60)
Estimate CI (95%) Estimate CI (95%) Estimate CI (95%)
Lower Upper Lower Upper Lower Upper
Sokolow-Lyon
Sensitivity 67.7 49.5 82.6 75.0 42.8 94.5 63.6 40.7 82.8
Specificiy 20.0 13.8 27.5 13.1 7.3 21.0 39.5 24.1 56.7
PPV 16.6 10.8 23.8 8.8 4.1 16.1 37.8 22.5 55.3
NPV 72.5 56.2 85.4 82.4 56.6 96.2 65.2 42.8 83.6
P 0.168 0.376 1.000
Kapa Coefficint -0.057 -0.137 0.023 -0.028 -0.089 0.033 0.027 -0.194 0.248
Cornell
Sensitivity 17.7 6.8 34.6 8.3 0.2 38.5 22.7 7.8 45.4
Specificity 88.3 81.9 93.0 89.7 82.4 94.8 84.2 68.7 94.0
PPV 26.1 10.2 48.4 8.3 0.2 38.5 45.5 16.8 76.6
NPV 82.1 75.1 87.7 89.7 82.4 94.8 65.3 50.3 78.3
P 0.393 1.000 0.511
Kappa Coefficient 0.068 -0.089 0.225 -0.019 -0.186 0.148 0.078 -0.155 0.311
Gubner
Sensitivity 0 0 10.3 0 0 26.5 --- ---
---Specificity 99.3 96.2 100.0 99.1 94.9 100.0 --- ---
---PPV 0 0 97.5 0 0 97.5 --- ---
---NPV 80.9 74.4 86.4 89.8 82.9 94.6 --- ---
---P 1.000 1.000
---Kappa Coefficient -0.011 -0.033 0.011 -0.016 -0.045 0.013 --- ---
---Romhilt-Estes
Sensitivity 29.4 15.1 47.5 8.3 0.2 38.5 40.9 20.7 63.7
Specificity 89.7 83.5 94.1 92.5 85.8 96.7 81.6 65.7 92.3
PPV 40.0 21.1 61.3 11.1 0.2 48.3 56.3 29.9 80.2
NPV 84.4 77.8 89.8 90.0 82.8 94.9 70.5 54.8 83.3
P 0.010 1.000 0.074
Kappa Coefficient 0.212 0.038 0.386 0.01 -0.174 0.194 0.239 -0.012 0.490
Perugia
Sensitivity 38.2 22.2 56.4 16.7 2.1 48.4 50.0 28.2 71.8
Specificity 80.7 73.4 86.8 83.2 74.8 89.7 73.7 56.9 86.6
PPV 31.7 18.1 48.1 10.0 1.2 31.7 52.4 29.8 74.3
NPV 84.8 77.7 90.3 89.9 82.1 95.1 71.8 55.1 85.0
P 0.024 1.000 0.093
Kappa Coefficient 0.175 0.012 0.338 -0.001 -0.173 0.171 0.239 -0.014 0.492
found in 9% and 20% of LSHD and HSHD, respectively, when the LVMI echocardiographic criterion was applied. When RWT was used, LVH was present in 10% and 37% of LSHD and HSHD, respectively. Finally, the LVDDI and/or septum and/or PWT criteria revealed the presence of LVH in 9% and 7% of athletes in the LSHD and HSHD subgroups, respectively. These results clearly demonstrate the influence of sport modality on structural cardiac adaptations. As expected, the predominance of the dynamic component leads to hypertrophy, mainly due to cavity increase (dilatation); furthermore, the predominance of the static component leads to hypertrophy, mainly due to a thickness increase (12).
Despite the poor positive predictive value, the Perugia criterion could be used to identify athletes without LVH in 78% to 95% of the study population, according to all echocardiographic criteria. Similarly, the Romhilt-Estes and Cornell criteria were useful for identifying athletes without LVH in 75% to 84% and 75% to 94%, respectively, of the study population, with the use of only two echocardio-graphic criteria. Neither the Sokolow-Lyon nor the Gubner criteria should be used to evaluate this population, because these criteria could not identify or exclude LVH in athletes.
Thus, our results demonstrate that the Sokolow-Lyon crite-rion should be used with caution, as previously demon-strated (14), and any ECG alteration identified by this set of criteria might mainly be due to physiological adaptations related to exercise training (16). The sport modality subgroup analyses showed higher negative predictive values for the Perugia and Cornell criteria in the LSHD subgroup, mainly when LVDDI and/or septum and/or PWT echocardio-graphic criteria were used. This finding could have a practical implication, since this subgroup of athletes (LSHD) presented with higher LVDDI and lower septum and PWT than did the HSHD subgroup. Thus, for the athletes involved in sports with a predominance of the dynamic component, the negative predictive value for the Perugia and Cornell criteria was higher. This finding implies an almost 100% correct exclusion of cardiac disease (LVH) when those criteria are not met in these athletes.
The kappa coefficients obtained for all ECG criteria showed that the results based on the Sokolow-Lyon (-0.06 to 0.02) and Gubner (-0.01) criteria were definitely obtained by chance. In contrast, the kappa coefficients for the Romhilt-Estes (0.10 to 0.21), Cornell (0.07 to 0.23) and Perugia (0.18 to 0.23) criteria
Table 4-LVDDI and/or Septum and/or PWT x Electrocardiogram Criteria.
Total (179) LSHD (119) HSHD (60)
Estimate CI (95%) Estimate CI (95%) Estimate CI (95%)
Lower Upper Lower Upper Lower Upper
Sokolow-Lyon
Sensitivity 86.7 59.6 98.3 90.9 58.7 99.8 75.0 19.4 99.4
Specificity 23.0 16.9 30.2 14.7 8.6 22.8 39.3 26.5 53.2
PPV 9.3 5.0 15.4 9.7 4.8 17.1 8.1 1.7 21.9
NPV 95.0 83.1 99.4 94.1 71.3 99.9 95.7 78.1 99.9
P 0.527 1.000 1.000
Kappa Coefficient 0.02 -0.019 0.059 0.012 -0.027 0.051 0.03 -0.066 0.126
Cornell
Sensitivity 40.0 16.3 67.7 36.4 10.9 69.2 50.0 6.8 93.2
Specificity 89.1 83.3 93.4 91.7 84.9 96.2 83.9 71.7 92.4
PPV 25.0 9.8 46.7 30.8 91.0 61.4 18.2 2.3 51.8
NPV 94.2 89.3 97.3 93.5 87.0 97.3 95.9 86.0 99.5
P 0.007 0.018 0.150
Kappa Coefficient 0.229 0.029 0.429 0.26 -0.001 0.521 0.187 -0.111 0.485
Gubner
Sensitivity 0 0 21.8 0 0 28.5 --- ---
---Specificity 99.4 96.7 100.0 99.1 95.0 100.0 --- ---
---PPV 0 0 97.5 0 0 97.5 --- ---
---NPV 91.6 86.6 95.2 90.8 84.1 95.3 --- ---
---P 1.000 1.000
---Kappa Coefficient -0.011 -0.031 0.009 -0.016 -0.043 0.011 --- ---
---Romhilt-Estes
Sensitivity 26.7 7.8 55.1 27.3 6.0 61.0 25.0 0.6 80.6
Specificity 87.3 81.2 91.9 94.5 88.4 98.0 73.2 59.7 84.2
PPV 16.0 4.5 36.1 33.3 7.5 70.1 6.3 0.2 30.2
NPV 92.9 87.7 96.4 92.8 86.3 96.8 93.2 81.4 98.6
P 0.232 0.036 1.000
Kappa Coefficient 0.107 -0.069 0.283 0.237 -0.039 0.513 -0.007 -0.191 0.177
Perugia
Sensitivity 53.3 26.6 78.7 54.6 23.4 83.3 50.0 6.8 93.2
Specificity 79.4 72.4 85.3 86.2 78.3 92.1 66.1 52.2 78.2
PPV 19.1 8.6 34.1 28.6 11.3 52.2 9.5 1.2 30.4
NPV 94.9 89.8 97.9 95.0 88.6 98.3 94.9 82.7 99.4
P 0.008 0.004 0.606
Kappa Coefficient 0.18 0.025 0.335 0.29 0.065 0.515 0.054 -0.122 0.230
were higher than those for the Sokolow-Lyon and Gubner criteria, albeit the values were low. There are two possible explanations for the low (fair) values of the kappa coefficient for these three criteria. First, those ECG criteria are not useful for identifying LVH. Second, the low LVH prevalence in our population (27.7%) led to low reproducibility.
In conclusion, the Perugia, Cornell and Romhilt-Estes ECG criteria appear to be the most appropriate criteria with which to exclude the presence of LVH in athletes. Additionally, using the Perugia and Cornell criteria improved the exclu-sion of LVH for the athletes involved in a sport modality with a predominance of the low-static and high dynamic components.
Study Limitations
We recognize that some limitations exist for the present study. First, the use of male athletes limited the results and conclusions to this gender. Second, a higher number of athletes with LVH would be desirable. However, this condi-tion would limit the sample size because of the low incidence of LVH in athletes (27.7% in our study when considering several echocardiographic parameters). Furthermore, Pelliccia
et al. (19) reported that only 15% of elite athletes had a left ventricular cavityX60 mm.
’ ACKNOWLEDGMENTS
We would like to thank Mr. Rogério Russito do Prado for the statistical analysis.
’ AUTHOR CONTRIBUTIONS
Samesina N and Azevedo LF provided substantial contributions to research design, or the acquisition, analysis or interpretation of data. Samesina N, Azevedo LF and de Matos LD were responsible for the manuscript draft and critical revision. All the authors submitted and approved the final version of the manuscript.
’ REFERENCES
1. Gubner R, Ungerleider HE. Eletrocardiographic criteria of left ventricular hypertrophy. Factors determining the evolution of the electrocardio-graphic patterns in hypertrophy and bundle branch block. Arch Intern Med. 1943;72(2):196-209, http://dx.doi.org/10.1001/archinte.1943.002100 80052005.
Table 5-LVMI or RWT or LVDDI and/or Septum and/or PWT x Electrocardiogram Criteria.
Total (179) LSHD (119) HSHD (60)
Estimate CI (95%) Estimate CI (95%) Estimate CI (95%)
Lower Upper Lower Upper Lower Upper
Sokolow-Lyon
Sensitivity 74.0 59.7 85.4 84.0 63.9 95.5 64.0 42.6 82.0
Specificity 20.9 14.3 29.0 13.8 7.6 22.5 40.0 23.9 57.9
PPV 26.2 19.5 34.8 20.6 13.2 29.7 43.2 27.1 60.5
NPV 67.5 50.9 81.4 76.5 50.1 93.2 60.9 38.6 80.3
P 0.549 0.754 0.794
Kappa Coefficient -0.030 -0.120 0.060 -0.008 -0.082 0.066 0.037 -0.196 0.270
Cornell
Sensitivity 22.0 11.5 36.0 20.0 6.8 40.7 24.0 90.3 45.1
Specificity 90.7 84.3 95.1 92.6 85.3 97.0 85.7 69.8 95.2
PPV 47.8 26.8 69.4 41.7 15.2 72.3 54.6 23.4 83.3
NPV 75.0 67.5 81.6 81.3 72.7 88.2 61.2 46.2 74.8
P 0.043 0.126 0.500
Kappa Coefficient 0.169 0.022 0.316 0.191 -0.011 0.394 0.106 -0.115 0.327
Gubner
Sensitivity 0 0 7.1 0 0 13.7 --- ---
---Specificity 99.2 95.8 100.0 98.9 94.2 100.0 --- ---
---PPV 0 0 97.5 0 0 97.5 --- ---
---NPV 71.9 64.7 78.4 78.8 70.3 85.8 --- ---
---P 1.000 1.000
---Kappa Coefficient -0.011 -0.033 0.011 -0.016 -0.047 0.015 --- ---
---Romhilt-Estes
Sensitivity 24.0 13.1 38.1 12.0 2.5 31.2 36.0 18.0 57.5
Specificity 89.9 83.4 94.5 93.6 86.6 97.6 80.0 63.1 91.6
PPV 48.0 27.8 68.7 33.3 7.5 70.1 56.3 29.9 80.2
NPV 75.3 67.7 81.9 80.0 71.3 87.0 63.4 47.8 77.6
P 0.028 0.395 0.238
Kappa Coefficient 0.159 0.010 0.308 0.068 -0.104 0.240 0.169 -0.072 0.410
Perugia
Sensitivity 38.0 24.6 52.9 28.0 12.1 49.4 48.0 27.8 68.7
Specificity 83.0 75.3 89.0 86.2 77.5 92.4 74.3 56.8 87.5
PPV 46.3 30.6 62.6 35.0 15.4 59.3 57.1 34.1 78.2
NPV 77.5 69.7 84.2 81.8 72.8 88.8 66.7 49.8 80.9
P 0.005 0.129 0.102
Kappa Coefficient 0.234 0.079 0.389 0.182 -0.020 0.384 0.228 -0.021 0.477
2. Sokolow M, Lyon TP. The ventricular complex in left ventricular hyper-trophy as obtained by unipolar precordial and limb leads. Am Heart J. 1949;37(2):161-86, http://dx.doi.org/10.1016/0002-8703(49)90562-1. 3. Casale PN, Devereux RB, Kligfield P, Eisenberg RR, Miller DH, Chaudhary
BS, et al. Electrocardiographic detection of left ventricular hypertrophy: development and prospective validation of improved criteria. J Am Coll Cardiol. 1985;6(3):572-80, http://dx.doi.org/10.1016/S0735-1097(85)80115-7. 4. Romhilt DW, Estes EH Jr. A point-score system for the ECG diagnosis of left ventricular hypertrophy. Am Heart J. 1968;75(6):752-8, http://dx.doi. org/10.1016/0002-8703(68)90035-5.
5. Verdecchia P, Schillaci G, Borgioni C, Ciucci A, Gattobigio R, Zampi I, et al. Prognostic value of a new electrocardiographic method for diagnosis of left ventricular hypertrophy in essential hypertension. J Am Coll Car-diol. 1998;31(2):383-90, http://dx.doi.org/10.1016/S0735-1097(97)00493-2. 6. Huston TP, Puffer JC, Rodney WM. The athletic heart syndrome. N Engl J
Med. 1985;313(1):24-32, http://dx.doi.org/10.1056/NEJM198507043130106. 7. Douglas PS, O’Toole ML, Hiller WD, Hackney K, Reichek N.
Electro-cardiographic diagnosis of exercise-induced left ventricular hypertrophy. Am Heart J. 1988;116(3):784-90, http://dx.doi.org/10.1016/0002-8703(88) 90338-9.
8. Pelliccia A, Maron BJ, Culasso F, Di Paolo FM, Spataro A, Biffi A, et al. Clinical significance of abnormal electrocardiographic patterns in trained athletes. Circulation. 2000;102(3):278-84, http://dx.doi.org/10.1161/01. CIR.102.3.278.
9. Pelliccia A, Maron BJ, Spataro A, Proschan MA, Spirito P. The upper limit of physiologic cardiac hypertrophy in highly trained elite athletes. N Engl J Med. 1991;324(5):295-301, http://dx.doi.org/10.1056/NEJM1991013132 40504.
10. Maron BJ. Sudden death in young athletes. N Engl Med. 2003;349(11): 1064-75, http://dx.doi.org/10.1056/NEJMra022783.
11. Drezner JA, Ackerman MJ, Anderson J, Ashley E, Asplund CA, Baggish AL, et al. Electrocardiographic interpretation in athletes: the‘Seattle criteria’. Br J Sports Med. 2013;47(3):122-4, http://dx.doi.org/10.1136/bjsports-2012-092067.
12. Mitchell JH, Haskell W, Snell P, Van Camp SP. Task Force 8: classification of sports. J Am Coll Cardiol. 2005;45(8):1364-7, http://dx.doi.org/10.1016/ j.jacc.2005.02.015.
13. Sharma S, Whyte G, Elliott P, Padula M, Kaushal R, Mahon N, et al. Electrocardiographic changes in 1000 highly trained junior elite athletes. Br J Sports Med. 1999;33(5):319-24, http://dx.doi.org/10.1136/bjsm. 33.5.319.
14. Calore C, Melacini P, Pelliccia A, Cianfrocca C, Schiavon M, Di Paolo FM, et al. Prevalence and clinical meaning of isolated increase of QRS voltages in hypertrophic cardiomyopathy versus athlete’s heart: relevance to
athletic screening. Int J Cardiol. 2013;168(4):4494-7, http://dx.doi.org/ 10.1016/j.ijcard.2013.06.123.
15. Speranza G, Magaudda L, de Gregorio C. Adult ECG criteria for left ventricular hypertrophy in young competitive athletes. Int J Sports Med. 2014;35(3):253-8.
16. Singla V, Jindal A, Pargaonkar V, Soofi M, Wheeler M, Froelicher V. Examining QRS amplitude criteria for electrocardiographic left ven-tricular hypertrophy in recommendations for screening criteria in athletes. J Electrocardiol. 2015;48(3):368-72, http://dx.doi.org/10.1016/j.jelectro card.2014.12.012.
17. Lang RM, Bierig M, Devereux RB, Flachskampf FA, Foster E, Pellikka PA, et al. Recommendations for chamber quantification: a report from the American Society of Echocardiography’s Guidelines and Standards Committee and the Chamber Quantification Writing Group, developed in conjunction with the European Association of Echocardiography, a branch of the European Society of Cardiology. J Am Soc Echocardiogr. 2005; 18(12):1440-63, http://dx.doi.org/10.1016/j.echo.2005.10.005.
18. Devereux RB, Lutas EM, Casale PN, Kligfield P, Eisenberg RR, Hammond IW, et al. Standardization of M-mode echocardiographic left ventricular anatomic measurements. J Am Coll Cardiol. 1984;4(6):1222-30, http://dx. doi.org/10.1016/S0735-1097(84)80141-2.
19. Pelliccia A, Culasso F, Di Paolo FM, Maron BJ. Physiologic left ventricular cavity dilatation in elite athletes. Ann Intern Med. 1999;130(1):23-31, http://dx.doi.org/10.7326/0003-4819-130-1-199901050-00005.
20. Du Bois D, Du Bois EF. A formula to estimate the approximate surface area if height and weight be known. 1916. Nutrition. 1989;5(5):303-11. 21. Buchfuhrer MJ, Hansen JE, Robinson TE, Sue DY, Wasserman K, Whipp
BJ. Optimizing the exercise protocol for cardiopulmonary assessment. J Appl Physiol Respir Environ Exerc Physiol. 1983;55(5):1558-64. 22. Azevedo LF, Perlingeiro PS, Brum PC, Braga AM, Negrao CE, de Matos
LD. Exercise intensity optimization for men with high cardiorespiratory fitness. J Sports Sci. 2011;29(6):555-61, http://dx.doi.org/10.1080/026404 14.2010.549613.
23. Landis JR, Koch GG. The measurement of observer agreement for cate-gorical data. Biometrics. 1977;33(1):159-74, http://dx.doi.org/10.2307/ 2529310.
24. Schillaci G, Verdecchia P, Borgioni C, Ciucci A, Guerrieri M, Zampi I, et al. Improved electrocardiographic diagnosis of left ventricular hypertrophy. Am J Cardiol. 1994;74(7):714-9, http://dx.doi.org/10.1016/0002-9149(94) 90316-6.