ISSN 0104-6632 Printed in Brazil
www.abeq.org.br/bjche
Vol. 27, No. 04, pp. 677 - 685, October - December, 2010
Brazilian Journal
of Chemical
Engineering
CHARACTERIZATION OF THE SELECTIVITY OF
MICROSIEVES USING A CROSS-FLOW
MICROFILTRATION SYSTEM
L. E. Gutierrez-Rivera
1, M. E. Katekawa
2, M. A. Silva
2*and L. Cescato
11Laboratório de Óptica, DFMC, Instituto de Física Gleb Wataghin,
Universidade Estadual de Campinas, Campinas - SP, Brasil. 2
Departamento de Termofluidodinâmica, Faculdade de Engenharia Química, Universidade Estadual de Campinas, 13083-970, Campinas - SP, Brasil.
E-mail: [email protected]
(Submitted: December 10, 2009 ; Revised: July 13, 2010 ; Accepted: July 14, 2010)
Abstract - Filtration through membranes is a process largely employed in the food and chemical industry to separate particles. Sieves present some advantages in relation to conventional membranes such as high homogeneity in the pore sizes, smooth surfaces, straight-through pores, etc. In this paper we compare the selectivity in the exclusion of particles by size of sieves with circular and slit pores with the same porosity. The selectivity was investigated by filtering a mixture of rutin in water in a cross-flow filtration system. The particle-size distribution of the rutin solution was measured before and after microfiltration. The results showed a high efficiency in the size exclusion of particles for microsieves with circular pores. The filtration through a commercial membrane (net filter) with similar characteristics was also characterized for comparison.
Keywords:Membrane; LIGA process; Particle separation; Retention factor.
INTRODUCTION
Microfiltration processes using the permeation of fluid through membranes are widely employed in pharmaceutical, biotechnological and food industries for removal or separation of particles (Takagia et al., 2005). The efficiency in the separation or retention of particles in the microfiltration depends on the size distribution of particles present in the solution to be filtered and on the membrane pore size distribution.
A large variety of membranes can be used in filtration systems. They can be made from different materials such as: cellulose, polypropylene, PTFE (polytetrafluoroethylene), polycarbonate, etc (Millipore, 2002). Each material presents a different chemical and mechanical resistance, pore density and pore size distribution. These membranes, however, present a random network of pores with a
wide distribution of pore sizes. The networks of pores, as well as their sizes, depend on the statistical self-assembly of material molecules during the material synthesis, or on the lamination process of the membrane sheets. The pore size distribution of membranes can be measured by several methods (Calvo et al., 1995); among these, the most usual is the Bubble Point (Hernandez and et al., 1996)
and Saile, 2004; Storkveco Inc, 2009) or Soft Lithography (Madou, 2002; Girones et al., 2006). Besides the homogeneity in the pore sizes and pore distribution, the sieves present a very smooth surface and they can be fabricated with a thickness much smaller than the pore diameter, forming a screen filter (Kuiper et al., 1998). Such properties reduce the flow resistance, increasing the velocity of filtration as well as allowing the use of the sieves in retro-cleaning processes.
The main problem in microfiltration systems employing membranes is the fouling that strongly reduces the filtration flow as well as the pore sizes of the membrane (Ho and Zydney, 2002). The fouling occurs because of the accumulation of non-permeating particles on the membranes, forming a cake layer (Takahashi et al., 1991), or by pore plugging (Bauer et al., 2008) when particles are trapped or adsorbed (Bolton et al., 2006) inside the pores.
Because the thickness of the sieve is smaller than the pore diameter and the pores have the same shape and diameter along the depth, the effect of the pore plugging and adsorption is negligible in comparison to the accumulation of particles at the surface or cake formation (Bikel et al., 2010; Brans et al., 2006). This cake formation in the sieves can be strongly reduced by using cross-flow filtration systems with lower trans-membrane pressures (Kuiper et al., 1998). In such systems, the main flow is tangential to the membrane, removing the non-permeated particles, while the permeated flow is perpendicular to the membrane surface (Kuiper and et al, 1998). In this type of device, the pressure across the membrane is much smaller than that employed in frontal flow systems; thus, they are appropriate for the use of screen type filters (Bikel et al., 2010).
Besides the cross-flow filtration system, other types of microfluidic devices that do not employ membranes have been proposed and demonstrated for separation and fractionation of particles and microorganisms (Kulrattanarak et al., 2008). Although such systems present fewer problems of particle accumulation compared to membranes, they are more expensive and applicable only for small volumes (Grujic et al., 2005). Thus, for industrial processes, filtration systems using membranes are more appropriate and microsieves are a promising alternative to substitute membranes in processes of exclusion of particles by size.
There are several papers concerning micro-sieve fabrication (Rijn et al., 1999; Girones et al., 2006; Gutierrez-Rivera et al., 2005; Gutierrez-Rivera et al., 2008), but the characterization of such sieves has
concentrated on studies of flux (Brans et al., 2006) and fouling effects (Chandler and Zydney, 2006). The ability of the sieves to separate particles by size or size exclusion is much less investigated in the literature.
In this paper, we use a conventional LIGA process to fabricate sieves with pores of different shapes but with the same porosity and characterize the ability of these sieves to separate particles by measuring the size distribution of particles of rutin in suspension before and after microfiltration.
EXPERIMENTAL
Sieve Fabrication
The process used for the fabrication of microsieves is schematized in Figure 1. It consists of three steps: photoresist lithography; nickel electroforming of the membrane and membrane release. The lithography starts with the spin coating of the positive photoresist AZ 4620 (from Clariant) on a glass substrate, previously coated with a thin conductive film ~ 30nm of Au, forming a photoresist film about 15 μm in thickness (Figure 1a). After the pre-bake of the photoresist for 20 minutes at 70oC, it is exposed, in a conventional optical lithography system, using an appropriate mask that determines the geometry of the pores (Figure 1b). The photoresist film is then developed in AZ 400 developer diluted 1:4 in deionized (DI) water for about 3 minutes, rinsed in DI water and dried under N2 flow (Figure 1c). The sieve is then electroformed in a Nickel electrochemical bath at 50oC for about 4 minutes in order to obtain the desired 10 μm thickness (Figure 1 d). The nickel film cannot be thicker than about 80% of the height of the photoresist structure, otherwise the electroformed nickel will close the sieve pores. The membrane is finally released from the substrate by submerging the sample in water and applying ultrasound (Figure 1e).
Positive Photo-Resist Thin Film Gold Glass Substrate
UV Exposure
Photo-Mask
(a) (b)
Micro-Pillars in PhotoResist Thin Film Gold
Nickel Electroforming
(c) (d)
Microsieve Released
(e)
Figure 1: Scheme of the process of fabrication of Microsieves: a) Photoresist coating; b) Mask exposure; c) Development; d) Nickel electroforming and e) Sieve release.
The Microfiltration
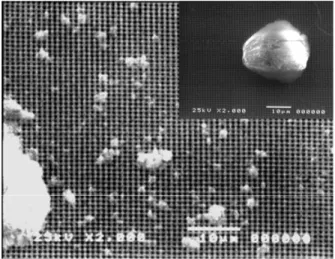
In order to analyze the selectivity of particles by the sieves, we prepared a mixture of rutin powder in distilled water (1.1 g/cm3). Figure 2 shows the SEM (Scanning Electron Microscopy) image of micro-particles of rutin on a grid. Note the large dispersion in the particle sizes and shapes. Although the rutin particles are not spherical and well defined, they were chosen because they present a large dispersion of particle sizes around the dimensions of the pores of the sieves (~ 50µm). They were also available and it was easier to prepare the mixtures. The mixture was pumped into a cross flow microfiltration module by using a peristaltic pump (Masterflex, MAM 5005) with a flow of 200 ml/min (Figure 3a). The module is composed of one inlet and two outlets and is schematized in Figure 3b. The microsieve or the net filter was mounted in the first outlet that provides the
permeate flow, while the other outlet permits the circulation of most of the fluid through the system. This microfiltration module, developed by Contri (Contri, 2002), was based on a system previously proposed (Kuiper et al., 2000). The transparent acrylic top cover of the system allows visual observation of cake formation during the filtration. The flow of 200 ml/min was chosen in order to avoid cake formation.
Figure 2: Scanning Electron Microscope (SEM) images of rutin particles.
Peristaltic Pump
Solution Reservoir
Permeate Solution Microfiltration
Module
Non-Permeate
Solution Peristaltic Pump
Solution Reservoir
Solution Reservoir
Permeate Solution Permeate Solution Microfiltration
Module Microfiltration
Module
Non-Permeate
Solution Non-Permeate
Solution
(a)
Inlet
Outlet (Permeate Solution)
Outlet
Channel MicroSieve
(b)
RESULTS AND DISCUSSION
The fabricated microsieves were analyzed by optical and Scanning Electron Microscopy (SEM). Figures 4 and 5 show SEM photographs of the fabricated sieves with circular and slit types of pores, respectively. Figures 6a and 6b show respectively the SEM photograph and the Optical Microscope photograph of a commercial Net Filter (Millipore NY41), with 31% of porosity. Note the difference between the optical and electron microcopies of the Net Filter (Figure 6a and 6b). Because of the higher focus depth of the SEM, it is possible to see the relief of the mesh of the Net Filter.
Using several top view photographic SEM images
of random areas of each sample and an image analysis program (Media Cybernetics, Inc.), we measured the pore size distribution of the circular pore microsieve, of the slit pore microsieve and of the net filter membrane. Table 1 summarizes these measurements. The mean pore (M) diameter of the circular pore sieve is 50.4 μm with a standard deviation σ = 0.9 μm, while the mean width of the slits is 53.5 μm and their mean length is 243.2 μm, with standard deviations (σ) of 1.8 μm and 2.7 μm, respectively. Although these measurements were performed for a unique sieve of each type, all the sieves fabricated by the same process presented similar results. For the net filter membrane (Millipore Company), the mean size is 40.8 μm with a standard deviation of 1.9 μm.
Figure 4: Scanning electron microscope (SEM) photograph of a Nickel microsieve with circular pores.
Figure 5: SEM photograph of a microsieve with slit-shaped pores.
(a) (b) Figure 6: (a) SEM photograph of a nylon net filter membrane from Millipore Corporation; (b) Optical
microscopy of the same filter.
Table 1: Sieve opening size for pores with different shapes
Sieve Mean Pore Size
(µm)
Standard Deviation (µm)
CircularPore 50.4 0.9
Millipore Net Filter 40.8 1.9
SlitPore (Width/Length)
53.5 / 243.2
Attempts to measure the pore size distribution of the microsieves by using a Mercury Porosimeter (Autopore 9500 from Micrometrics Instruments Corporation) were unsuccessful because the residual gold, arising from the process of electroformation of the sieves, reacted with the mercury, forming an amalgam. On the other hand, the measurement of the net filter using this same porosimeter resulted in a distribution of pore sizes much larger than that shown in Table 1. This is attributed to the pressure applied during the measurement, which could have deformed the mesh pores (Figure 6a).
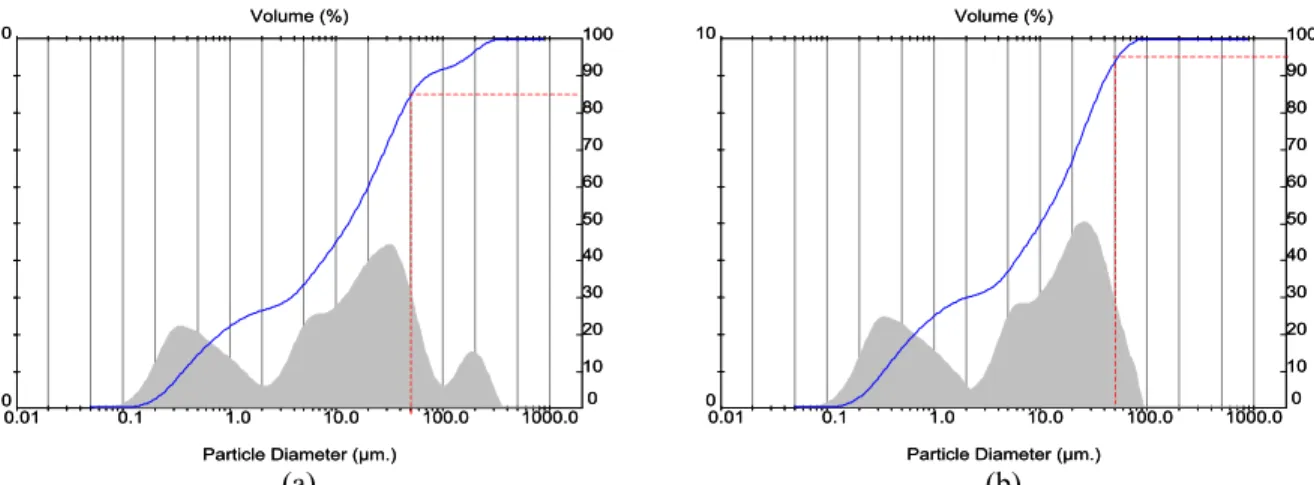
The characterization of the sieves as a filtration device was performed by measuring the particle size distribution of a solution of rutin before and after the filtration. The measurements of the particle size distribution before and after filtration are shown in Figures 7, 8 and 9. Figure 7 shows the results for the microsieve with circular pores 50 μm in diameter. From this figure, it can be observed that, before the filtration, about 24 % of the particles in the solution have sizes larger than 50 μm and about 20 % sizes larger than 60μm. After the filtration, this percentage is reduced to 1.1 % for particles larger than 50 μm, and this percentage vanishes for particles larger than 60μm. Figure 8 shows the results for the sieve with slit pores of 50 μm X 250 μm. For the filtration through slit pores (Figure 9), there is a reduction from 17 % to 6 % in the percentage of particles above 50 μm in diameter and this percentage
vanishes only for particle sizes above 90 μm. Note that the initial distributions of particle sizes of the rutin before filtration (Figure 7 and 8) are different. Although the same rutin powder and the same concentration were used, this difference probably occurs because the rutin solutions were prepared and measured at different time intervals.
Figure 9 shows the same results for a commercial nylon net-filter (Millipore, 2002) with a nominal pore size of 41μm. As can be seen, the behavior is very similar to that of the circular microsieves. There is a reduction from 38% to 1.14 % in the percentage of particles above 41μm and there are no particles larger than 60 μm in the permeated solution. Note that, in this case, there is a relative increase in the concentration of small particles after filtration through the net Filter (first maximum of the size distribution).
For the nickel sieves, we did not observe any cake formation during the cross-flow filtration, nor did we observe (by SEM) the presence of rutin particles on the sieves after filtration. For the net filter, however, we observed the presence of rutin particles during the filtration and in the SEM images of the mesh after filtration. This cake formation in the net filter could explain the relative increase of the small particles in the rutin solution after filtration. The fouling reduces the pore size, increasing the distribution of particles much smaller than the pore size in the permeate.
Particle Diameter (µm.) Volume (%)
0 10
0 10 20 30 40 50 60 70 80 90 100
0.01 0.1 1.0 10.0 100.0 1000.0 Particle Diameter (µm.)
Volume (%)
0 10
0 10 20 30 40 50 60 70 80 90 100
0.01 0.1 1.0 10.0 100.0 1000.0
Particle Diameter (µm.) Volume (%)
0 10
0 10 20 30 40 50 60 70 80 90 100
0.01 0.1 1.0 10.0 100.0 1000.0 Particle Diameter (µm.)
Volume (%)
0 10
0 10 20 30 40 50 60 70 80 90 100
0.01 0.1 1.0 10.0 100.0 1000.0
(a) (b) Figure 7: Distribution of particles obtained from the Mastersizer-particle-size analyzer. a) Initial
Particle Diameter (µm.) Volume (%) 0 10 0 10 20 30 40 50 60 70 80 90 100
0.01 0.1 1.0 10.0 100.0 1000.0 Particle Diameter (µm.)
Volume (%) 0 10 0 10 20 30 40 50 60 70 80 90 100
0.01 0.1 1.0 10.0 100.0 1000.0
Particle Diameter (µm.) Volume (%) 0 10 0 10 20 30 40 50 60 70 80 90 100
0.01 0.1 1.0 10.0 100.0 1000.0 Particle Diameter (µm.)
Volume (%) 0 10 0 10 20 30 40 50 60 70 80 90 100
0.01 0.1 1.0 10.0 100.0 1000.0
(a) (b) Figure 8: Distribution of particles obtained from the Mastersizer particle-size analyzer. a) Initial Solution:
Percentage in volume of the solution as a function of the diameter of particles. b) The same for the solution permeated through the microsieve with slit-shaped pores of 50x250 μm. The dotted vertical line corresponds to the mean slit width of 50μm.
Particle Diameter (µm.) Volume (%) 0 10 0 10 20 30 40 50 60 70 80 90 100
0.01 0.1 1.0 10.0 100.0 1000.0
Particle Diameter (µm.) Volume (%) 0 10 0 10 20 30 40 50 60 70 80 90 100
0.01 0.1 1.0 10.0 100.0 1000.0
Particle Diameter (µm.) Volume (%) 0 10 0 10 20 30 40 50 60 70 80 90 100
0.01 0.1 1.0 10.0 100.0 1000.0
Particle Diameter (µm.) Volume (%) 0 10 0 10 20 30 40 50 60 70 80 90 100
0.01 0.1 1.0 10.0 100.0 1000.0
Particle Diameter (µm.) Volume (%) 0 10 0 10 20 30 40 50 60 70 80 90 100
0.01 0.1 1.0 10.0 100.0 1000.0
Particle Diameter (µm.) Volume (%) 0 10 0 10 20 30 40 50 60 70 80 90 100
0.01 0.1 1.0 10.0 100.0 1000.0
(a) (b) Figure 9: Distribution of particles obtained from the Mastersizer particle-size analyzer. a) Initial Solution:
Percentage in volume of the solution as a function of diameter of particles. b) The same for the solution permeated through the net filter membrane of nylon with pores of 41 μm. The dotted vertical line corresponds to the mean pore size of the net filter (41 μm).
If we assume that there is no chemical or electrical interaction between the particles and the sieve, we can compare their selectivity. In order to compare the selectivity of the sieves, we define a retention factor RD as one minus the ratio between the percentage of particles in the filtered solution (Pf) with sizes above D, and the percentage of particles in the initial solution (Pi) above this same size:
f D i P R 1 P ⎛ ⎞ = −⎜ ⎟
⎝ ⎠ (1)
For RD = 1 the retention of particles above D is
100%, while for RD = 0 the retention of particles above D is 0%. We summarize the RD factor for these 3 types of filters in Table 2.
Table 2: Retention Factor
RD
Microsieve Circular Pores
of 50μm
Microsieve Slit Pores 50X250μm
Net Filter Pores 41μm
R41μm - - 0.97
R45μm - - 0.99
R50μm 0.97 0.65 1.00
R55μm 0.99 0.67 1.00
R60μm 1.00 0.75 1.00
As shown in Table 2, the micro-sieve with circular pores presents the same retention factor (0.97) as the nylon net-filter at the nominal size of the pore (50μm and 41μm, respectively) and the retention factor increases rapidly to 1 when the size of the particles is 20 % larger than the nominal size of the pores. A small retention factor (R50μm), for particles sizes larger than 50μm is observed for the microsieves with slit shaped pores. This occurs because the rutin particles used in our experiment are not symmetrical; thus, an asymmetrical particle can pass through the slits, but not through the circular pores. For spherical particles, however, the selectivity of both circular and slit pore sieves should be the same. In this case, it has been demonstrated that slit pore sieves present low flow resistance (Kuiper and et al, 2002) and less fouling (Kuiper and et al. 2000) compared to circular pore sieves with the same porosity.
CONCLUSIONS
Microsieves with circular pores exhibit a strong cutoff in the size distribution of particles in the permeate. This cutoff size is close to the nominal dimensions of the membrane pores. For such microsieves, the retention coefficient is 97% for particles with sizes larger than the nominal pore diameter (50μm). A similar behavior in the retention of particles was found for filtration through the nylon net filter, for particle sizes larger than the nominal 41μm size of the pores. Such net filters may, however, undergo deformation in the pore sizes when submitted to high pressures, as well as present cake formation in the mesh, causing an increase of particles much smaller than the pore size in the permeate. The poorer retention of particles by the slit-shaped pores occurs because the particles used in our experiment are not symmetrical.
The characterization of the selectivity of membranes by measuring the size distribution of particles in the permeate is not appropriate in the case of cake formation or pore plugging during the filtration process because, in such cases, there is a reduction in the nominal pore size of the membranes.
ACKNOWLEDGEMENTS
The authors are grateful to the "Coordenação de Aperfeiçoamento de Pessoal de Nivel Superior" (CAPES), the National Council for Scientific and Technological Development (CNPq) and the State of
São Paulo Research Foundation (FAPESP) for the financial support of this work. The authors also are grateful to Millipore Company for supplying the membranes.
REFERENCES
Bauer, D., Goyeau, B., Gobin, D., Large Particle Transport in Porous Media: Effect of Pore Plugging on the Macroscopic Transport Properties. Journal of Porous Media 11, (4), 343-360 (2008).
Bikel, M., Culfaz, P. Z., Bolhuis-Versteeg, L., Perez, G., Lammertink, R., Wessling, M., Polymeric microsieve via phase separation microfabrication: Process and design optimization. Journal of Membrane Science, 347, 93-100 (2010).
Bolton, G. R., Boesch, A. W., Lazzara, M. J., The effects of flow rate on membrane capacity: Development and application of adsorptive membrane fouling models. Journal of Membrane Science, Volume 279, Issues 1-2, 1, pp. 625-634 (2006).
Brans, G., Kromkamp, J., Pek, N., Gielen, J., Heck, J., Rijn, C., Sman, R., Schroen, C. H., Boom, R. M., Evaluation of microsieve membrane design. Journal Membrane Science, 278, 344-348 (2006). Calvo, J. I., Hernandez, A., Pradanos, P., Martinez, L.,
Bowen, W. R., Pore Size Distribution in Microporous Membranes, II Bulk Characterization of Track-Etched Filters by Air Porometry and Mercury Prosimetry. Journal of Colloid and Interface Science, 176, 467-478 (1995).
Chandler, M., Zydney, A., Effects of membrane pore geometry on fouling behavior during yeast cell microfiltration. Journal of Membrane Science, 285, 334-342, (2006).
Contri, M. A., Microsieves characterization and application in water filtration. Research Report to FAPESP (2002).
Girones, M., Akbarsyah, I., Nijdam, W., Rijn, C., Polymeric microsieves produced by phase separation micromolding. Journal of Membrane Science, 283, 411-424 (2006).
Girones, M., Akbarsyah, I. J., Nijdman, W., Rijn, C., Jansen, H. V., Lammertink, R. G. H., Polymeric microsieve produced by phase separation micromolding, Journal of Membrane Science, 283, 411-424 (2006).
Gutierrez-Rivera, L., Carvalho, E. J., Silva, M. A., Cescato, L., Metallic Submicrometer Sieves Fabricated by Interferometric Lithography and Electroforming. Journal of Micromechanics and Microengineering, v. 15, p. 1932-1937 (2005). Gutierrez-Rivera, L. E., Cescato, L., SU-8
submicrometric sieves recorded by UV interference lithography. Journal of Micromechanics and Microengineering, v. 18, n. 11, art. 115003 (6pp) (2008).
Hernández, A., Calvo, J. I., Prádanos, P., Tejerían, F., Pore size distribution in microporous membranes. A critical analysis of the bubble point extended method; Journal of Membrane Science, 112, 1-12 (1996).
Ho, C., Zydney, A., A combined pore blockage and cake filtration model for protein fouling during microfiltration. J. Colloidal Interf. Sci., 232-389 (2002).
Kuiper, S., Brink, R., Nijdam, W., Krijnen, G., Elwenspoek, M., Ceramic Microsieves: influence of perforation shape and distribution on flow resistance and membrane strength. Journal of Membrane Science, 196, 149-157 (2002).
Kuiper, S., Nijdam, C., Elwenspoek, M., Development applications of very high flux microfiltration membranes. Journal of Membrane Science, 1 (1998).
Kuiper, S., van Rijn, C. J. M., Nijdam, W., Krijnen, G. J. M., Elwenspoek, M. C., Determination of particle-release conditions in microfiltration: a simple single-particle model tested on a model membrane. Journal of Membrane Science, n. 180, p. 15-28 (2000).
Kulrattanarak, T., Sman, R. G. M., Schroen, C. G., Boom, R, M., Classification and Evaluation of
microfluidic devices for continuous suspension fractionation. Advances in Colloid and Interface Science, 142, 53-56 (2008).
Madou, M. J., Fundamentals of Microfabrication: The Science of Miniaturization. Edition IEEE, Printed in USA (2002).
Malek, C. K., Saile, V., Applications of LIGA technology to precision manufacturing of high-aspect-ratio micro-components and -systems: a review. Microelectronics Journal, Volume 35, Issue 2, Pages 131-143, (2004).
Millipore Corporation. Life Science Catalogue (2003).
Rijn, C., Nijdam, W., Kuiper, S., Veldhuis, G., Wolferen, H., Elwenspoek, M., Microsieves made with laser interference lithography for micro-filtration applications. J. Micromech. Microeng., 9, 170 (1999).
Storkveco Company, www.storkveco.com (2009). Takagia, J., Yamada, M., Yasuda, M., Seki, M.,
Continuous particle separation in a microchannel having asymmetrically arranged multiple branches. The Royal Society of Chemistry, Lab. Chip 5, 778-784 (2005).
Takahashi, K., Kobayashi, Y., Yokoto, T., Koyama, K., Measurement of Cake Thickness on Membrane for Microfiltration of Yeast Using Ultrasonic Polymer Concave Transducer. Journal of Chemical Engineering of Japan, v. 24 , n. 5 pp. 599-603 (1991).