ISSN 0104-6632 Printed in Brazil
www.abeq.org.br/bjche
Vol. 28, No. 04, pp. 585 - 596, October - December, 2011
Brazilian Journal
of Chemical
Engineering
HIGH CELL DENSITY STRATEGY FOR
POLY(3-HYDROXYBUTYRATE) PRODUCTION
BY
Cupriavidus necator
J. L. Ienczak, L. K. Quines, A. A. de Melo, M. Brandellero, C. R. Mendes,
W. Schmidell and G. M. F. Aragão
*Department of Chemical Engineering and Food Engineering, Federal University of Santa Catarina, UFSC, Phone: + (55) (48) 3721-9448, Fax: + (55) (48) 3721-9687, P.O. Box 476,
CEP: 88040-900, Florianópolis - SC, Brazil. E-mail: [email protected]
(Submitted: April 9, 2010 ; Revised: May 18, 2011 ; Accepted: July 22, 2011)
Abstract - Poly(3-hydroxybutyrate) (P(3HB)) is a carbon and intracellular storage source for different microorganisms and its production can achieve high productivities by means of high cell density cultures. The aim of this study was to propose a high cell density strategy for P(3HB) production by Cupriavidus necator. The exponential growth phase demands an accurate control of the oxygen transfer system in the bioreactor, due to maximum specific growth rate (µXr), and, consequently, a maximum specific oxygen uptake rate
(QO2), in addition to significant residual biomass (Xr) growth in high cell density cultures. In this context, this
work investigated the strategy for obtaining high cell density, with the inclusion of a linear growth phase for P(3HB) production by C. necator in a fed-batch culture. The linear growth phase was included between the exponential growth phase and the P(3HB) production phase as a strategy to reduce the specific growth rate (µXr) and specific oxygen uptake rate (QO2), with constant residual biomass growth rate (d(V.Xr)/dt = k =
constant) and linear increase of biomass. Three strategies of culture were performed. The results showed that a high residual biomass concentration (30 gXr.L-1) can be reached by the inclusion of the linear growth
strategy and specific growth rates (μXr) between 0.08 and 0.05 h -1
, at the beginning of the production phase, are necessary to attain a high P(3HB) productivity.
Keywords: P(3HB); High density culture; Linear growth phase; Cupriavidus necator.
INTRODUCTION
In response to the problems associated with synthetic polymers, the public tendency, the scientific interest and the governments’ determination have worked together over the past two decades to support the development of a new class of plastics (Keshavarz and Roy, 2010). Polyhydroxyalkanoates (PHA) are a group of polyesters that have drawn increasing attention for application as bioplastics because of their biodegradability and ability to be produced from renewable raw materials (Bengtssona et al., 2010). These biodegradable polymers are biocompatible and
nontoxic, which makes them of great interest for use in the medical and pharmaceutical industries. Currently, poly(3-hydroxybutyrate) (P(3HB)) and its co-polymer, poly(3-hydroxybutyrate-co-3-hydroxyvalerate)
production, including the use of low value substrates (agricultural or industrial waste or surplus feedstocks) (Aragão et al., 2009; Dalcanton et al., 2010; Lee et al., 2008; Reddy et al., 2003), mixed microbial cultures (reviewed by Dias et al., 2006; Serafim et al., 2008), and the development of efficient cultivation strategies, among which are cultures for high cell density production in the shortest time (Kulpreecha et al., 2009; Ahn et al., 2001; Khanna and Srivastava, 2005).
For the production of this biopolymer on a large scale, a high cell concentration (high cell density culture) must be obtained during the growth phase, followed by a production phase with a high polymer percentage in the cell. Since PHA is accumulated intracellularly, the productivity is directly proportional to cell density in the fermentation process (Grage et al., 2009). In this context, processes with high cell concentrations are desirable and provide advantages for PHA production, especially the reduction of culture volume, downstream facilities, reduction of liquid waste, lower production costs, and lower investment in equipment, compared to cases with a low cell concentration. However, strategies for high cell density have many drawbacks, including inhibition by substrate, high demand for oxygen during the process due to the high specific oxygen uptake rate, and formation of growth inhibitor byproducts (Lee, 1996).
Due to the complexity of the topic, strategies to achieve high cell density should be adequately defined, in order to have a process with a high concentration of biomass, minimal costs, and a product in the shortest time possible. Currently, continuous cultures, fed batch and cyclic or repeated fed batch modes are the main cultures for PHA production at high cell density. For P(3HB) production, fed batch cultivations have been widely used in order to achieve high cell density (Rocha et al., 2008; Shang et al., 2003; Wang and Lee, 1997; Yamane et al., 1996; Kulpreecha et al., 2009), which increases the productivity of the system, leading to low investment and reduced production costs.
In order to simplify the control of the culture, a linear growth can be established during the growth phase (Diniz et al., 2004) until a desired biomass concentration is reached. The exponential growth phase for high cell density cultures presents higher specific growth rates (µXr), high biomass concentration (Xr), and, consequently, a higher specific oxygen uptake rate (QO2) that can result in undesirable limitations of oxygen. Linear growth is characterized by the constant flow feed of the carbon
source (S), where there is no accumulation of substrate (d(S.V)/dt = 0) in the reactor, with a constant residual biomass growth rate (dXr/dt). Residual biomass (Xr) is the active biomass in the process, i.e., the cell mass without the P(3HB) mass. Therefore, the linear growth phase for P(3HB) production has a lower specific growth rate (µXr) and specific oxygen uptake rate (QO2) than the exponential growth phase. These statements can be observed by the following, beginning with the oxygen balance in the liquid:
(
)
O2
L S O2 O2
dC
k a C C Q Xr
dt = − − (1)
where:
kLa = volumetric oxygen transfer coefficient (h -1
); CS = dissolved oxygen saturation concentration in the broth (mgO2.L-1);
CO2 = dissolved oxygen concentration (mgO2.L -1
); QO2 = specific oxygen uptake rate (mgO2.gcell
-1 .h-1); Xr = residual biomass (gcell.L-1).
Assuming that the dissolved oxygen concentration does not present changes due to a system for control of this concentration at a certain percentage (f) of the dissolved oxygen saturation concentration (CO2 = fCS), so that dissolved oxygen is not limiting for the biological process, gives:
(
O2)
L
S
Q Xr
k a
1 f C
=
− (2)
QO2 may depend on the specific growth rate:
O2 O2 Xr
Xr O2
1
Q m
Y
= + μ (3)
where:
mO2 = oxygen uptake for cell maintenance (mgO2.gcell-1.h-1);
YXr/O2 = residual biomass yield from oxygen (g.g-1); µXr = specific growth rate (h-1).
(
)
Xr max.t
O2 Xrmáx 0
Xr O2 L
S
1
m Xr e
Y k a
1 f C
μ
⎛ ⎞
⎜ + μ ⎟
⎜ ⎟
⎝ ⎠
=
− (4)
However, to establish a growth in which Xr increases linearly with time (Xr = Xr’0+ kt with Xr’0: = cell concentration at the beginning of the linear phase, dXr/dt = k = constant, and μXr = k/Xr), Eq. (2) becomes:
(
)
O2 Xr O2 L S k m Xr Y Xr k a1 f C
⎛ ⎞
⎜ + ⎟
⎜ ⎟
⎝ ⎠
=
− (5)
Introducing the linear growth (Xr = Xr’0 + kt) into Equation (5) and rearranging, this equation becomes:
(
)
(
)
O2 Xr 0
O2 O2
L
Xr S S
O2
m Y Xr ' k
m k
k a t
Y 1 f C 1 f C
+
= +
− − (6)
Therefore, kLa varies linearly with time and not exponentially, which allows an easier control of the dissolved oxygen concentration in the broth.
In this context, this work investigated the strategy for obtaining high cell density, with the inclusion of a linear growth phase in P(3HB) culture production by C.necator in a fed-batch culture.
MATERIAL AND METHODS
Materials
The microorganism used in this study was Cupriavius necator DSM 545 (Deutsche Sammlung von Mikroorganismen und Zellkulturen, Braunschweig, Germany). Poly(3-hydroxybutyrate) (P(3HB)) and 3.5-dinitrosalicylic acid were purchased from Aldrich (Sigma-Aldrich, St. Louis, USA). All reagents used in the mineral medium were of analytical grade and were purchased from Vetec (Vetec Química Fina Ltda., Rio de Janeiro, Brazil). The acid and base solutions were prepared by using reagents from Nuclear (CAQ-Casa da Química Ind. e Com. Ltda, Diadema-SP, Brazil). Nutrient broth medium (Difco™, Le Pont de Claix, France) was used in the reactivation of microorganisms.
Methods
Microorganisms and Seed Cultures
The strain was maintained in 50 % glycerol at -80°C. Cultures were performed by using two seed cultures. In the first one, the cells were grown in 5.0 g.L-1 of meat peptone and 3.0 g.L-1 of meat extract (Nutrient Broth - Difco™). The second seed culture was obtained in a mineral medium (MM) without nitrogen limitation, as described by Aragão et al. (1996), with modifications, and was composed of (in g.L-1): glucose 20.0; fructose 20.0; KH2PO4 1.0; ferric ammonium citrate 0.06; CaCl2.2H2O 0.01, MgSO4.7H2O 0.5, urea 2.27, nitrilotriacetic acid 0.19 and trace nutrients 1 mL.L-1. The trace nutrient solution was composed of (in g.L-1): H3BO3 0.3, CoCl2.6H2O 0.2, ZnSO4.7H2O 0.1, MnCl2.4H2O 0.03, Na2MoO4.2H2O 0.03, NiCl2.6H2O 0.02, and CuSO4.5H2O 0.01.
Both seed cultures were incubated in a rotary shaker (New Brunswick Sci. Company Inc., New Jersey, USA) at 35ºC and 150 rpm for 24 h. The second seed culture was used to inoculate the bioreactor for high cell density growth. Cells were inoculated in a bioreactor at the moment of the exponential growth phase.
High Cell Density Cultures
High cell density cultures were carried out in a 5 L bioreactor (BIOFLO 110, New Brunswick Sci. Company Inc., New Jersey, USA), with an initial volume of 3 L of the same mineral medium, but with modification of the KH2PO4 concentration to 2.63 g.L-1 and an initial urea concentration of 6 g.L-1.
Three strategies for high cell density cultures (A, B and C) were performed. In all strategies the temperature was maintained at 35ºC and the pH adjusted to 7.0 with NaOH 2.5 mol.L-1 or HCl 2.7 mol.L-1. The ranges of the impeller speed (400 to 950 rpm) and specific air flow rate (0.125 – 1.0 vvm) were frequently utilized during the high cell density culture, in order to provide adequate mixing and a supply of oxygen to the cells.
Initially, an exponential growth with a carbon source concentration (S) of 40 g.L-1 was carried out until glucose/fructose concentration reduction for the production of nearly 20 gXr.L-1 (based on YXr/S = 0.5 g.g-1) in all strategies. As mentioned before, the linear growth phase was established at a constant feed rate (3.0 g.L-1.h-1) and without accumulation of substrate (d(S.V)/dt = 0), and with a constant growth rate (dXr/dt = 1.5 gXr.L
-1
concentration used to continuously feed the bioreactor was 500 g.L-1.
Table 1 shows the strategies for all cultures (A, B and C) used for high cell density.
According to Table 1, all cultures had the initial concentration of carbon source (Si) and nitrogen source (Ni) of 40 g.L
-1
and 2.0 g.L-1, respectively. Two nitrogen pulses of 1.0 g.L-1 were performed for all cultures at the exponential growth phase in order to avoid limitation. Culture A was carried out without the polymer production phase. Therefore, this culture showed only two phases: an exponential growth phase and a linear growth phase.
In strategy B, an exponential growth phase was performed to obtain around 20 gXr.L-1, followed by a linear growth phase to obtain around 30 gXr.L-1,and next a P(3HB) production phase. Carbon source pulses were realized when nitrogen source limitation occurred (strategy B, Table 1), varying the useful volume from 3 to 4 L. The production phase was verified by the increase of dissolved oxygen concentration in the culture medium.
The culture based on strategy C was similar to strategy B, but with a shorter time in the linear growth phase. In this culture, carbon source pulses were established before nitrogen limitation, varying the volume from 3 to 4 L.
All the culture strategies (A, B and C) were fed with the same nitrogen source concentration (Table 1) to obtain 30 gXr.L-1, based on YXr/N = 8.0g.g-1 (Schneider, 2006). The production phases for cultures B and C were performed using nitrogen source exhaustion and carbon source pulses (Table 1) to maintain the carbon substrate concentration in the reactor above 20 g.L-1.
Analytical Determinations
Cell density was determined indirectly by absorbance at 600 nm during the culture and directly by gravimetric analysis. The carbon source concentration and residual nitrogen concentration
were determined by the 3.5-dinitrosalicylic (DNS) acid method (Miller, 1959) and the enzymatic kit-colorimetric method (Urea-ES - Gold Analisa Diagnóstica Ltda, Belo Horizonte, Brazil), respectively. The P(3HB) concentration was determined by gas chromatography, according to the methanolysis method based on Braunegg et al. (1978) with the modifications proposed by Brandl et al. (1988). The dissolved oxygen concentration was measured with a galvanic electrode (Mettler-Toledo GmbH, Switzerland).
Oxygen Transfer
The global oxygen uptake rate (QO2Xr) and the specific oxygen uptake rate (QO2), as well as the volumetric oxygen transfer coefficient (kLa) were determined by the Dynamic Method (Taguchi and Humphrey, 1966). Through this method, the dissolved oxygen concentration (CO2) in the culture broth during a short interruption of the aeration, when the oxygen transfer rate is null, was plotted against time. Then, it was possible to obtain the global oxygen uptake rate (QO2Xr) from the slope of the decline in oxygen concentration. In fact, when the term of transfer is null, Equation (1) gives:
O2
O2
dC
Q Xr
dt = − (7)
or
O2 0 O2
C =C −Q Xr.t (8)
where:
C0 = dissolved oxygen concentration when the transfer of oxygen was interrupted (mgO2.L-1).
The specific oxygen uptake rate (QO2) was determined as the ratio between the global oxygen uptake rate (QO2Xr) and the residual biomass (Xr). Table 1: Culture conditions for strategies A, B and C conducted in fed batch mode.
Strategies Conditions
A B C
Si (g.L-1) 40 40 40
Ni (g.L-1) 2 2 2
Nitrogen pulses at the
exponential phase (g.L-1) 2 pulses of 1.0 2 pulses of 1.0 2 pulses of 1.0
Linear growth phase
Beginning: at the carbon source reduction
End: nitrogen limitation
Beginning: at the carbon source reduction
End: nitrogen limitation
Beginning: at the carbon source reduction
End: before complete nitrogen limitation
Nitrogen limitation No Yes Yes
Production phase - Carbon source pulses Carbon source pulses
Reconnecting the air injection when the O2 concentration is still above the critical values (between 20 and 30 % in relation to Cs) the volumetric oxygen transfer coefficient (kLa) was obtained by the Dynamic Method. After reconnection of the aeration, a consequent increase occurred in the amount of dissolved oxygen. It was considered that the rate of respiration (QO2Xr) was constant and that the system returned to the initial concentration of oxygen (C0). Thus, by plotting CO2 against (t-t1) (t1= time where CO2=C01) (Equation (9)) and by adjusting via a nonlinear regression the data taken from aeration and agitation, the kLa value was obtained.
(
)
k a t tL ( 1)0 0 01
C=C − C −C ⋅e− − (9)
where: C01= dissolved oxygen concentration at the moment when aeration was reconnected in time t1 (mgO2.L-1).
Kinetics Analysis
Xt (total biomass) and P(3HB) were adjusted by the Lissage program (Simões, Arroyo and Uribelarrea from the Institut National des Sciences Appliquées - Toulouse, France). Residual biomass concentration (Xr) was obtained from the difference between the adjusted values of the total biomass (Xt) and P(3HB). The specific growth rate (µXr) at the exponential growth phase was calculated from the linear fit to the data of ln (Xr) versus time. The slope of the best fit straight line corresponded to the maximum μXr value. The values of µXr for the linear phase were calculated from the polynomial fit of Xr versus time and the equation which defines μXr (Eq. (10)).
r Xr
r
1 dX
X dt
μ = ⋅ (10)
RESULTS
In all figures, the evolution of biomass, substrate and polymer were expressed in mass (g) to facilitate data analysis, without the interference of volume variation (fed-batch process).
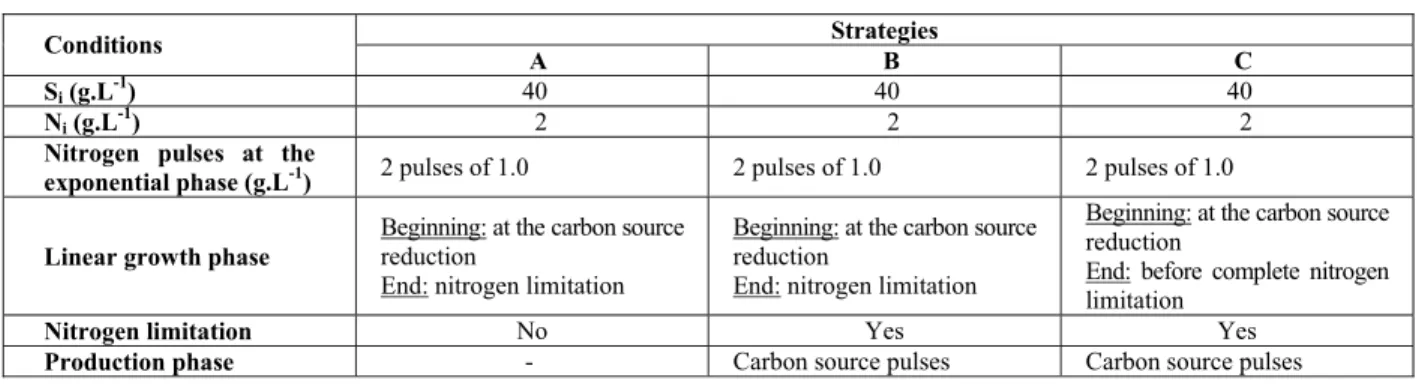
The results for total biomass (Xt), residual biomass (Xr), poly(3-hydroxybutyrate) (P(3HB)) production and carbon source (S) for strategy A are
shown in Figure 1(a). Figure 1(b) shows the specific growth rate (µXr) and specific oxygen uptake rate (QO2) for strategy A. Figure 1(a) shows that, Xr grew exponentially from 0 to 13 h of the culture. Subsequently (from 14 to 39 h of the culture), a linear growth phase with a very low residual carbon source (S) was observed. In this culture (Figure 1(a)) about 100 gXr were produced (equivalent to 30.3 gXr.L
-1
, final volume of 3.3 L), confirming that it is possible to achieve a high cell density through the use of the linear growth strategy. According to the literature, concentrations of about 30 to 40 g.L-1 of residual biomass (biomass without polymer) are considered to be a high cell density for the production of poly-hydroxyalkanoates (Ryu et al., 1997; Aragão, 1996). Ahn et al. (2001) obtained a high cell density culture of Escherichia coli GSC 4401 recombinant for P(3HB) production through the use of an external fed-batch cell recycle. The results obtained by these authors showed a residual biomass of about 26 g.L-1, which is close to our result applying strategy A.
Figure 1(b) shows the profile of μXr and QO2 versus time for culture A. In this figure, 0 to 13 h indicates the exponential growth phase, where μXr mantained a maximum plateau of μXr values equal to 0.20 h-1. The linear growth phase was characterized by the decrease in both μXr and QO2 from 14 to 39 h of culture. The μXr values were in the range of 0.133 to 0.032 h-1 for thelinear phase.
During the exponential growth phase, Xr = Xr0eµXr.t (where Xr0 = initial cellular concentration at time t = 0). However, from 14 to 39 h of culture (Figure 1(a)) Xr grows linearly with time (Xr = Xr’0+ kt where Xr’0: = cell concentration at the beginning of the linear phase, dXr/dt = k = constant, and μXr = k/Xr). Therefore, as can be observed by μXr values adjusting in the linear phase (Figure 1(b)), there is an decrease with time of the μXr values.
(a)
(b)
Figure 1: Profile of high cell density culture A: (a) total biomass (Xt) (■), residual biomass (Xr) (-), poly(3-hydroxybutyrate) (P(3HB)) (□), carbon source (S) (♦); (b) specific growth rate (μXr) (-), and specific oxygen uptake rate (QO2) (-.-.-.). The continuous line represents the Lissage fit and (- -) represents a fit of the specific growth rate at linear growth.
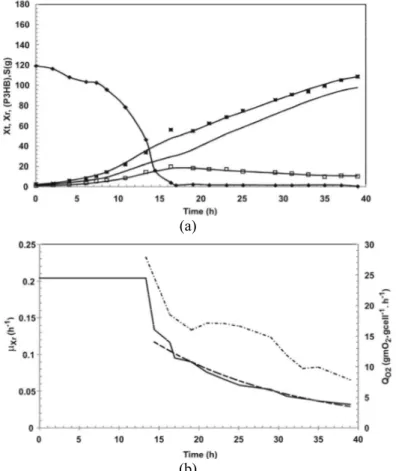
Figure 2 shows the total biomass (Xt), residual biomass (Xr), poly(3-hydroxybutyrate) (P(3HB)), and carbon source (S) for strategy B. The specific growth rate (µXr), and specific oxygen uptake rate (QO2) for strategy B are shown in Figure 2(b). In Figure 2(a), note that the exponential growth phase occurred up to 16 h of culture, followed by a linear growth phase when the residual carbon source was nearly zero. By the end of this phase, when nitrogen limitation occurred (34 h of culture and 0.4 g.L-1 of nitrogen), a pulse of carbon source was given to increase the carbon source to about 120 g. At the end of the culture B, about 90 gXr were produced (corresponding to 23 gXr.L-1, final volume of 3.9 L). As indicated in Figure 2 (a), strategy B showed a low P(3HB) production (corresponding to about 26 % of the total biomass).
Figure 2 (b) shows the profile of µXr and QO2 versus time for strategy B. In this figure, the maximum value of μXr (0.22 h-1) is observed between 4 and 16 h of culture, followed by its decrease until the end of the culture, while the μXr value at the beginning of the P(3HB) production phase was 0.045 h-1 (34 h of culture). Aragão (1996) observed that a minimum
value (0.08 h-1) of μXr during the production phase is necessary to obtain high poly(3-hydroxybutyrate) productivity by C. necator. Therefore, the low P(3HB) percentage (about 26 %) observed in strategy B may be linked to the low μXr values (about 0.045 and 0.025 h-1, respectively) observed in the production phase. Indeed, the QO2 values for this period were lower than 5.0 mgO2.gcell-1.h-1. QO2 is an important indicator of cellular physiological state and can be utilized for process monitoring. QO2 can be determined by utilizing the QO2Xr values obtained periodically through the Dynamic Method in this work and the cell concentration, which can be estimated from the known residual biomass yield from nitrogen (YXr/N). So it is not surprising then that, as illustrated in Figure 2(b), the low values of QO2 (lower than 5.0 mgO2.gcell
(a)
(b)
Figure 2: Profile of high cell density culture B: (a) total biomass (Xt) (■), residual biomass (Xr) (-), poly(3-hydroxybutyrate) (P(3HB)) (□), carbon source (S) (♦); (b) specific growth rate (μXr) (-), and specific oxygen uptake rate (QO2) (-.-.-.), the continuous line represents the Lissage fit.
Diniz and coworkers (2004) performed a study of high cell density culture of Pseudomonas putida for PHAMCL (medium chain length polyhydroxyalkanoate) production by using three strategies. The first one was based on a fed-batch culture by pulses of the carbon source, the second was continuously fed with carbon source during a linear growth of the residual biomass, and in the last one the carbon source was exponentially-fed. These authors reported that, when a carbon source-limiting flow was used (strategies II and III), lower specific growth rates were observed. However all strategies yielded high cell density (about 30 g.L-1 of Xr). Furthermore, in all strategies the carbon source concentration was lower than 1 g.L-1 at the end of the growth phase and the biomass at the end of the culture had a low PHAMCL content (3 – 15%). These authors did not investigate a possible relation
between the low polymer concentration and µXr values at the beginning of the production phase since the carbon source was limited (lower than 1 g.L-1) in this phase of the culture, which may indicate a low µXr. Based on Aragão (1996), in order to improve the P(3HB) production in the current study, and considering results presented by Diniz et al. (2004), strategy C was carried out. This strategy aimed at increasing the specific growth rate at the beginning of the P(3HB) production phase by raising the carbon source concentration in the culture medium before nitrogen limitation.
(a)
(b)
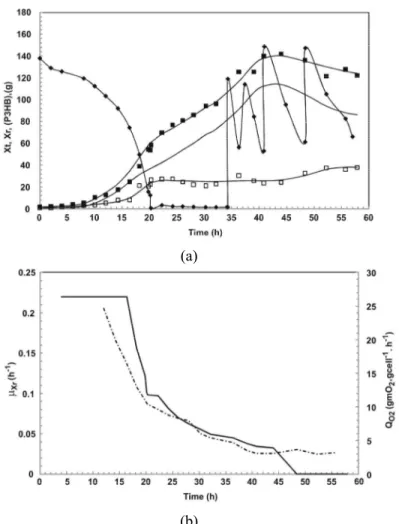
Figure 3: Profile of high cell density culture C: (a) total biomass (Xt) (■), residual biomass (Xr) (-), poly(3-hydroxybutyrate) (P(3HB)) (□), carbon source (S) (♦); (b) specific growth rate (μXr) (-), and specific oxygen uptake rate (QO2) (-.-.-.). The continuous line represents the Lissage fit.
Figure 3(a) shows that P(3HB) production was higher than that for culture strategy B (Figure 2(a)). At the end of culture C, 68 % of P(3HB) was accumulated in the biomass. Figure 3(b) shows that the carbon source pulse (24 h of culture) before nitrogen limitation (26 h of culture) resulted in a smaller decrease of the values of μXr when compared to culture B. It can be observed in Figure 3(a) that there was no benefit in terms of product formation beyond 40 h of culture and the culture could be stopped at this time. According to Figure 3(b), μXr was 0.073 h-1 at the time of the start of P(3HB) production. These results suggest the importance of maintaining the μXr values between 0.08 and 0.05 h-1 at the beginning of the production phase in order to obtain a high polymer content in the cells.
A possible explanation is that the reduction in the specific growth rate can be related to a limitation of nitrogen source. This limitation causes cessation of protein synthesis, leading to high concentrations of NADH, resulting in an inhibition of citrate synthase and isocitrate dehydrogenase and in a slow-down of
limitation occurs (for example N, Mg, O2, P), with simultaneous carbon source excess. Therefore, the oxygen uptake rate decreases (in association of specific growth rate), resulting in an increase of NADH levels, because oxidation decreases. The Entner Doudoroff pathway continues to occur for NADPH production. Hence, NADH and NADPH levels increase, inhibiting citrate synthase and isocitrate dehydrogenase, and P(3HB) production increases. However, the specific P(3HB) production rate decreases in time, probably due to the decrease of NADH and NADPH levels. NADH continues to be oxidized in the electron transport chain due to the oxygen uptake for cell maintenance. Therefore, it can be observed that, for P(3HB) synthesis to occur at high rates, it is necessary to maintain the TCA cycle and NADH levels through Xr synthesis (by feeding of limiting nitrogen concentrations).
Figure 3(b) shows that, at 30 h, the values of QO2 are 5.0 mgO2.gcell-1.h-1 and that, from this moment, P(3HB) production (Figure 3(a)) presents a lower increase. The μXr values are very close to zero after 30 h and, probably, the P(3HB) increase between 30 and 32 h could be associated with NADH levels for cell maintenance (NADH continues to be oxidized in the electron transport chain due to the oxygen uptake for cell maintenance). This fact could also justify a lower increase of P(3HB) production for culture B (Figure 2 (a)). Remember that this accumulation could occur at higher rates if associated with maintaining μXr.
Results shown for cultures A, B and C showed that the linear growth strategy was satisfactory for obtaining high cell density. But, as noted in culture C, there is a need to maintain the μXr values during the polymer production phase. Since the linear growth strategy is used to obtain high cell density, the problems occurring in culture B should be taken into account, where the different phases (exponential, linear and production) were planned separately, without a connection between them.
Thus, the linear phase should not be initiated upon carbon source exhaustion, but rather when the carbon source is close to its half-velocity coefficient for the substrate saturation concentration (Ks). The carbon source pulse employed to raise the concentration in the production phase should not be performed when nitrogen limitation occurs, but when near-limiting concentrations are observed in the culture medium. As a result, the μXr decrease may be less pronounced because the limiting substrate concentrations (carbon in the transition between the exponential and linear phases, and nitrogen for the transition between the linear and production phases) are not close to the half-velocity coefficient for the substrate (Ks) at the moments of transition between one phase and another.
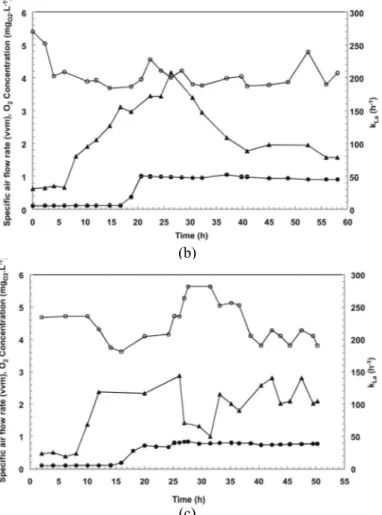
Using the linear growth phase to obtain high cell density resulted in economy and advantages in process control due to the low requirement of oxygen during growth controlled by feeding limiting concentrations of the carbon source. This can be seen in Figures 4(a), (b) and (c), which show the results for the specific air flow rate (vvm –volume of air per volume of medium per minute), dissolved oxygen concentration (CO2(mgO2.L-1)) and volumetric oxygen transfer coefficient (kLa (h-1)) for cultures A, B and C, respectively.
According to Figure 4, kLa varied for every culture (A, B and C). A linear decrease of kLa values was observed when the linear phase began and µXr decreased, according to Equation (6). The same behavior was observed for the specific air flow rate, which was constant from the beginning of the linear phase. The kLa values for cultures B and C were lower than for culture A because these cultures showed a Xr concentration (culture B 20 gXr.L-1 and culture C 23 gXr.L-1) below culture A (30.3 gXr.L-1). These values of kLa and the air flow rate mean an economy in the process since lower agitation speed and aeration flow are required for the linear growth phase. The oxygen concentration for all cultures was between 4 and 6 mgO2.L-1.
(b)
(c)
Figure 4: Specific air flow rate (●), oxygen concentration (○) and volumetric oxygen transfer coefficient (kLa) (▲) versus time for (a) culture A, (b) culture B and (c) culture C for poly(3-hydroxybutyrate) production by C. necator.
CONCLUSIONS
A strategy for P(3HB) production at high cell densities, with the inclusion of a linear growth phase, showed benefits for process control due a decrease of the specific growth rate and, consequently, kLa. This study suggests the importance of specific growth rates (μXr) around 0.08 – 0.05 h-1 at the beginning of the production phase to attain a high P(3HB) production. For maintaining P(3HB) production, the feeding of limiting nitrogen concentrations could promote a slight increase of Xr in this phase, which would maintain the μXr and QO2 values and result in a longer polymer accumulation phase.
NOMENCLATURE
Latin Letters
A high cell density strategy A
B high cell density strategy B C high cell density strategy C C01 dissolved oxygen
concentration at the moment when aeration was
reconnected at time t1
mgO2.L-1
C0 dissolved oxygen
concentration when the transfer of oxygen was interrupted
mgO2.L-1
CO2 dissolved oxygen concentration
mgO2.L-1 CS dissolved oxygen saturation
concentration in the broth
mgO2.L-1 DNS dinitrosalicylic acid
D.O. dissolved oxygen
kLa volumetric oxygen transfer coefficient
h-1 Ks half-velocity coefficient for
the substrate saturation concentration
MM mineral medium mO2 oxygen uptake for cell
maintenance
mgO2.gcell-1.h-1 PHA Polyhydroxyalkanoates
P(3HB) poly(3-hydroxybutyrate) g
P(3HB-co-3HV)
poly(3-hydroxybutyrate- co-3-hydroxyvalerate)
QO2 specific oxygen uptake rate mgO2.gcell-1.h-1 QO2Xr global oxygen uptake rate mgO2.L-1.h-1
S carbon source g
T time h
t1 initial time for the
resumption of aeration and agitation
h
Xr residual biomass g
Xr0 initial residual biomass g
Xr’0 residual biomass at the beginning of the linear growth phase
g
Xt total biomass g
YXr/S residual biomass yield from glucose/fructose
g.g-1 YXr/N residual biomass yield from
nitrogen source
g.g-1 YXr/O2 residual biomass yield from
oxygen
g.g-1
Greek Letters
µXr specific growth rate h-1
REFERENCES
Ahn, W. S., Park, S. J., Lee, S. Y. Production of poly(3-hydroxybutyrate) from whey by cell recycle fed-batch culture of recombinant Escherichia coli. Biotechnology Letters, 23, 235-240 (2001).
Aragão, G. M. F., Lindley, N. D., Uribellarea, J. L., Pareilleux, A., Maintaining a controlled residual capacity increases the production of polyhydroxyalkanoates copolymers by Alcaligenes eutrophus. Biotechnology Letters, 18, 937-942 (1996).
Aragão, G. M. F., Production de polyhydroxyalcanoates par Alcaligenes eutrophus: caractérisation cinétique et contribution à l’optimisation de la mise en oeuvre des cultures. Ph.D.Thesis, L’institut National des Sciences Appliquees de Toulouse, Toulouse (1996).
Aragão, G. M. F., Schmidell, W., Ienczak, J. L. and Fischer, S/A. Preparation of polyhydroxyalkanoates
from a citric residue. PCT - WO2009/149529 A1 (2009).
Bengtssona, S., Piscob, A. R., Johanssona, P., Lemosb, P. C., Reis, M. A. M., Molecular weight and thermal properties of polyhydroxyalkanoates produced from fermented sugar molasses by open mixed cultures.Journal of Biotechnology, 147, n. 3, 172-179 (2010).
Brandl, H., Gross, R. A., Lenz, R. W., Fuller, R.C., Pseudomonas Oleovorans as a source of poly(β-hydroxyalkanoates) for potential applications as biodegradable polyesters. Applied Environmental Microbiology, 54, 1977-1982 (1998).
Braunegg, G., Sonnleitner, B., Lafferty, R. M., A rapid gas chromatographic method for the determination of poly-β-hydroxybutyric acid in microbial biomass. European Journal Applied Microbiology Biotechnology, 6, 29-37 (1978). Dalcanton, F., Ienczak, J. L., Fiorese, M. L., Aragão,
G. M. F., Produção de poli(3-hidroxibutirato) por Cupriavidus necator em meio hidrolisado de amido de arroz com suplementação de óleo de soja em diferentes temperaturas. Química Nova, 3, n. 33, 552-556 (2010).
Dawes, E. A. and Senior, P. J., The role and regulation of energy reserve polymers in microorganisms. Advanced Microbiology Physiology, 10, 135-266 (1973).
Dias, J. M. L., Lemos, P. C., Serafim, L. S., Oliveira, C., Eiroa, M., Albuquerque, M. G. E., Ramos, A. M., Oliveira, R., Reis, M. A. M., Recent advances in polyhydroxyalkanoate production by mixed aerobic cultures: from the substrate to the final product. Macromolecules Bioscience, 6, 885-906 (2006).
Diniz, S. C., Taciro, M. K., Gomez, J. G. C., Pradella, J. G. C., High-cell-density cultivation of Pseudomonas putida IPT 046 and medium-chain-length polyhydroxyalkanote production from sugarcane carbohydrates. Applied Biochemistry Biotechnology, 119, 51-69 (2004).
Grage, K., Peters, V., Palanisamy, R., Rehm, B. H. A., In Microbial Production of Biopolymers and Polymer Precursors. Bernd H. A. Rehm, Eds.Caister Academic Press, Chapter 11, Norfolk, UK (2009).
Keshavarz, T. and Roy, I., Polyhydroxyalkanoates: bioplastics with a green agenda. Current Opinion in Microbiology, 13, 321-326 (2010).
Kulpreecha, S., Boonruangthavorn, A., Meksiriporn, B., Thongchul, N., Inexpensive fed-batch cultivation for high poly(3-hydroxybutyrate) production by a new isolate of Bacillus megaterium. Journal of Bioscience and Bioengineering, 107, n. 3, 240-245 (2009).
Lee, S. Y., Bacterial polyhydroxyalkanoates. Biotechnology and Bioengineering, 49, 1-14 (1996).
Lee, Y., Kim, M. K., Chang, H. N., Park, Y. H., Regulation of poly-P-hydroxybutyrate biosynthesis by nicotinamide nucleotide in Alcaligenes eutrophus. FEMS Microbiology Letters, 131, 35-39
(1995).
Lee, W.-H., Loo, C.-Y., Nomura, C. T., Sudesh, K., Biosynthesis of polyhydroxyalkanoate copolymers from mixtures of plant oils and 3- hydroxyvalerate precursors. Bioresource Technology, 99, 6844-6851 (2008).
Miller, G. L., Use of Dinitrosalicylic Acid Reagent for Determination of Reducing Sugar. Analytical Chemistry, 31, 426-428 (1959).
Reddy, C. S .K., Ghai, R., Kalia, R. V. C., Polyhydroxyalkanoates: an overview. Bioresource Technology, 87, 137-146 (2003).
Rocha, R. C. S., Silva, L. F., Taciro, M. K., Pradella, J. G. C., Production of poly(3-hydroxybutyrate-co-3-hydroxyvalerate) P(3HB-co-3HV) with a broad range of 3HV content at high yields by Burkholderia sacchari IPT 189. World Journal Microbiology Biotechnology, 24, 427-431 (2008). Ryu, H. W., Hahn, S. K., Chang, Y. K., Chang, H.
N., Production of poly(3-hydroxybutyrate) by
high cell density fed-batch culture of Alcaligenes eutrophus with phosphate limitation. Biotechnology and Bioengineering, 55, n. 1, 25-32 (1997).
Schneider, A. L., Produção, caracterização e degradação em solo de plásticos biodegradáveis. PhD. Thesis, Universidade Federal de Santa Catarina, Florianópolis, (2006).
Serafim, L. S., Lemos, P. C., Albuquerque, M. G. E., Reis, M. A. M. Strategies for PHA production by mixed cultures and renewable waste materials. Applied Microbiology Biotechnology. 81, n. 4, 615-628 (2008).
Shang, L., Jiang, M., Chang, H. N., Poly(3-hydroxybutyrate) synthesis in fed-batch culture of Ralstonia eutropha with phosphate limitation under different glucose concentrations. Biotechnology Letters, 25, 1415-1419 (2003). Taguchi, H. and Humphrey, A., Dynamic
measurement of the volumetric oxygen transfer coefficient in fermentation systems. Journal of Fermentation Technology, 44, 881-889 (1996). Wang, F., Lee, S. Y., Poly(3-hydroxybutyrate)
Production with high productivity and high polymer content by a fed-batch culture of Alcaligenes latus under nitrogen limitation. Applied Environmental Microbiology, 63, n. 9, 3703-6 (1997).