ISSN 1517-7076 artículo 11624,pp.561-570, 2015
Autor Responsable: Eliana Pérez Fecha de envío: 20/04/2015 Fecha de aprobación: 22/06/2015
10.1590/S1517-707620150003.0057
Nitrogen dopedTiO
2photoactive
in visible light
Eliana Pérez 1, Luca Vittorio 2, Mónica Farfán Torres1, Edgardo Sham1
1
INIQUI-CONICET, Universidad Nacional de Salta, Avda. Bolivia 5150, Salta, 4400, Argentina e-mail: [email protected]
2
CNEA-Centro Atómico Constituyente, Avda Gral. Paz 1499, San Martin-Buenos Aires, 1650, Argentina e-mail: [email protected]; [email protected]; [email protected]
ABSTRACT
In this research TiO2 modified with nitrogen has been prepared. The synthesis method used was sol gel from the hydrolysis of titanium tetrabutoxide with urea solution, combined with a low temperature treatment at atmospheric pressure. The theoretical mole ratio N/Ti was equal to 0.5 and the theoretical mole ratio HNO3/TiO2 was equal to 0.5. The solid obtained was calcined at different temperatures in static air with high heating rate and residence time of 1 hour. The samples were characterized by X-ray diffraction, FTIR Raman and diffuse reflectance spectroscopy, thermodifferential and thermogravimetric analysis and specific surface area. All calcined solids exhibit absorption in the visible range. The Raman spectroscopy and X-ray diffrac-tion revealed for all the heat treatments, the presence of crystalline phases corresponding to anatase and brookite polymorphism. The photocatalytic activity of the catalysts was tested in degradation of an artificial dye under visible light, yielding the best results for the sample treated at 250°C. Our results allow to say that this behaviour is due to the absorption of visible light, good efficiency for the adsorption of the dye and pres-ence of two crystalline phases that decreases the recombination of photogenerated electrons and holes. The synthesis technique used allows obtaining solids with textural and attractive photocatalytic properties. Keywords: TiO2-N, synthesis. Characterization, photocatalysis
1. INTRODUCTION
Heterogeneous photocatalysis is considered one of the best alternatives to solve problems of energy and envi-ronmental pollution [1,2]. Titanium dioxide (TiO2) has been employed as an efficient photocatalyst because it is relatively inexpensive, chemical and thermal stability, optics and electronics properties, non-toxicity and high photoactivity [2-4]. However, its high value of band gap hinders the use of solar radiation as primary energy source. To perform photocatalysis under visible irradiation, several methods have been applied in order to improve the visible response of TiO2.
In 1986, Sato [5] reported for the first time the synthesis of nitrogen-doped TiO2 (N-TiO2) based on calcination of titanium hydroxide (H2TiO3). The response to visible light was attributed to sensitization by impurities NOx. Asahi at al. [6] obtained N-TiO2 by sputtering of TiO2 under atmosphere of N2-Ar. The solid showed an absorption edge shift to the visible light region. Based on the calculation of the density of states for TiO2 doped with different anions (C, N, S and F) concluded that the presence of substitutional nitrogen was necessary to reduce the band gap and to display photocatalytic activity under visible light.
Since this work, TiO2 doped with nitrogen has been synthesized by different methods, including re-duction in the presence of gaseous NH3 [7, 8], oxidation of TiN [9, 10], treatment of mixtures of urea and TiO2 [11], sputtering of TiO2 in atmosphere of N2 [12] and hydrolysis of precursors containing Ti [13]. All these methods require treatments at high temperatures to obtain crystalline solids, thus reducing the surface of materials by sintering and in some cases removing the doping element. In order to solve this problem, the synthesis of doped TiO2 by hydrothermal or solvothermal treatment of TiO2 and N precursors, allows to pro-duce crystalline solids at low temperature and with important textural properties.
thermodiffer-562 ential analysis and specific surface. The photocatalytic activity under visible light was also investigated.
2. MATERIALS AND METHODS
2.1 Reagents
Titanium tetrabutoxide TBT (Ti[O(CH2)3CH3]4 97%) from Aldrich and urea (NH2CONH2) from Cicarelli laboratories were used as TiO2 and nitrogen precursors respectively. Nitric acid (HNO3), tartrazine (an azo dye) and n-butyl alcohol of analytical reagent grade were used. All solutions and experiments were carried out using bidistilled water.
2.2 Synthesis of N-TiO2
First 370 mg of urea, to obtain a molar ratio N / Ti of 0.5, were dissolved in water (solution A). On the other hand, titanium tetrabutoxide was dissolved in n-butyl alcohol to obtain a 1 mol L-1 solution. 25.04 mL of this solution was transferred to a beaker and 88 L of concentrated HNO3 were added dropwise under vigorous stirring during one hour (solution B).
The solution A was then added to solution B under slow stirring. Then the new solution was placed in-to a water bath at 40ºC and kept under stirring for two hours in-to allow the hydrolysis process and the doping with nitrogen. Finally it was cooled up to room temperature. The obtained powder (NTiO2) was calcined at 200, 250 and 300ºC in static air with high heating rate and a residence time of 1 hour. The catalysts were re-ferred as NTiO2-x where x is the calcining temperature.
2.3 Characterization
XRD patterns of the prepared NTiO2-x samples were recorded on a Philips PW 1710 diffractometer using
Cu-Kαradiation ( =1.5406Å) over the 2θ ranges of 20-80 degree. FTIR and Raman spectra were collected
on a Perkin Elmer GX FT-IR equipped with a laser as excitation source. Diffuse reflectance spectra were measured on a UV-vis spectrophotometer equipped with an integrating sphere with BaSO4 as the reference sample. The analysis range was 200 to 800 nm. Kubelka Munk function was used to transform data from diffuse reflectance into absorption coefficients and for obtaining the Band Gap value. Thermodifferential and thermogravimetric analysis were performed in static air on a Rigaku TAS 100 equipment. Specific surface area was measured on a Micromeritics FlowSorb II, for these samples were outgassed at 100ºC for 30 min.
2.4 Photodegradation experiment
The photocatalytic activities of the catalysts were evaluated by measuring the decomposition of 1 x 10⁻⁵ mol L-1 solution of tartrazine. Experiments were carried out at room temperature in a batch reactor thermostatical-ly controlled. A 250 W halogen lamp was used as the light source in the home made photo-reactor (Fig. 1), a sodium nitrite solution was used to cut off the light having wavelength below 400 nm.
563 In a typical run, 0.02 g of the catalyst was weighted and added into a 100 mL of the above mentioned tartrazine solution. Prior to illumination, the suspension was magnetically stirred for 30 min to establish the adsorption/desorption equilibrium between the photocatalyst and tartrazine. At specific time intervals, about 5 mL aliquots were sampled. The filtrates were analyzed by recording variations in the absorption in UV–vis spectra of tartrazine, using a UV–vis spectrophotometer.
3. RESULTS AND DISCUSSION
3.1 DTA-TG
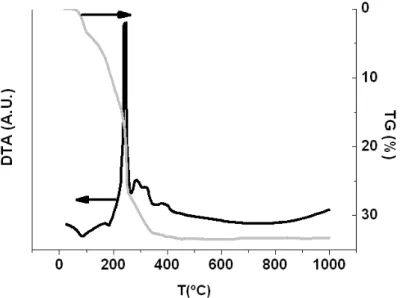
The results of thermogravimetric and thermodifferential analysis TG- DTA of NTiO2 are shown in Fig. 2. The TG curves can be separated in several areas. The first area, from room temperature to 180ºC where the mass loss is 8%, corresponds to endothermic process showed in DTA curve. It is due to the remov-al of n-butyl remov-alcohol and water, physicremov-ally adsorbed and decomposition of nitrate groups [14]. The second area, from 180ºC to 236ºC, corresponds to a mass loss of around 8% and it is attributed to the decomposition of urea (Tb 235ºC) in according to spectrum IR. This process is associated to the endothermic peak at 200ºC.
The third area, from 236ºC to 260ºC, corresponds to a mass loss of 11%, attributed to the combustion and the decomposition of the non-hydrolyzed groups of TBT [15]. This process corresponds to the exother-mic peaks at 245ºC. Between 260ºC and 345ºC, slow oxidation processes take place associated with a broad exothermic heat effect, which stops at 345ºC. The peak at 388ºC is attributed to the crystallization of amor-phous TiO2 into anatase with a mass loss (1%) due to the removal of the hydroxyl groups trapped inside the particles [16].
Figure 2: DTA and TG of NTiO2.
3.2 XRD
Fig. 3 shows the XRD patterns of the prepared samples before and after being heat treated. The patterns indi-cate that all samples exhibit the presence of anatase (A) and brookite (B) phases. The existence of brookite is discernable from its diffraction line (121) located at 30.8º (2θ) in XRD patterns, which is not overlapped with any peak of anatase or rutile phases. The phase content was estimated from equation (1) and (2).
I B K B I A K A
I A K A W A
(1)
I B K B I A K A
I B K B W B
564 Where IA is the area of diffraction of the peak of anatase (101) and IB is the area of diffraction of the peak of brookite (121). KA and KB are constants equal to 0.886 and 2.721, respectively [17].
Figure 3: XRD of a) NTiO2, b) NTiO2 200, c) NTiO2 250 and d) NTiO2 300.
The crystallite size was estimated by applying the Scherrer’s equation to the full width at half
-maximum of the peaks (101) and (121) of anatase and brookite:
cos
K
D (3)
Where D is the crystallite size, K is an adimensional constant, 2θ is the diffraction angle, λ is the
X-ray wavelength corresponding to the Cu Kα irradiation and β is the half-height width of the diffraction peaks. In Table 1, the values of crystal size and the percentage of the two crystalline phases are presented.
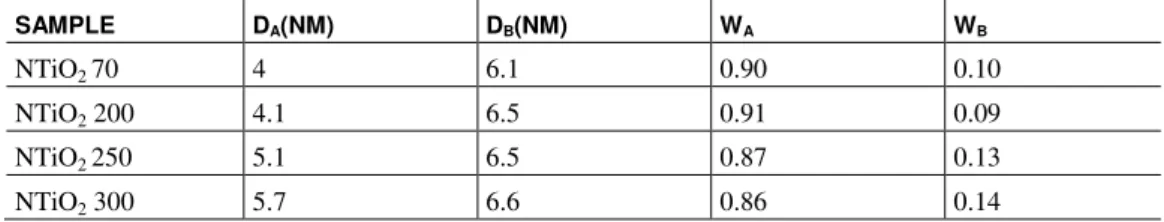
Table 1: Crystal size and content of anatase and brookite phases.
SAMPLE DA(NM) DB(NM) WA WB
NTiO2 70 4 6.1 0.90 0.10
NTiO2 200 4.1 6.5 0.91 0.09
NTiO2 250 5.1 6.5 0.87 0.13
NTiO2 300 5.7 6.6 0.86 0.14
All samples contain a small fraction of brookite, not exceeding 14%. The size of the crystallites in-creases 42% and 7% for anatase and brookite after heat treatment at 300 °C. The crystal sizes are in the range of 4 to 5.7 nm for anatase, and from 6.1 to 6.6 nm for brookite, in agreement with results reported by Al-phonse [16]`.
565 Table 2: Cell parameters and volume for the anatase phase of each of the samples.
SAMPLE a(Å) b(Å) c(Å) VOL(Å3)
NTiO2 70 3.7941 3.7941 9.4797 136.4598
NTiO2 200 3.7887 3.7887 9.4539 135.7050
NTiO2 250 3.7854 3.7854 9.4688 135.6820
NTiO2 300 3.7848 3.7848 9.4724 135.6877
The parameters a, b and c for all prepared catalysts show small differences as compared to TiO2 ana-tase phase reference values (JCPDS No. 21-1272, a=b=0.37852 nm and c=0.95139 nm). These differences are due to lattice distortion as a result of nitrogen doping.
It is observed that a parameter decrease when the temperature thermal treatment increased. This is due to the fact that during heat treatment the nitrogen is removed, decreasing its concentration in the solid frame-work [18] and therefore the value of a for doped TiO2 tends to the value of undoped TiO2. While, c shows an opposite behaviour, but also tends to the reference value [19].
3.3 Raman
Raman spectra of NTiO2 and NTiO2 250 are showed in Fig. 4. NTiO2 presents Raman peaks at 649, 519 and 408 cm−1, whereas that of NTiO2 250 shows peaks at 644, 519 and 401 cm-1. These are very similar to the Raman active fundamental modes of anatase phase (639, 519, and 394 cm−1), the first is assigned to vibra-tional mode Eg and the last two to the vibrational modes B1g.
The vibrational modes of the synthesized (uncalcined and calcined) samples present significant shift to blue region. According to literature, the blue shift of the Raman peaks could be attributed to quantum size effect because of the small size of the particles [20], which implies that the solid with smaller size presents the highest shift. The blue shift could also be attributed to oxygen vacancies [21].
The bands at 245, 326, 366, 449 and 589 cm-1 are attributed to brookite phase [22].
The band intensity of the two crystalline phases increases with heat treatment, in agreement with the results observed in XRDs.
Figure 4: Raman spectra of NTiO2 (black) and NTiO2 250 (gray).
3.4 Diffuse Reflectance
566 Figure 5: Absorbance spectra of a) NTiO2, b) NTiO2 200, c) NTiO2 250 and d) NTiO2 300.
The absorption edge for NTiO2 and NTiO2 200 is shifting more towards the visible as compared to NTiO2 calcined at 250 and 300ºC, as is observed in the magnification of Fig 3. N doping could lead to lattice deformation and to form vacancies, this is probably the result of an impurity state in TiO2 band gap. The ex-isting impurity state improves the absorption of visible light by narrowing the band gap of TiO2. However, for NTiO2 250 and NTiO2 300, the absorption edge is lower because during the heat treatment the carbon and nitrogen were removed.
Unlike of the others samples, NTiO2 250 absorbs throughout all the visible light range, which may be attributed to the electron transition from energy levels of N surface species to the conduction band of TiO2 [23, 24]. Also this effect is probably due to the presence of carbon from residual groups O-R of the alkoxide due to incomplete hydrolysis reaction of titanium butoxide.
The band gap energy of the solids were obtained by extrapolating the linear zone of the graph
[F(R´∞)]1/2
to the axis of the abscissa (photon energy h ), where F(R´∞) is the remission function of Kubelka Munk [25]. The band gap value and the corresponding wavelength are presented in Table 3.
Table 3: Band Gap values of samples and corresponding wavelengths.
SAMPLE Eg (eV) λ (nm)
NTiO2 70 3.10 400
NTiO2 200 3.12 398
NTiO2 250 3.20 388
NTiO2 300 3.17 391
3.5 FTIR
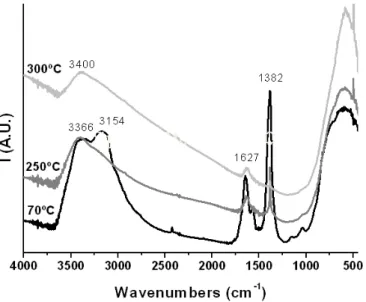
567 Figure 6: FTIR spectra of NTiO2 uncalcined and calcined.
In all the spectra, the intense broad band observed in the region around 3000–3500 cm−1 is due to O-H stretching vibration of surface hydroxyl groups and adsorbed water molecules. The corresponding bending vibration appears close to 1625 cm−1 [26-28].
For fresh NTiO2 the bands at 3350 cm-1 and 3179 cm-1 can be attributed to N-H stretching modes and the bands at 1647 cm-1 and 1569 cm-1 are due to stretching C=0 and bending N-H modes of urea. The intense broad band observed at 1382 cm-1 corresponds to stretching modes of NO3-. The peaks around 1155 cm-1 and 1037 cm-1 are indicatives of the presence of residual species of urea and non-hydrolyzed groups of TBT [29].
It was observed that the intensity of 1384 cm−1 peak decreased when the calcination temperature in-creased of 250 to 300ºC and the complete disappearance of this peak takes place at 400ºC (not showed here). The peaks attributed to species of nitrogen and titanium precursors disappear at 250ºC in according with the results of DTA.
At temperatures above 300ºC, the intensity of 3400 cm-1 and 1625 cm-1 bands decreased due to re-moval of the remaining hydroxyl groups which are probably trapped inside the crystallites [14].
3.6 Specific Surface Area
The values of specific surface area of the synthesized solids and after heat treatment are showed in Table 4.
Table 4: Specific surface area values of the samples.
SAMPLE S(m2/g)
NTiO2 70 33
NTiO2 200 149
NTiO2 250 165
NTiO2 300 146
The surface area of the solid after the hydrothermal treatment at 40ºC is the lower, due to the presence of O-R residual groups at the surface. During the calcination process, residual groups from nitrogen and tita-nium precursors are removed, thus increasing the surface area.
The surface reaches a maximum at 250ºC, temperature at which it is produced the combustion of the organic residual groups, according to the DTA results. With the subsequent increase of temperature until 300ºC the surface decreased to 146 m2/g produced by sintering.
3.7 Photocatalytic Activity
tartra-568 zine in the visible light region significantly decreases.
In Fig.7 the degradation curves of tartrazine for NTiO2 250, NTiO2 300 and undoped TiO2 calcined at 250ºC are shown. These are expressed as degradation percentages of dye as time function and were calculat-ed with the equation 4.
100
%
0
0
x
C
C
C
Deg
(4)Where C0 is the initial concentration of the solution and C is the solution concentration at a specific time.
Figure 7: Tartrazine degradation curves for NTiO2 250, NTiO2 300, TiO2 250 and without photocatalyst.
It was observed that the tartrazine concentration hardly changes when the solution is irradiated with visible light for 180 min in the absence of any catalyst, indicating that the photolysis of tartrazine is negligi-ble. The degradation rate of tartrazine on different TiO2 catalyst samples follows the order: NTiO2 250 > TiO2 250 > NTiO2 300.
NTiO2 200, not showed here, does not present photocatalytic activity despite that is the solid with smallest bang gap. This can be due to the presence of carbon residues from incomplete hydrolysis of the tita-nium precursor that decreases the efficiency, because it increased the recombination rate of charge carriers.
The activity of NTiO2 250 was about 4 times of that of the undoped TiO2 calcined at the same temper-ature (TiO2 250) while NTiO2 300 degraded only 4% of dye. It is attributed to absorption in the visible range because the undoped sample absorbs more visible light than NTiO2 300 due to the presence of carbon.
Regarding to dye adsorption, NTiO2 250 adsorbs 57% of the initial concentration, while NTiO2 300 adsorbs only 8%. Even if these results are in agreement with the observed decrease of the surface area, the great difference may be due to the presence of surface groups that interact differently with the dye.
The largest photoactivity showed by the NTiO2 250 solid in the tartrazine degradation can be attribut-ed to the capacity of energy absorption in the visible region, high specific surface area and presence of two crystalline phases [30-32].
4. CONCLUSION
The technique of synthesis used in this work allows to successfully incorporating nitrogen in the titania lat-tice, developing solids with a crystalline structure well defined and composed by anatase and brookite phases.
The results of photocatalysis allow confirming that the incorporation of nitrogen in the TiO2 effective-ly produces a narrowing of the band gap in the cataeffective-lysts allowing obtaining a good photoactivity under visi-ble light radiation.
569 for solids calcined at 250 ºC. Higher heat temperatures results in a deactivation due to nitrogen lost from the titania lattice.
5. ACKNOWLEDGEMENTS
We wish to thank to the CIUNSa for the financial support by means of the 2088 project and to CONICET for the Doctoral fellowship of E. Pérez.
6. BIBLIOGRAPHY
[1]FUJISHIMA, A. and HONDA, K., “Electrochemical Photolysis of Water at a Semiconductor Electrode”,
Nature, v. 238, n. 5358, pp. 37-38, Jul.1972.
[2]PRIMO, A. and GARCÍA H., “Solar Photocatalysis for Environment Remediation”, Inμ Suib, S.L., New
and Future Developments in Catalysis, chapter 6, Amsterdam, Elsevier, 2013.
[3]FUJISHIMA, A. and ZHANG, X., “Titanium dioxide photocatalysisμ present situation and future a
p-proaches”, Comptes Rendus Chimie, v. 6, n. 5-6, pp. 750-760, Oct. 2006.
[4]FUJISHIMA, A., RAO T.N., and TRYK, D.A., “Titanium dioxide photocatalysis”, Journal of
Photochem-istry and Photobiology C: PhotochemPhotochem-istry Reviews, v. 1, n. 1, pp. 1-21, Jun. 2000.
[5]SATO, S., “Photocatalytic activity of NOx-doped TiO2in the visible light region”, Chemical Physics
Let-ters, v. 123, n. 1-2, pp. 126-128, Jan. 1986.
[6]ASAHI, R., et al., “Visible-Light Photocatalysis in Nitrogen-Doped Titanium Oxides”, Science, v. 293, n. 5528, pp. 269-271, Jul. 2001.
[7]KOSOWSKA, B., et al., “The preparation of TiO2–nitrogen doped by calcination of TiO2•xH2O under
ammonia atmosphere for visible light photocatalysis”, Solar Energy Materials and Solar Cells, v. 88, n. 3, pp. 269-280, Aug. 2005.
[8]IRIE, H., WATANABE, Y., and HASHIMOTO, K., “Nitrogen-Concentration Dependence on
Photocata-lytic Activity of TiO2-xNxPowders”, The Journal of Physical Chemistry B, v. 107, n. 23, pp. 5483-5486, Jun. 2003.
[λ]WAN, L., et al., “Improved optical response and photocatalysis for N-doped titanium oxide (TiO2) films
prepared by oxidation of TiN”, Applied Surface Science, v. 253, n. 10, pp. 4764-4767, Mar. 2007.
[10]WU, Z., et al.,“Visible light induced electron transfer process over nitrogen doped TiO2 nanocrystals
prepared by oxidation of titanium nitride”, Journal of Hazardous Materials, v. 157, n. 1, pp. 57-63, Aug.
2008.
[11]DONG, F., et al., “Band structure and visible light photocatalytic activity of multi-type nitrogen doped
TiO2 nanoparticles prepared by thermal decomposition”, Journal of Hazardous Materials, v. 162, n. 2-3, pp. 763-770, Mar. 2009.
[12]MI, L., XU, P., and WANG, P.N., “Experimental study on the bandgap narrowings of TiO2 films
cal-cined under N2 or NH3atmosphere”, Applied Surface Science, v. 255, n. 5 (Part 2), pp. 2574-2580, Dec. 2008. [13]ANANPATTARACHAI, J., KAJITVICHYANUKUL, P., SERAPHIN, S., “Visible light absorption abi l-ity and photocatalytic oxidation activl-ity of various interstitial N-doped TiO2 prepared from different nitrogen
dopants”, Journal of Hazardous Materials, v. 168, n. 1, pp. 253-261, Aug. 2009.
[14]BLETA, R., ALPHONSE, P., LORENZATO, L., “Nanoparticle Route for the Preparation in Aqueous
Medium of Mesoporous TiO2with Controlled Porosity and Crystalline Framework”, The Journal of Physical
Chemistry C, v. 114, n. 5, pp. 2039-2048, Feb. 2010.
[15]MADARÁSZ, J., et al., “Comprehensive evolved gas analysis (EGA) of amorphous precursors for
S-doped titania by in situ TG–FTIR and TG/DTA–MS in air: Part 2. Precursor from thiourea and
titanium(IV)-n-butoxide”, Journal of Analytical and Applied Pyrolysis, v. 85, n. 1-2, pp. 549-556, May. 2009.
[16]ALPHONSE, P., VARGHESE, A., TENDERO, C., “Stable hydrosols for TiO2coatings”, Journal of
Sol-Gel Science and Technology, v. 56, n. 3, pp. 250-263, Dec. 2010.
[17]ZHANG, H., BANFIELD, J.F., “Understanding Polymorphic Phase Transformation Behavior during Growth of Nanocrystalline Aggregates: Insights from TiO2”, The Journal of Physical Chemistry B, v. 104, n. 15, pp. 3481-3487, Apr. 2000.
570 [19]POPA, M., et al.,“Synthesis, structural characterization, and photocatalytic properties of iron-doped TiO2
aerogels”, Journal of Materials Science, v. 44, n. 2, pp. 358-364, Jan. 2009.
[20]LIU, B., et al., “Low temperature fabrication of V-doped TiO2 nanoparticles, structure and photocatalytic
studies”, Journal of Hazardous Materials, v. 169, n. 1-3, pp. 1112-1118, Sep. 2009.
[21]PARKER, J.C., SIEGEL, R.W., “Calibration of the Raman spectrum to the oxygen stoichiometry of nanophase TiO2”, Applied Physics Letters, v. 57, n. 9, pp. 943-945, Jun. 1990.
[22]TOMPSETT, G.A., et al., “The Raman spectrum of brookite, TiO2(Pbca, Z = 8)”, Journal of Raman
Spectroscopy, v. 26, n. 1, pp. 57-62, 1995.
[23] SAKTHIVEL, S. et al., “Visible light activity and photoelectrochemical properties of nitrogen-doped TiO2”, Journal of Physical Chemistry B, v. 108, n. 50, pp. 19384-19387, 2004.
[24] SAKTHIVEL, S., KISCH, H., “Photocatalytic and photoelectrochemical properties of nitrogen-doped titanium dioxide”, ChemPhysChem, v. 4, n. 5, pp. 487-490, 2003.
[25]VALENCIA, S.M., MARIN, J.M., RESTREPO, G., “Study of the Bandgap of Synthesized Titanium
Dioxide Nanoparticules Using the Sol-Gel Method and a Hydrothermal Treatment”,Open Materials Science Journal, v. 4, pp. 9-14, Jan. 2010.
[26] DIKER, H., et al., “Aykutlu, Characterizations and photocatalytic activity comparisons of N-doped nc-TiO2 depending on synthetic conditions and structural differences of amine sources”, Energy, v. 36, n. 2, pp. 1243-1254, 2011.
[27] MORROW, B. A., Surface Groups on Oxides, In: J. Fierro, L. G., Studies in Surface Science and Catal-ysis, chapter 3, Elsevier, 1990.
[28] YOONG, L. S., et al., “Development of copper-doped TiO2 photocatalyst for hydrogen production under
visible light”, Energy, v. 34, n. 10, pp. 1652-1661, 2009.
[29] VELASCO, M. J., et al., “DSC and FT-IR analysis of the drying process of titanium alkoxide derived precipitates”, Thermochimica Acta, v. 326, pp. 91-97, 1990.
[30] JIAO, Y., et al., “Anatase grain loaded brookite nanoflower hybrid with superior photocatalytic activity
for organic degradation. Colloids and Surfaces Aμ Physicochemical and Engineering Aspects”, v. 402, n. 0,
pp. 66-71, May. 2012.
[31]GAI, L., et al., “Controlled synthesis of nitrogen-doped binary and ternary TiO2 nanostructures with
en-hanced visible-light catalytic activity”, Journal of Solid State Chemistry, v. 199, n. 0, pp. 271-279, Mar. 2013.
[32]SERPONE, N., et al., “Exploiting the interparticle electron transfer process in the photocatalysed
oxida-tion of phenol, 2-chlorophenol and pentachlorophenol: chemical evidence for electron and hole transfer
be-tween coupled semiconductors”, Journal of Photochemistry and Photobiology A: Chemistry, v. 85, n. 3, pp.