Phase-Field Simulation of Microsegregation and Dendritic Growth During Solidiication of
Hypoeutectic Al-Cu alloys
Alexandre Furtado Ferreiraa*, Késsia Gomes Paradelaa, Paulo Felipe Juniora, Zilmar Alcântara
Júniora, Amauri Garciab
Received: March 03, 2016; Revised: December 14, 2016; Accepted: January 03, 2017.
Prediction of microstructure evolution and microsegregation is one of the most important problems in materials science. The dendritic growth and microsegregation provide a challenging simulation goal
for computational models of solidiication, in addition to being an important technological feature of many casting processes. The phase-ield model ofers the prospect of being able to perform realistic
simulation experiments on dendrite growth in metallic systems. In this paper, the microsegregation and dendritic growth of hypoeutectic Al-Cu alloys under constant cooling rate was simulated using
a phase-ield model. The main new feature of the present model is based on the fact that the efect of the growth rate is incorporated via an efective partition coeicient that has been experimentally determined for a range of growth rates. It is shown that both models (Phase-ield model and Scheil) have signiicant deviations from the experimental data when the equilibrium partition coeicient is considered in the calculations. Since the predicted results using the models yielded discrepancies from the experimental data, an experimental equation is adopted for calculating the efective partition coeicient from experimental data. The experimental equation is then adopted in the calculations of phase-ield model and Scheil’s equation, showing a good agreement with the experimental data.
Keywords: Alloys; Solidiication; Microstructure; Computer modelling and simulation
* e-mail: [email protected]
1. Introduction
Solidiication processing is one of the important routes to
produce metallic materials, especially alloys. The conditions
for the solidiication process, such as the temperature gradient
and the growth rate, vary from process to process and in one process also as a function of time and space. These
variations together with the diferent alloy compositions,
lead to a multitude of microstructures and therefore material
properties. Since the properties of an alloy can depend
strongly on the concentration of solutes that it contains,
being able to quantitatively predict the concentrations in
the solid is desirable. One important phenomenon, which has to be well controlled, is the so-called segregation. The
solidiication leads to types of segregation; micro and macro
segregation. Microsegregation; which occurs over short distances comparable to the dendrite arm spacing. The macrosegregation, in turn, occurs over similar distances to the size of the casting.
Over the last 10 years the phase-ield model has been used for simulations of the solidiication process. The phase-ield model is known to be a computational tool for
describing the pattern evolution of the interface between
mother and new phases in non-equilibrium state because all the governing equations are written in a uniied manner in the whole space of the system. The order parameter takes on constant values in the solid region and liquid and changes
steeply but smoothly over a thin transition layer that plays the
role of the classical sharp interface. The governing equations coupled with modiied transport equation are applied in the
whole computational domain without distinguishing between the phases. This permits simulations of dendritic evolutions
without explicitly tracking the interface.
The solidiication process of alloys has been studied by Salvino et al.1,2 It is shown, in said work, the phase-ield
model applied to the multicomponent alloy solidiication (Fe–C–P–Mn) for equiaxed dendritic growth. The papers provide an introduction to the phase-ield model and an
overview of its possibilities. Amongst the possible applications,
in these papers, the phase-ield model is applied to estimate the solidiied fraction during sundry examples of solidiication
processes. Microsegregation behavior in multicomponent alloys is analyzed and compared with analytical models. The
solid concentration proiles in solid/liquid interface calculated by the phase-ield model show good agreement with those a Graduate Program on Metallurgical Engineering, Federal Fluminense University, 27255-125, Volta
Redonda, RJ, Brazil
b Department of Manufacturing and Materials Engineering, University of Campinas - UNICAMP,
from the Clyne–Kurz equation. Such good agreement is due to back-difusion of solute into the solid phase from the solid/liquid interface, which is taken into account in the Clyne–Kurz equation. Liu et al.3 used the phase-ield
model to the simulation of equiaxed dendritic growth under convection. The inluence of low on the dendrite
morphology and the concentration was investigated during
the alloy solidiication; the microsegregation was studied by changing the forced low velocity. The results showed
that upstream dendritic arm is promoted with convection, while the downstream is inhibited, and the perpendicular
arms grow towards to upstream direction. Li et al.4 studied
the microsegregation during solidiication of a binary alloy by phase-ield simulations. The microsegregation within
the columnar dendritic array is analyzed by performing a
two-dimensional phase-ield simulation. The inluence of
microstructure morphology on microsegregation was studied
for various back difusion conditions. Under the condition of no back difusion, it is found that at the region without
second dendrite arms the simulation result agrees well with
Scheil´s equation, but for the region with well developed
secondary dendrite arms there is a severe deviation. This
deviation, according to Li et al.4, is attributed to the dendritic
coarsening and the inhomogeneity of interdendritic liquid concentration caused by various interface curvatures. Under the condition of moderate back difusion, it is found that the efect of dendritic morphology on microsegregation
can be accounted by enhancing the Fourier number,
which characterizes the solid-state difusion. A modelling approach is presented by Warnken et al.5, for the prediction
of microstructure evolution during directional solidiication of nickel-based superalloys, using a phase-ield model. The phase-ield model was coupled to CALPHAD thermodynamic and kinetic databases, for solidiication simulation in
multicomponent system. The dendritic growth and the formation of interdendritic phases in an isothermal region
are simulated for a range of solidiication parameters. It is
demonstrated that the predicted patterns of microsegregation obtained from the simulations compare well to the experimental results. Recently, Wei et al.6 performed a computational
study of the equiaxed microstructure and microsegregation in an industrial A2214 alloy during solidiication by means of two-dimensional domain with phase-ield model. The microstructure simulated by phase-ield model reproduces the experimental data very well. This indicates that a quantitative phase-ield simulation can be achieved with good results.
Moreover, the mechanisms of characteristic patterns and microstructure formation were revealed with the aid of the
phase-ield simulation. The efect of cooling rate on the
secondary dendrite arm spacing and microsegregation was investigated through comparison with the experimental
results. The previous works1-6 indicate that the phase-ield
model is a versatile and powerful technique for calculating the
evolution of microstructure, which is very popular nowadays.
The model was originally proposed to simulate solidiication
of pure materials7-9 and has been extended to solidiication of alloys10-14,16-18. In contrast to the previous phase-ield models, in the present paper the numerical results are achieved in
the simulations by disregarding the equilibrium partition coeicient (Ke) and, instead, imposing an efective partition coeicient (Kef). This diference constitutes the main new feature of the present model. The directional solidiication
of a hypoeutectic Al-Cu alloy under unsteady-state thermal
conditions is simulated by the proposed phase-ield model. The aluminium alloys (Al-CU) have been chosen taking
into account their high strength, which is achieved by the heat treatment process, furthermore, the cast aluminium
alloys yield cost-efective products due to the low melting point. In this present paper, the phase-ield model is applied in solidiication of two binary alloys Al-2.64×10⁻²mol%Cu
(6.0wt.%Cu) and Al-4.5×10⁻²mol%Cu (8.9wt.%Cu). The
microsegregation level can be afected by the formation of eutectic phase during the solidiication process in Al-Cu alloys. The formation of eutectic phase in the solidiication, in turn, is strongly afected by copper concentration in
aluminium alloys. Results obtained by Kurum et al.22 point out that eutectic phase will form according to the increasing of copper concentration, experimental data of aluminium
alloy with high copper concentration (4.5×10⁻²mol%Cu)
showed the eutectic phase formed in the inal stage of solidiication process. The motivation of choosing copper composition (2.64×10⁻² and 4.5×10⁻²mol%Cu), it is due in
this compositions and range of solid fraction (0 to 80%), the solidiication occurs without intermetallic phase and eutectic formation. The solidiication experiments carried
out by Meza et al.15 are briely discussed to follow: In said experiments, hypoeutectic Al–Cu alloys were directionally
solidiied under unsteady-state heat low conditions in a water-cooled solidiication setup. The experimental cooling curves allowed solidiication thermal parameters: cooling rate and
growth rate to be experimentally determined and correlated
with the scale of the dendritic (Al–Cu alloys) patterns. Experimental microsegregation proiles from the central part
of the dendrite cores to the limit of the interdendritic regions were determined by Meza et al.15 in the diferent growth rates. For simplicity, in this present paper, it is assumed that said alloys are diluted; therefore the copper is completely
soluble in the aluminium. The efect of the growth rate was incorporated into an efective partition coeicient that has
been determined for the range of growth rates experimentally
examined. The microsegregation proiles predicted by both the phase-ield model and Scheil’s equation, using the new partition coeicient, are compared with experimental data.
2. Governing Equations
there are three distinct regions to consider: solid, liquid and
interface. The interface in this mathematical description
is a two-dimensional surface with width deined. In the phase-ield model, the state of the computational domain is represented continuously by order parameter (φ). For example, φ = +1, φ = 0 and 0<φ<+1 represent the solid, liquid and interface respectively. The latter is therefore located by the region over which φ changes from liquid-value to
its solid-value. The range over which the order parameter changes is the width of the interface. The set of values of the order parameter over the whole computational domain is the
phase ield. The evolution of the solid region with time is
assumed to be proportional to the variation of the free energy
functional with respect to the order parameter. So, in this present paper, the phase-ield model is briely summarized,
readers can refer to literatures19-20 for more details of the formulation. For simulation of microstructures in binary
alloys during solidiication, we used two equations: one for solute concentrations, the other for the phase ield itself.
Following Ferreira et al.11, the irst equation takes the form
where “
n
” stands for the principal argument of thenatural logarithm of the fraction function within the square brackets and the respective ordinary concentrations in the liquid and solid region are denoted, by pair, CL and CS. As
for the phase-ield equation, those authors propose
where h.(φ). =.φ.2.(3−2φ), g.(φ). =.φ.2.(1−φ).2, and the subscripts S and L stand for solid and liquid, respectively. M
and ε are phase-ield parameters; D(φ) is the solute difusion
coeicient. These phase-ield parameters are related to the
interface energy, σ, whereas the interface width, 2λ, is the distance over which φ changes from 0.1 to 0.9. Notice, furthermore, that M is also related to the kinetic coeicient, β,
deined to be the inverse of the usual linear kinetic coeicient, µk. From Salvino et al.1, these are obtained as
where me is the slope of the liquidus line at equilibrium,
Kef is the efective partition coeicient, and Di is the difusion coeicient in the interface region. For the binary-alloy system,
we use the same parameters shown in the literature, Ferreira et al.16 In addition, T is the temperature, W represents the interface energy, and Vm is the molar volume. ‒‒Equations
(1) and (2) were solved numerically. They were discretized on uniform grids using an explicit inite scheme.
Anisotropy is introduced in the phase-ield model as
follows:
where δε gauges the anisotropy. The value j controls the number of preferential growth directions. For example, with j=0, we shall be looking at a perfectly isotropic case,
while j=4 is indicative of a dendrite with four preferential
growth directions. Orientation of the maximum-anisotropy
interface is identiied by the θ0 constant of Eq. (7), θ being
the angle between the direction of the phase-ield gradient
and the reference axis of the system.
3. Results and discussion
The parameters used in the phase-ield model, obtained
from physical properties of the material, were derived
from Equation (3) to (6).The boundary condition adopted for the phase-ield model (φ) in this work is a zero-lux condition. The governing equations, (1) and (2) above, are solved numerically, using a inite-diference scheme.
In the calculations, the system temperature is uniform and continuously decreased with a constant cooling rate from the initial temperature (T0), which is slightly lower than the liquidus temperature of the Al–Cu alloy. The physical
properties of binary alloy that were used to simulation are presented in Table 1.
Simulations are carried out disregarding the energy equation and instead imposing the following linear temperature proile:
where T0 is the initial temperature, Ṫ represents a constant
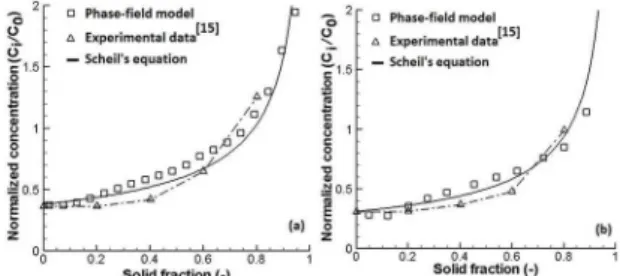
value for the cooling rate and t is the solidiication time. Figure 1 exhibit the measured microsegregation proiles and predicted for a binary alloy Al-Cu. In that igure, one
can see that the copper concentration increases with the solid fraction. The experiments were performed with Al-Cu
alloys under unsteady state of solidiication, thus the Scheil’s equation was chosen to describe solute concentration in the
solid region. We compare the experimental results15 with the
predictions of a one-dimensional phase-ield calculation and by the Scheil’s equation. In the both cases, we used in the ’( )
’( ) (( )()( )) ( )
M t Wg
V RT h n c c c c 1 1 1 1 1 1
m Le S
S e
L
242
2 2
, z
f z z
z = - + - --
-#
&
( )[(
( ))(
)
( )(
) ]
( )
t
c
D
h
c c
h
c c
n
c
c
1
1
1
1
2
L L S S L L
4
4
2
2
,
z
z
z
=
-
-
+
-
T
-
Y
G
J
( )
W
3 2
3
0
v
=
f
.
( )
W
2
m
=
2 2 2
f
04
( , )
( )
RT
V
M
D
W
c c
K
m
2
1
5
m i S e L e ef e 2 0
b
=
S
X
T
f
v
-
f
p
Y
-( , ) ( )
( ( ))( ) ( )( )
( ( )) ( )
( ) ( ) c c RTV c c
h c c h c c
h h d
1 1 1
1 1 6 S e L e m L e S e L e L e S e S e 2 0 1 # p z z z z z z z = -- - +
-#
( ) 0 1 cos( .(j 0)) ( )7
f i =f F +df i-i I
. ( )
calculations, the equilibrium partition coeicient (Ke).The simulation results of the phase-ield model show reasonable agreement with those from the Scheil’s equation. However, the phase-ield model is able to calculate the back-difusion. Instead, Scheil’s analytical model neglected difusion in the
solid phase altogether, but assumed complete mixing of the
solute in the liquid phase. One can see that both the predicted and experimental results for the microsegregation proiles difer considerably, this occurs because the equilibrium partition coeicient (Ke) is assumed to calculate the solute concentration during solidiication process. Interestingly, one of the rapid solidiication efects is signiicant deviations from the equilibrium phase diagram. In this paper, the rapid solidiication efects of the solidiication process were incorporated through the growth rate into an efective partition coeicient (Kef), as proposed by Meza et al.15
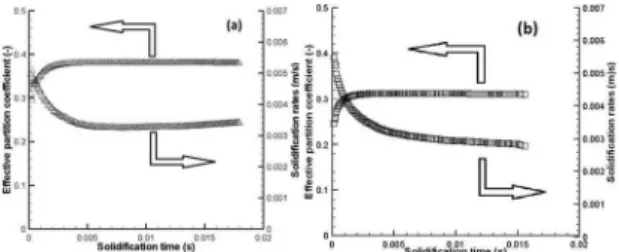
phase-ield model by equation 5. Figures 3a-b correlates the solidiication rate (VL) and the efective partition coeicient
(Kef) with time during the solidiication process for the Al-2.64×10⁻²mol%Cu and Al-4.5×10⁻²mol%Cu alloys. As
depicted in Figures 3a-b, both the partition coeicient and the solidiication rate vary signiicantly with time immediately after the onset of solidiication, followed by essentially
constant values.
Table 1: Physical properties of the binary alloy (Al-Cu).
Melting temperature of the pure aluminium,16 T
m [K] 933.0
Difusivity in liquid phase,15 D
L [m2s−1] 3.6×10⁻⁹
Difusivity in solid phase,16-18 D
S [m2s−1] 3.0×10⁻¹³
Equilibrium partition coeicient,15 K
e 0.1004
Slope of liquids line,16 m e [Kmol
−1] 640
Molar volume,16 V m [m
3mol−1] 1.095×10⁻⁵
Interface energy,21 σ [Jm−2] 0.093
linear kinetic coeicient,16μ
k [mK−1s−1] 0.4
Figure 1: Comparison between experimental microsegregation proiles and predicted by the Scheil's equation and phase-ield model: (a) Al–2.64×10⁻²mol%Cu with Ke = 0.1004 and (b) Al–4.5×10⁻²
mol%Cu with Ke = 0.1045.
Figure 2 shows the experimental data of the efective partition coeicient (Kef) as a function of solidiication
rates (VL).
From the data obtained by Meza et al.15, we proposed
experimental equations for the partition coeicient as a function of the solidiication rate, as showed in Figure 2. The efective partition coeicient (Kef) increases with the solidiication rate; in the other words the growth rate has a signiicant role on the partition coeicient. The origin of such changes of the partition coeicient is closely linked solidiication kinetics, in the other words; the increasing of solidiication speed favors the departure from equilibrium. These experimental equations for the efective partition coeicient (Kef) of the Al-Cu alloys are considered in the
Figure 2: Efective partition coeicient (Kef) versus solidiication rates (VL).
Figure 3: Efective partition coeicient (Kef) and solidiication rates (VL) versus solidiication time (t): (a) Al-2.64×10⁻²mol%Cu and (b)
Al-4.5×10⁻²mol%Cu alloys.
Figures 4a-b displays results obtained with a
two-dimensional simulation of an Al-Cu dendrite for two diferent copper concentrations with solidiication time equal to
0.002 s. In this simulation non-isothermal dendrite growth
and the efective partition coeicient (Kef) were assumed. In order to analyze the efect of initial copper concentration
on the dendrite morphology, simulations were carried out, separately. An approach was used, in which a solid nucleus is previously added at the center of the computational domain. The preferential growth angle (θ0) of the dendrite tip with respect to the x axis is 45º. The anisotropy mode is
j = 4.The concentration ield during solidiication process
is depicted in Figures 4a-b.In the picture, the gray scale represents solute concentration, while the white contour represents the concentration of the copper segregated from
the solid to the liquid region. The copper concentration in the solid region is much less than that in the liquid. In
The change in the phase-ield mobility (M) is inversely
proportional to the initial concentration (C0), Figure 5. These results show that a change in initial concentration (C0) afects
both the dendrite morphology signiicantly (Figure 4) and the phase-ield mobility (Figure 5). Figure 6 shows new predicted microsegregation proiles, in which the efective partition coeicient (Kef) has been adopted, while the experimental
data are the same from Figure 2. For all the predicted results in Figure 6, the simulation plot is shifted up, improving the
predictions. This is so because the efect of the growth rate has been included on the efective partition coeicient (Kef), both in the phase-ield model and Scheil’s equation. This diference constitutes the main new feature in the phase-ield
model. A more elaborate microstructure model would allow improvements to the prediction of the solute concentration to be attained, providing some microstructural information that might be of great interest for materials processing. That would be possible, if the present model could incorporate the real
properties of the rapid solidiication process. The diiculty
arises from the fact that an experimental apparatus would be
necessary allowing solidiication thermal parameters such
as the cooling rate and the growth rate to be experimentally determined and correlated with the scale of the dendritic microstructure.
and grow up while the primary arms grow, and the secondary arms try to grow upright to the primary arms. Because of the solute redistribution, it can be seen that interdendritic concentration is high, and the primary arms spine, as well as the secondary arms spine are relatively low. Figure 4b shows
the results of simulation for the Al-4.5×10⁻²mol%Cu alloy.
It depicts the efect of changes on the initial concentration
of the system. From the contrast between Figures 4a and 4b, it can be seen that the dendritic morphologies are
evidently diferent. First of all, the primary and secondary arms are much longer and thicker; second, one can see that the ield of segregated solute is thinner, Figure 4a. The
secondary arms are not well developed with an additional copper concentration, because of copper enrichment at the interface and reduction of interface mobility, Figure 4b. In other words, by increasing the alloy copper concentration, the dendrites become narrower.
The phase-ield mobility (M) is calculated by equation 5, during simulation of solidiication. The results of phase-ield mobility for each binary alloy (Al-2.64×10⁻²mol%Cu and
Al-4.5×10⁻²mol%Cu), it is showed in Figure 5.There, the
solid/liquid interface velocity decreases, depending on the
initial concentration (C0), due to a variation in phase-ield mobility (M) as just mentioned.
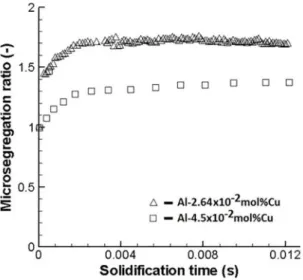
Figure 7 shows the microsegregation ratio for the two
cases examined in the present study: Al-2.64×10⁻²mol%Cu
and Al-4.5×10⁻²mol%Cu alloys. The microsegregation ratio is
given by the ratio of the maximum concentration (maximum
interdendritic concentration) in the liquid region and the
initial alloy concentration (C0). The microsegregation ratio
of the binary alloy with the initial concentration equal to 2.64×10⁻²mol% is higher than that of the alloy having an
initial concentration of 4.5×10⁻²mol%.The reason is that the
driving force is larger for the phase transformation of the
Al-2.64×10⁻²mol%Cu alloy. The driving force behind the
solidiication process is quantiied by the last product on the right-hand side of equation 1.From Figure 7, it can be seen
by comparing the results of both alloys that the variation
of the microsegregation ratio has a similar proile. In that igure, the microsegregation ratio is seen to increase faster
Figure 4: Dendrites calculated by the phase-ield model for diferent initial concentrations (C0) of copper, Al-2.64×10⁻²mol%Cu (a) and
Al-4.5×10⁻²mol%Cu (b).
Figure 5: Phase-ield mobility versus solidiication time for the Al-2.64×10⁻²mol%Cu and Al-4.5×10⁻²mol%Cu alloys.
Figure 6: Comparison between experimental microsegregation proiles and predictions furnished by Scheil's equation and the phase-ield model with Kef: (a) Al–2.64×10⁻²mol%Cu and (b)
and Al–4.5×10⁻²mol%Cu alloys. It was shown that with
the increase in copper concentration, the dendrite becomes narrower and the secondary arms are not well developed, and that was caused by solute enrichment at the growth interface and reduction in interface mobility. The microsegregation ratio was shown to be higher for the alloy having the lowest solute concentration. This has been attributed to the higher
solidiication driving force associated with the alloy of initial concentration equal to 2.64×10⁻²mol%. Since the
growth is faster, therefore, there is less time for difusion of copper in the liquid region, thus provoking an increase in the concentration of the interdendritic liquid.
5. References
1. Salvino IM, Ferreira LO, Ferreira AF. Simulation of Microsegregation in Multicomponent Alloys During Solidiication. Steel Research International.2012;83(8):723-732.
2. Salvino IM, Jácome PAD, Ferreira AF, Ferreira IL. An analysis of the Physical Properties of Multicomponent Alloys on the Simulation Solidiication by Phase-Field Model. Materials Science Forum. 2013;730-732:703-708.
3. Liu MX, Wang K, Xia D, Jiang T. Phase-ield simulation of Al-Si binary dendritic growth and micro-segregation patterns under convection. Journal of Alloys and Compounds. 2014;589:431-435.
4. Li J, Wang J, Yang G. Investigation into microsegregation during solidiication of a binary alloy by phase-ield simulations. Journal of Crystal Growth. 2009;311(4):1217-1222. 5. Warnken N, Ma D, Drevermann A, Reed RC, Fries SG, Steinbach
I. Phase-ield modelling of as-cast microstructure evolution in nickel-based superalloys. Acta Materialia. 2009;57(19):5862-5875. 6. Wei M, Tang Y, Zhang L, Sun W, Du Y. Phase-Field Simulation
of Microstructure Evolution in Industrial A2214 Alloy During Solidiication. Metallurgical and Materials Transactions A. 2015;46(7):3182-3191.
7. Ferreira AF, Ferreira LO, Assis AC. Numerical simulation of the solidiication of pure melt by a phase-ield model using an adaptive computation domain. Journal of the Brazilian Society of Mechanical Sciences and Engineering. 2011;33(2):125-130.
8. Kobayashi R. Modeling and numerical simulations of dendritic crystal growth. Physica D: Nonlinear Phenomena. 1993;63(3-4):410-423. 9. Kim SG, Kim WT, Lee JS, Ode M, Suzuki T. Large Scale
Simulation of Dendritic Growth in Pure Undercooled Melt by Phase-Field Model. ISIJ International. 1999;39(4):335-340.
10. Warren JA, Boettinger WJ. Prediction of dendritic growth and microsegregation patterns in a binary alloy using the phase-ield method. Acta Metallurgica et Materialia. 1995;43(2):689-703.
11. Ferreira AF, de Melo EG, Ferreira LO. Prediction of Secondary-Dendrite Arm Spacing for Binary Alloys by Means of a Phase-Field Model. Steel Research International. 2015;86(1):58-64.
12. Ferreira AF, Castro JA, Ferreira IL. 2D Phase-Field Simulation of the Directional Solidiication Process. Applied Mechanics and Materials. 2015;704:17-21.
13. Ode M, Suzuki T. Numerical Simulation of Initial Microstructure Evolution of Fe-C Alloys Using a Phase-ield Model. ISIJ International. 2002;42(4):368-374.
at the onset of solidiication. This is because Cmax increases quickly due to the copper enrichment ahead of the growth interface, at the beginning of solidiication. However, Cmax changes slightly in the remaining time, when the thickness of the difusion boundary layer in the liquid region becomes
steady. For this reason, the rate then gradually dwindles toward to a constant value.
Figure 7: The microsegregation ratio (Cmax/C0) versus solidiication time (t).
4. Conclusions
Despite the tremendous efort and developments in solidiication modeling applications, there still remains a
comprehensive demand for further understanding of the physical mechanisms behind microstructural formation, involving the
efects of processing conditions on the microstructure and
microsegregation of alloys used in technical applications. By performing comparisons between experimental
microsegregation proiles and theoretical ones predicted by Scheil’s equation and the phase-ield model (both models with equilibrium partition coeicient), it was found that the
computed results showed reasonable agreement between
them. However, the calculated and experimental results difer considerably. This has been attributed to the use of equilibrium partition coeicients in the calculations, since rapid solidiication efects led to signiicant deviations from the equilibrium phase diagram. In contrast to the previous phase-ield models, in the present study the numerically simulated results were obtained by incorporating the efect of the growth rate into efective partition coeicients, which had
been experimentally determined for a range of growth rates. It was shown that such approach has led to good agreement
between measured and predicted microsegregation proiles of Al–2.64×10⁻²mol%Cu and Al–4.5×10⁻²mol%Cu alloys.
In order to analyze the efect of copper concentration on
the morphology of the resulting dendrites, two-dimensional
14. Ode M, Suzuki T, Kim SG, Kim WT. Phase-ield model for solidiication of Fe-C alloys. Science and Technology of Advanced Materials. 2000;1:43-49.
15. Meza ES, Bertelli F, Goulart PR, Cheung N, Garcia A. The efect of the growth rate on microsegregation: Experimental investigation in hypoeutectic Al–Fe and Al–Cu alloys directionally solidiied. Journal of Alloys and Compounds. 2013;561:193-200.
16. Oguchi K, Suzuki T. Phase-Field Simulation of Free Dendrite Growth of Aluminum-4.5 mass% Copper Alloy. Materials Transactions. 2007;48(9):2280-2284.
17. Wesner E, Choudhury A, August A, Berghof M, Nestler B. A phase-ield study of large-scale dendrite fragmentation in Al–Cu. Journal of Crystal Growth. 2012;359:107-121.
18. Choudhury A, Reuther K, Wesner E, August A, Nestler B, Rettenmayr M. Comparison of phase-ield and cellular automaton
models for dendritic solidiication in Al–Cu alloy. Computational Materials Science. 2012;55:263-268.
19. Boettinger WJ, Warren JA, Beckermann C, Karma A. Phase-Field Simulation of Solidiication. Annual Review of Materials Research. 2002;32:163-194.
20. Qin RS, Bhadeshia HK. Phase-ield method. Materials Science and Technology. 2010;26(7):803-811.
21. Ode M, Kim SG, Kim WT, Suzuki T. Numerical Prediction of The Secondary Arm Spacing Using a Phase-Field Model. ISIJ International. 2001;41(4):345-349.