117
Abstract
Short-term mining planning typically relies on samples obtained from channels or less-accurate sampling methods. The results may include larger sampling errors than those derived from diamond drill hole core samples. The aim of this paper is to evaluate the impact of the sampling error on grade estimation and propose a method of correcting the imprecision and bias in the soft data. In addition, this paper evalu-ates the beneits of using soft data in mining planning. These concepts are illustrated via a gold mine case study, where two different data types are presented. The study used Au grades collected via diamond drilling (hard data) and channels (soft data). Four methodologies were considered for estimation of the Au grades of each block to be mined: ordinary kriging with hard and soft data pooled without considering dif-ferences in data quality; ordinary kriging with only hard data; standardized ordinary kriging with pooled hard and soft data; and standardized, ordinary cokriging. The results show that even biased samples collected using poor sampling protocols improve the estimates more than a limited number of precise and unbiased samples. A well-designed estimation method corrects the biases embedded in the samples, mitigating their propagation to the block model.
Keywords: biased samples, grade estimates, kriging, cokriging, sampling error. Cristina da Paixão Araújo
Doutoranda, MSc,
Universidade Federal do Rio Grande do Sul - UFRGS Departamento de Engenharia de Minas
Porto Alegre – Rio Grande do Sul - Brasil [email protected]
João Felipe Coimbra Leite Costa Professor Titular, Engenheiro de Minas, MSc, PhD Universidade Federal do Rio Grande do Sul - UFRGS Departamento de Engenharia de Minas
Porto Alegre – Rio Grande do Sul - Brasil [email protected]
Vanessa Cerqueira Koppe
Professor Auxiliar, Engenheiro de Minas, MSc, Dr Universidade Federal do Rio Grande do Sul - UFRGS Departamento de Engenharia de Minas
Porto Alegre – Rio Grande do Sul - Brasil [email protected]
Improving short-term grade
block models: alternative
for correcting soft data
Mining
Mineração
http://dx.doi.org/10.1590/0370-44672016710007
1. Introduction
Mineral deposit mining decisions are based in part on the information provided in the grade block models obtained from samples. To decrease the uncertainties of these grade estimates, short-term min-ing plannmin-ing staff increase the samplmin-ing density in order to provide accurate and precise predictions. Using a larger number of samples improves the reliability of the resulting estimates. During the explora-tion stage, sampling is typically obtained from diamond drill holes (DDHs). The DDH technique is costly but provides ac-curacy and precision. High-quality data is sparse during the exploration stage. In the production stage, sampling is typically performed using other techniques due to budget constraints and the need for rapid data acquisition and model updates. Gen-erally, these production samples are of
lower quality than DDHs and are not rigorously prepared and controlled, as they are not subject to a QAQC protocol (quality assurance / quality control). These results can contain large sampling errors. Given that two sources of information with differing quality levels are available, we want to understand how to use the low-quality data to update the block model while avoiding bias propagation that af-fects the inal results.
The goals of this article are to evalu-ate the impact of sampling error-affected data quality on block classiication by iden-tifying methodologies that can mitigate bias in the data, and to propose a method of correcting imprecision and bias in soft data. In addition, it evaluates the beneits of using soft data in mine planning. The methodologies tested were illustrated
us-ing a case study of a gold mine where Au grades obtained from core samples via diamond drilling (hard data) and from samples obtained via channels (soft data) were available. Four methods for estimat-ing the Au grades at each block to be mined were investigated.
The results of the different methods were compared using three statistical ap-proaches. They were the linear correlation coeficient (ρ), the slope of the linear regres-sion (y=bx) measured from the scatter-plot between the estimates and the reference data set, and the absolute error (Costa, 1997). These statistical approaches were used to conirm the accuracy and precision of the estimation methods. The number of misclassiied blocks, i.e. ore classiied as waste, waste as ore, and their sum was also determined for each of the models.
2. Methodology
Four methodologies were evalu-ated for block grade estimation: ordinary kriging with hard and soft
data pooled without considering dif-ferences in data quality; ordinary krig-ing with only hard data; standardized
118
Method 1- Ordinary kriging with pooled hard and soft data:
Ordinary kriging was thoroughlyexplained by GOOVAERTS (1997).
In this method, the hard and soft data were pooled without considering
dif-ferences in data quality. The modeled variogram is
Method 2- Ordinary kriging with only hard data:
This method used only accurate,precise hard data to conduct estimates with
ordinary kriging. The variogram is same as that used in Method_1 (Equation 1).
Method 3- Standardized ordinary kriging with pooled hard and soft data:
The differences in sample support(volume and delimitation) between the channel (soft data) and diamond drilling (hard data) methods indicate global and conditional biases. In our estimate, the hard and soft data were
pooled together, and a correction factor was used to mitigate the bias. This es-timation worklow can be understood as a form of co-kriging in a situation where hard and soft data are strongly correlated. In the irst step, soft data
(Zj(uαj )) was standardized (see Equation 2) using its mean (mj) and standard de-viation (σj). The transformation shown in Equation 2 leads to a mean of zero and standard deviation of unity in the transformed data:
Next, the soft standardized data
Zj (uαj )* was rescaled to match the hard
data statistics (see Equation 3) using its mean (mi) and standard deviation (σi).
Thus, the means of the hard and soft data are now equal.
From a geostatistical viewpoint, this difference in data precision and accuracy must be considered when integrating the two data types. This proposal relies on
standardizing the soft data (Equation 2) using its declustered mean and standard deviation. Next, the soft data is rescaled (Equation 3) using the mean and standard
deviation from the hard data.
The variogram used for these es-timates was the same that presented in Equation (1).
Method 4- Standardized Ordinary Cokriging
Standardized ordinary cokriging isthoroughly explained by GOOVAERTS (1997). This is a suitable framework for incorporating data sets of varying quality levels. It considers spatial auto and cross-correlations among the variables involved. This method also ilters bias from
inac-curate datasets, and uses standardized residuals instead of the original data. This article uses standardized ordinary cokriging, in which the sum of the weights of the primary and secondary variables is 1. Spatial continuity is deined using the linear model of coregionalization (LMC).
During cokriging, the LMC controls the weights allocated to the soft data. A correlation is obtained using the cross-covariance, since the cross-variogram requires collocated data (an isotopic multivariate dataset). The adjusted LMC is shown in Equations (4), (5), and (6).
The four methods were tested using the same variogram model (Methods 1, 2, and 3) itted on the dia-mond drill hole dataset (Equation 1) to evaluate the eficacy of each methodol-ogy. The estimates were performed on
10x10x10 m blocks discretized using 5x5x5 points within each block, ar-ranged along the north (x), east (y), and vertical (z) axes. The search strategy used a maximum of two samples per angular sector of the search ellipsoid.
Eight angular sectors were used with a minimum distance of 2 m between samples. The same search neighbor-hood (using octants) and range from the primary variograms were used for each of the four estimates.
3. Case Study
(1)
(2)
(3)
(4)
(5)
(6)
This case study uses data from one geological domain with samples that
mimic two sampling techniques. The data generated via DDH and channel
119
3.1 Creating a reference block
A reference model that mimics a real, unknown deposit was obtained via geostatistical simulation using the Turning Bands algorithm (JOURNEL, 1974). This model was derived from unconditional simulations. No data was used to generate the model, however a histogram and var-iogram were used as input. The grid nodes were sampled, since the grades within themineralized domain reproduced the statis-tical input. The sampling scheme followed a typical long-term sampling pattern when using DDH and a short-term pattern when using channel samples.
Table 1 shows statistics from the reference point support model derived from unconditional simulations, and the DDH (hard data) samples used to perform
estimations. Also the statistics for the reference block support model obtained by upscaling the point simulated model at 10 m blocks are depicted. A few drill holes were virtually drilled on the refer-ence point simulated model providing 311 samples. The drill hole collars are spaced at an average of 10x10 m and sampled at every vertical meter down the hole.
Number of Data Points Mean Dev.Std. CV Min. Max.
simulated model
(point support) 125766 2.27 4.91 2.16 0.03 33.47
DDH samples 311 2.41 4.46 1.85 0.03 33.47
simulated block
support model 477 2.31 1.30 0.92 0.30 8.82
Table 1 Statistics from the original and block reference data.
3.2 Creating bias and imprecision
The reference point simulated values were disturbed by adding ran-dom Gaussian errors of +/- 25%. Bias was also added increasing the grades by 25%. These biased samples mimic what frequently occurs within channel samples in gold deposits. The error wasassumed to be heteroscedastic, i.e. the variance increases with the mean, as commonly occurs (GOOVAERTS, 1997; MATHERON, 1963).
This imprecise and biased reference point model was used as a source for soft data sampling. An additional set of
chan-nels was sampled virtually in this grade model using a 3 x 3 x 1 m grid.
Table 2 shows statistics from the reference point support biased and impre-cise dataset used as the soft data source. Channel samples in this dataset mimic poor-quality, bias-affected data.
Data Number of Data Points Mean Dev.Std. CV Min. Max.
Reference biased
and imprecise model 125766 2.83 6.24 2.20 0.00 72.25
Channel samples 1246 3.69 7.91 2.14 0.02 51.56
Table 2 Statistics from the original reference, and
from the biased and imprecise soft data.
4. Results and discussion
Figure 1 shows scatter plots that relate the estimates (using all tested esti-mation methods and data) to the reference model thought to represent the true block grades. In addition, Figure 1 shows the global mean and the standard deviation of each model, as well as the linear cor-relation coeficients (ρ) and slopes of the linear regressions (y = bx) between the estimates and the reference. Figures 1a, 1b, and 1c show estimates determined using ordinary kriging.
Figure 1a shows ordinary kriging results produced when hard and soft data are pooled together, and differences in data quality are ignored. The results are clearly unsatisfactory. The means and standard deviations of the estimates are higher than those of the reference model. The estimates are biased due to systematic overestimation. This solution
is not recommended for use in updating the short-term geological model.
Figure 1b shows estimates produced using ordinary kriging with a small num-ber of accurate, precise data points. The means of the estimated grades are similar to those of the reference block grades, and the slope of the regression (0,48) and lin-ear correlation coeficient (0,29) are low. When estimates are made using hard and soft data combined with stan-dardized ordinary kriging (Figure 1c), the linear correlation coeficient (0,60) is one of the highest encountered from the methods considered and the slope of the linear regression (0,73) is close to 1. Ad-ditional bias-corrected data leads to better estimates, increasing the eficacy of the correlation. This model exhibits the best overall results, as well as reduced condi-tional bias. Method 3 uses corrected soft
data as a primary variable in the estima-tion process. It receives the same weight as the hard data, and thus increased its inluence on the estimates.
120
0.2 and 0.7, the results may not be of high quality. (MINNITT; DEUTSCH, 2014)
The cross correlograms indicated by Equation 5 show that approximately 78% of the total cross-covariance of the phenomenon (sum of the nugget effect and irst structure of the correlogram) deteriorates quickly at the irst lags, i.e.
has low spatial continuity of approxi-mately 2 m. This leads to low soft data weights, even when the data is similar to that of the points being estimated. This high variability is related to the presence of sampling and preparation errors in the soft data (greater inaccu-racy), which increases the nugget effect.
This higher imprecision is clear when the variograms are compared: the nug-get effect from the soft data (Equation 6) is 20% higher than that from the hard data (Equation 5), thus affecting the weights received by the soft data. In addition, soft data is irregularly spaced along the area studied.
Figure 1
Scatter-plot of estimates vs. the reference block model for: a) Method 1_ Ordinary kriging with hard and soft data, without consideration of data quality; b) Method 2_Ordinary kriging with only hard data; c) Method 3_Standarized ordinary kriging with hard and soft data; and d) Method 4_Standarized ordinary cokriging.
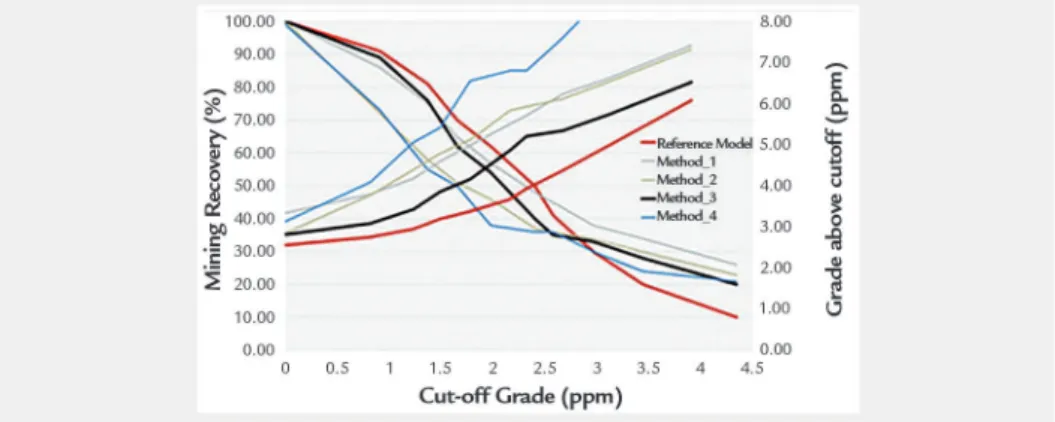
Figure 2 shows cut-off grade x ton-nage and cut-off x average grade curves for the reference block grade (red lines), as well as for estimated models. The es-timates made using Method 1 (ordinary kriging with hard and soft data combined – light blue lines) produce a poorer grade
tonnage curve. Ordinary kriging overes-timates the grades above cut-off. Also, the largest deviations from the tonnage predicted by the true model occur with the ordinary kriging block model. For all cutoffs, the best results are obtained from the grade tonnage curve produced using
Method 3 (standardized ordinary kriging with hard and soft data pooled – black lines). The result produced is closest to the reference curve. These results show that soft data may improve short-term geologi-cal mine planning when an appropriate methodology is used to integrate it.
Figure 2
Cut-off grade x tonnage and cut-off x ave-rage grade curves for the reference block grade model (red lines) and the estimates.
Figure 3 shows a histogram of the errors of each estimation method con-sidered. The error median was chosen for bias assessment, as it tends to be statistically less sensitive to extreme
values. The median error for ordinary kriging using only hard data is -0,52 (Figure 3a), while using ordinary krig-ing with hard and corrected soft data produces an error of -0,17 (Figure 3b),
and standardized ordinary cokriging produces an error of -0,65 (Figure 3c). A smaller bias was obtained using ordinary kriging with hard and bias-corrected soft data.
(a) (b)
121 Figure 3
Histogram showing the error of each estimation method considered a) Method 2_Ordinary kriging with only hard data; b) Method 3_Standarized ordinary kriging with hard and soft data; and c) Me-thod_4 Standardized ordinary cokriging.
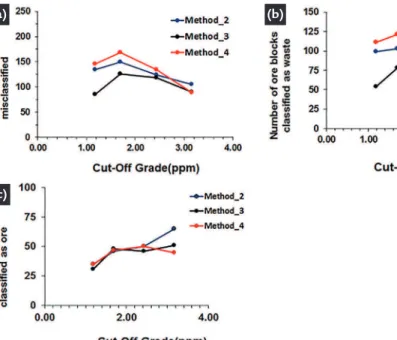
Figure 4 shows the total number of misclassiied blocks, the number of ore blocks classiied as waste, and the num-ber of waste blocks classiied as ore. Four cutoffs were considered: 1.18 g/t (Q20), 1.69 g/t (Q40), 2.43 g/t (Q60), and 3.16 g/t (Q80). The standardized ordinary
kriging model using hard and soft data (black line) minimized block misclassii-cation. This difference can be seen with the cut-off grade 1.69 g/t in Figure 4b, where Method 4 erroneously classiies 25 more ore blocks as waste than Method 3. Use of an adequate estimation worklow
reduces the number of ore blocks disposed of, and consequently provides more ore blocks for processing, increasing mine metal recovery. Thus, use of a more precise methodology leads to better decision-making when choosing destinations for the mined blocks.
(a) (b)
(c)
5. Conclusion
Geostatistical worklows with dif-fering treatments of hard and soft data were investigated in order to integrate samples with known bias into the estima-tion process. Four methodologies were tested: ordinary kriging with only hard data, ordinary kriging with hard and soft data combined, standardized ordinary kriging with hard and soft data, and
standardized ordinary cokriging. When cokriging was used, a moder-ate correlation between data types was noted when modeling the cross-covariance with short spatial continuity. Conse-quently, low weights were assigned to secondary soft data. Cokriging produced a lower coeficient of correlation with the reference model than standardized kriging
with hard and soft data.
Ordinary kriging with sparse hard data samples (a small number of accurate data points) produced global statistics that were similar to those of standardized kriging with hard and soft data. However, the irst exhibited local bias as indicated by the lower coeficient of correlation with the reference model.
(a) (b)
(c)
122
Received: 12 February 2016 - Accepted: 23 October 2017.
References
A correction factor was applied to biased and imprecise samples in order to mitigate global and conditional biases. The results show that the soft data can be standardized using the declustered mean and standard deviation when the samples are in the same domain. Next, the soft data is rescaled using the mean and standard deviation of the hard data.
After these corrections, two types of samples (hard and soft data) were
given equal weight in the standardized ordinary kriging worklow. The results produced by this methodology showed that the bias presented in the samples was not reproduced in the estimates.
This case study shows that soft data may improve short-term geo-logical modeling when an appropriate method is used to integrate it. The best option is Method 3- standard-ized ordinary kriging with hard and
soft data, assuming that hard and soft data are moderately correlated and exhibit short-range cross variograms. The scatter-plot of estimates versus reference values indicates one of the highest available coeficients of cor-relation, a slope of regression closer to one, an absolute error close to zero, and better block-classifying eficiency than other methods for most of the cut-off grades tested in this study.
Acknowledgments
The authors would like to thank the Brazilian National Research Agency
(CNPq), Vale S.A., and Petrobras for sup-porting the Mineral Exploration and
Min-ing PlannMin-ing Research Unit (LPM) at the Federal University of Rio Grande do Sul.
COSTA, J.F. Developments in recoverable reserves estimation and ore body modelling.
Queensland, Australia: University of Queensland, 1997. 666p. (PhD Thesis.) GOOVAERTS, P. Geoestatistics for natural resources evaluation. New York: Oxford
University Press, 1997. 483p.
JOURNEL, A. G. Geoestatistics for conditional simulation of ore bodies. Economic
Geology.Mining Geoestatistics, v. 69, n. 5, p. 673-687, 1974.
MATHERON, G. Principles of geostatistics. Economic Geology, v. 58, p. 11246-11266, 1963.
MINNITT, R. C. A., DEUTSCH, C. V. Cokriging for optimal mineral resource.
Journal of the Southern African Institute of Mining and Metallurgy. v. 114, n. 3,