Evaluation of a Thermochromic Liquid Crystal for Use as a Temperature Sensor for
Components of Electrical Systems
Roselane Bussolo Cesconetoa, Andresa Rodriguesa, Alexandre Gonçalves Dal-Bóa, Newton Luiz Dias
Filhoa, Marcio Roberto da Rochaa, Tiago Elias Allievi Frizona,b*
Received: September 23, 2016; Revised: April 23, 2017; Accepted: May 01, 2017
Connectors used in electrical power distribution systems should allow the passage of electricity continuously and without interruption. However, this does not always occur due to failure caused by improper assembly and/or corrosion of the materials employed, which relects the quality of service. Notable among the new detection technologies that have been studied to facilitate the identiication of defects is the use of thermochromic materials, which allow the easy identiication of “hot spots”, without the need for specialized equipment and personnel. In this context, in this study, the performance of a thermochromic liquid crystal was evaluated with the aim of developing a temperature sensor for connectors used in electrical power distribution networks. For the evaluation of the performance, thermal and ultraviolet radiation degradation tests were conducted, as well as analysis using spectroscopic (FTIR, FTIR-HATR, UV-Vis, 1H NMR) and thermal (DSC, PLM) techniques. The results indicated that the liquid crystal and the associated components showed no degradation under the test conditions, as well as a good color stability was observed, verifying the viability of the use of these materials for the construction of a temperature sensor. A ield test was performed with the devices and was efective for the suggested application.
Keywords: Temperature sensor. Electrical connector. Liquid Crystal. Thermochromic.
* e-mail: [email protected]
1. Introduction
Systems for the distribution of electrical power rely on several components, which perform important roles in relation to the continuous passage of electric current through contact surfaces, without interruptions, and the reduction of losses1. These systems involve electrical connections between circuits, equipment and extensions. Wedge-type connectors are installed between aluminum or copper wires and cables using appropriate impact tools, with the detonation of explosive charge cartridges2.
Poor tool handling, resulting in bad contacts, and corrosion processes can cause overheating in the connections, which can lead to increases in the losses and interruption of the electrical power supply. It can also adversely afect the quality of the service provided by the power distribution companies in relation to their adherence to the standards and parameters established by the Brazilian Electricity Regulatory Agency (Agência Nacional de Energia Elétrica, ANEEL)3, which can incur heavy ines1,4,5. Thus, the identiication of overheating in the components of electrical systems is of great interest to power distribution companies, since possible failures and interruptions in the electrical power supply can be identiied1,4.
The detection of overheating in the components of an electrical system is currently carried out based on diferent signal transmission mechanisms6,7. However, this approach has limitations which can lead to an incorrect diagnosis of the problem or inhibit the detection of a fault, and the method is also often very costly to implement. Contact sensors, thermocouples, resistance temperature detectors and thermometers collect and transfer data obtained in inspections to a data acquisition and processing center. This involves the use of extensive wiring1, equipment, software programs and specialized personnel to interpret the data. Thermal imagers, which measure the emitted infrared radiation, are dependent on in loco parameters of regulation and thus certain skills are required on the part of the operator. Also, specialized personnel are needed to interpret the data obtained, and the weather conditions need to be considered, since on very bright or rainy days the correct identiication of a faulty component is hindered.
New technologies have been developed and used to monitor and detect hot spots, notably the use of sensors which employ thermo-sensitive materials, with chromic phenomena, since they produce an optical response which is easy observed8,10. In this respect, the use of sensors based on organic materials provides an alternative, since their color changes when they are submitted to temperature variations, a Programa de Pós-Graduação em Ciência e Engenharia de Materiais - PPGCEM, Universidade do
Extremo Sul Catarinense, 88806-000, Criciúma - SC, Brasil
enabling the detection of faulty components as a result. Among these materials, cholesteric liquid crystals are widely used, as they respond easily to temperature changes11 and thus make it possible to estimate temperature12. The chiral molecules that form the cholesteric liquid crystals, pack to minimize unfavorable steric interactions, forming an optically active helical macrostructure. When the pitch propeller formed by the orientational ordering of the molecules is comparable to the visible light range, the helical phase will scatter or relect iridescent light13.
This fact is related to the size of the helical pitch, which is very sensitive to temperature variations. The size of the pitch is of the order of a few angstroms, thus having the same order of magnitude as the wavelength of the visible electromagnetic spectrum14. Therefore, the color of the scattered light also depends on the ambient temperature, consequently being able to produce a thermochromic efect when the helical pitch is comparable to the light wavelength15.
Due to the properties exhibited by cholesteric liquid crystal materials, they can be applied in many diferent ways, since technological applications such as computer displays, cell phones, paints and adhesives; also can be applied as thermal sensors in industrial engines, electric wires, food and beverage packing16.
In this context, the aim of this study was to develop and evaluate a temperature sensor for the visual detection of overheating in components of electrical power networks. The sensor is versatile in terms of both application and inspection, does not require the use of optical equipment (naked eye detection), and allows easy interpretation of the results9,10. The identiication is easy due to the sensitivity of some cholesteric liquid crystal, leading to a color change according to the temperature. The sensor can be applied to a wide range of components which can undergo overheating, for instance, connectors, switch disconnector, distribution and power cables and electrical circuit boards.
2. Materials and Methods
A thermochromic liquid crystal (Cholesteryl Perlagonate – purchased from Sigma–Aldrich (St. Louis, MO, USA)) was melted on Petri dishes on a plate and cooled to room temperature, forming a layer with an average thickness of 0.37 mm. To provide protection against ultraviolet (UV) radiation, the dishes were covered with a self-adhesive polymeric ilm of colorless laminated polyester, manufactured by Insulglass®, with dimensions of 120 mm x 30 mm x 0.04 mm (length x width x thickness). The above-mentioned materials were used to prepare prototypes of the temperature sensor with a recipient base comprised of a 1090 aluminum plate, with dimensions of 50 mm x 50 mm x 0.4 mm (length x width x thickness), in which a central circular cavity was excavated, with a diameter of 30 mm and depth of 2 mm. A black coating was applied to the cavity using carbon originating from the
combustion of butane gas, in order to provide color contrast in relation to the LC, and a layer of bi-component (acrylic/ aliphatic) polyurethane varnish (WEGTHANE ONA 501), manufactured by WEG, was applied over the LC and cured for 24 h. The cavity was illed in with molten LC and the prototype surface was covered with polymeric ilm molded with a heat gun. Figure 1 shows the assembly scheme for the temperature sensor prototype. The LC, the protective polymeric ilm and the temperature sensor prototypes were tested under exposure to artiicial conditions in a thermal chamber and in two UV radiation chambers for 1000 h. In the thermal chamber, manufactured by Biopar Equipamentos Eletrônicos Ltda (model S22 SD), the LC deposited on Petri dishes and samples of the protective polymeric ilm were tested at 50±2 °C. This temperature was based on data for the highest temperature recorded in 2014 at the weather station of Epagri/Iparque/UNESC17. The same chamber was later used to test the temperature sensor prototypes at 78±2 °C. The UV radiation chamber contained four 15 W tubular luorescent bulbs manufactured by Glight. Two of these bulbs emitted UV-A radiation at a wavelength of 365 nm and two emitted UV-B radiation at 312 nm, with a radiation intensity of 0.435 mW/cm². The chamber was not cooled and the heating generated by the bulbs reached 45±2 °C. In another chamber, equipped with a cooling device, six Philips bulbs (model Actinic BL) were used, which emitted UVA radiation at a wavelength of 330 nm, with a radiation intensity of 2.01 mW/cm². The radiation measurements were recorded in the chambers with a digital UV measurement device manufactured by Instrutherm (model MRUR-202). The chamber with four bulbs reproduced artiicially a 144% incidence of UV-A and UV-B and the second chamber reproduced 824% of UV-A, based on data recorded at the weather station of Epagri/Iparque/UNESC between January and December 2014; with a daily average of 13 h of radiation11.
Fourier transform infrared (FTIR) spectroscopy analysis was carried out using a Shimadzu spectrometer (model IRAinity-1S), with 20 scans, 2 cm-1 resolution and 4000
Figure 1. Photographs showing the assembly of the temperature
to 600 cm-1 wavelength. The LC samples were analyzed in transmittance mode in sodium chloride windows and samples of the protective polymeric ilm were analyzed using the horizontal attenuated total relectance (HATR) technique, in zinc selenide (ZnSe). Hydrogen nuclear magnetic resonance (1H NMR) spectroscopy analysis of the LC samples solubilized in deuterated chloroform (CDCl3) was carried out on an instrument manufactured by Oxford Instruments, operating at 60 MHz. A Shimadzu UV-Vis spectrophotometer (model UV-1800), with a scanning from 600 to 200 nm, was used to analyze the LC samples in 9.5x10⁻³ molar (M) solutions in
dichloromethane (CH2Cl2), in quartz cuvettes with a 10-mm optical path. The samples of the protective polymeric ilm were attached directly to the cuvette holder. The LC were analyzed by diferential scanning calorimetry (DSC) using a TA Instruments calorimeter, (model DSC Q20), under a nitrogen low of 70 ml.min-1, with heating from 25 °C to 110
°C at a rate of 10 ºC/min, keeping a constant temperature of 110 °C for 3 min followed by cooling to 25 ºC. The second heating and cooling run was carried out with the same temperature intervals at a rate of 5 ºC/min. Images of the LC textures were obtained using polarized light microscopy (PLM) with the aid of a Zeiss optical microscope (model Z1) with magniications of 20X and with heating from 20 to 110 ºC at a rate of 5 ºC/min followed by cooling to 20 °C at the same rate. The evaluation of the stability of the temperature at which the color of the LC changed, using the prototypes tested, was carried out applying heating and cooling on a plate and monitoring the temperature with an infrared thermometer. The responses obtained in the analysis of the test specimens were compared to those of the materials without exposure to the test conditions.
The evaluation of the functionality of the temperature sensor in a wedge-type connector was carried out. A simulation of the service conditions was performed with heating and cooling on a heating plate, using an infrared thermometer to monitor the color change according to the temperature.
3 Results and Discussion
3.1 Spectroscopic characterization
3.1.1 Fourier transform infrared spectroscopy
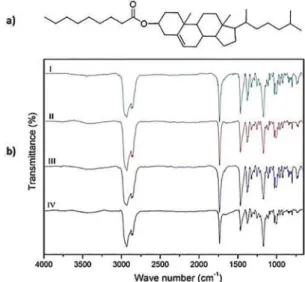
The spectra obtained in the FTIR analysis of LC sample are given in Figure 2, where it can be observed that the characteristic bands obtained for this compound are in agreement with reports in the literature18. An intense band at 1735 cm-1 corresponds to the bond stretching vibrations of the carboxyl groups (C=O) and a set of bands at 2952 to 2852 cm-1 is associated with the stretching vibrations of the bond between the aliphatic carbon and hydrogen (C-H). The spectra for the LC sample exposed to the test conditions,
Figure 2. a) Structure of the Liquid Crystal - Cholesteryl Perlagonate;
b) FTIR spectra for LC: I) without exposure; II) exposure in UV-A radiation chamber with cooling for 1000 h; III) exposure in UV-A and UV-B radiation chamber without cooling for 1000 h; IV) exposure
in thermal chamber for 1000 h.
thermal, UVA and UVB for 1000 h (Figure 2 II, III and IV) do not show signiicant changes in comparison to the spectrum of the LC without exposure (Figure 2 I).
3.1.2 Hydrogen Nuclear Magnetic Resonance
The 1H NMR spectra for the LC without exposure and for the samples originating from the Petri dishes exposed to the tests for 1000 h showed a set of signals, as seen in Figure 3. At 0.30 to 2.50 ppm (represented by a), there is a signal
with an area relating to 60 hydrogens, corresponding to the aliphatic part. A signal at 4.59 ppm relates to a hydrogen (represented by b) neighboring an oxygen atom of the C-O
bond of the sp3 carbon of the molecule.
A signal was observed at 5.37 ppm, which corresponds to the hydrogen (represented by c) in the double bond
of cyclohexane. The signals at 0.0 and 7.25 ppm relate, respectively, to the solvents tetramethylsilane (TMS) and deuterated chloroform (CDCl3) used in the analysis. No shift in the signal related to the hydrogen was observed and the appearance new signals was not noted, demonstrating the stability of the LC under the conditions analyzed.
3.1.3 UV-Visible spectroscopy
The normalized UV Vis spectra show the same maximum intensities and baselines, as shown in Figure 4.
The spectra show a maximum absorption band at 227 nm with a low molar absorption coeicient (ε), 81.4 L. mol-1 cm-1, which corresponds to a n→π* transition of the carbonyl group. In the spectra of Figure 4 a slight broadening appear but no signiicant changes in the LC samples exposed to tests were observed in comparison to the samples without exposure (represented by 0 h in Figure 4). A slight yellowing was observed during the longer exposure, but did not show signiicance through the analysis of the FTIR and NMR spectra performed. In this way, does not present degradation product. However, the liquid crystal will still be protected by a ilm with UV ilter, increasing the photochemical stability of the compound. The results also show that the maximum absorption band of the compound is in the UV-C region and, according to the literature, this radiation does not normally reach the surface of the earth, since it is blocked by the ozone layer19,20, and when it does its percentage is low21. This favors the use of the LC outdoors, as in the case of temperature sensors used to identify hot spots in electrical connectors.
3.1.4 Diferential scanning calorimetry
Figure 5 shows the DSC thermogram for the LC without exposure to the tests. In the heating process (lower curve) two endothermic events are observed: a more pronounced peak corresponding to the transformation of the solid phase to the liquid crystal mesophase and another peak at a higher
temperature corresponding to the transformation of the mesophase to an isotropic liquid phase.
In the cooling process (upper curve of Figure 5), from isotropic phase, two exothermic events are observed. The irst peak corresponds to the transformation of the isotropic phase to the liquid crystal mesophase and the second peak corresponds to a transition from the liquid crystal phase to a solid phase. Table 1 shows the values obtained for the temperatures and variations in enthalpy in the DSC analysis for the LC, under the same conditions of analysis, according to type of sample and the exposure.
A comparative analysis of the values given in Table 1 shows that signiicant changes in the temperature and enthalpy values for the LC samples exposed to the test conditions did not occur in relation to the unexposed specimens. This suggests that new compounds were not formed, demonstrating the stability of the LC under the test conditions.
3.1.5 Polarized light microscopy
The textures observed in the PLM analysis of the LC samples exposed to the test conditions for 1000 h are the same as those observed for the LC without exposure (Figure 6). Changes in terms of the phase transition temperatures, the formation of a mesophase and fusion were not observed.
It was also observed that all samples melted completely, indicating there was no occurrence of degradation products under the tested conditions.
Based on the LC results obtained from the spectroscopic and thermal methods applied and also the considerations presented herein, the use of the LC as a temperature sensor is viable since it showed good thermal and chemical stability under the conditions tested.
3.2 Polymeric ilm for UV protection
3.2.1 Fourier transform infrared (FTIR) spectroscopy
The spectra corresponding to samples of the polymeric ilm for UV protection analyzed by FTIR using the HATR method are given in Figure 7. The set of bands observed on
Figure 4. UV-Vis spectra for LC in 9.5x10⁻³ M CH2Cl2 solution according to the exposure time: a) exposure in UV-A radiation chamber
Figure 5. DSC thermogram of the second heating-cooling run with a
heating rate of 5 ºC/min for LC without exposure to the test conditions.
Table 1. Values determined for the temperature (T) and variation
in enthalpy (ΔH) by DSC in the second heating-cooling run for LC without exposure and samples exposed to the respective test
conditions for 1000 h.
Type of exposure Heating Cooling
T (oC) (ΔH (J/g)) T (oC) (ΔH (J/g))
Without exposure LC 92.46 (0.95) IsoCr 79.45 (46.30) Iso 91.24 (1.11) LC 74.61 (0.49) Cr
UV-A LC 92.46 (1.09) IsoCr 79.45 (46.34) Iso 91.24 (1.30) LC 74.61 (0.47) Cr
UV-A + UV-B LC 92.48 (1.11) IsoCr 79.44 (46.98) Iso 91.23 (1.35) LC 74.60 (0.44) Cr
Thermal LC 92.57 (0.90) IsoCr 79.70 (48.09) Iso 91.13 (1.11) LC 74.41 (0.41) Cr
Cr = crystal; LC = liquid crystal mesophase; Iso = isotropic
Figure 6. LC textures observed by PLM: (a) on heating; (b) isotropic
and (c) on cooling.
Figure 7. FTIR spectra of polymeric ilm for UV protection: I) not
exposed; II) exposure in UV-A radiation chamber with cooling for 1000 h; III) exposure in UV-A and UV-B radiation chambers without cooling for 1000 h; IV) exposure in thermal chamber for 1000 h.
Figure 8. UV-Vis spectra for the polymeric ilm for UV protection
without exposure and with exposure to the test conditions for 1000 h. the spectra suggests the presence of ester groups. The band
at 1726 cm-1 is attributed to the C=O bond stretching of the ester groups and the multiple absorption bands at 1250-1050 are attributed to the stretching vibrations of -COO-. The intense band at 720 cm-1 is identiied as angular deformations of CH2, which suggests the presence of an ester22. The bands at 2960, 2930 and 2860 cm-1 refer to C-H bond stretching of the aliphatic groups, bands at 1630, 1450 and 1410 cm-1 can be attributed to the stretching of the aromatic ring and the band at 870 cm-1 to the deformation of the C-H bond of the two hydrogen atoms adjacent to the aromatic ring20. The band at 3485 cm-1, relating to the O-H-type bond, can be attributed to the presence of moisture during the tests, since they were not carried out under an inert atmosphere.
On comparing the FTIR-HATR spectra (Figure 7) for the samples exposed to the test conditions and those not exposed, no changes, such as the appearance and/or shifting of bands, were observed, verifying the stability of the polymeric ilm23-25.
3.2.2 UV-Visible spectroscopy
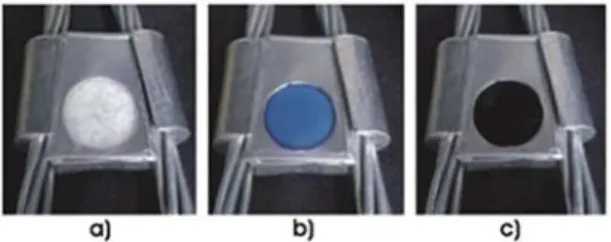
Figure 9. Color variation of LC in the temperature sensor prototype:
on the left, heating from 80 to 90 °C; in the center, isotropic phase at temperatures above 100 °C; on the right, cooling from 90 to 80 °C. The results obtained in the FTIR-HATR and UV-Vis spectroscopy analysis of the polymeric ilm for UV protection indicated that this material could be used in the construction of a temperature sensor, with good durability and performance for use in the ield.
3.3 Temperature sensor
The development of the temperature sensor prototype has been described above in the materials and methods section. The results for the evaluation of the color variation presented by the LC can be observed in Figure 9.
It was observed during the heating process that at 80 ºC and with the formation of mesophase the LC displayed a blue color, which remained up to 90 ºC. As the heating process continued, fusion occurred and the LC became colorless, which allowed the black color applied to the bottom of the cavity to be observed. Thus, the sensor can be used to identify two temperature conditions (~80 and >100 °C).
This evaluation was also carried out for the temperature sensor prototypes exposed to the test conditions for 1000 h and the color changes observed were the same as those for the prototype without exposure shown in Figure 9. Thus, it was veriied that the exposure of the prototypes to the tested conditions did not alter the desired characteristic (i.e., the change in color), demonstrating the good stability of the LC when applied as a temperature sensor.
The stability of the blue color of the LC in the temperature sensor prototype exposed to the thermal chamber was monitored daily and it was veriied that this condition remained unchanged for the whole exposure time. This result indicates that the temperature sensor with LC ofers good stability for the identiication of hot spots in connectors, its color characteristics being the main feature of interest. The results with regard to the functionality of the temperature sensor under simulated working conditions are given in Figure 10.
The temperature sensor developed in this study demonstrated the behavior expected during the simulation of overheating in a wedge-type connector (Figure 10), with easy visualization of the color changes at certain temperatures. Field tests were performed with the developed devices, simulating the actual operating environment, and the hot spots can be easily identiied during inspections without the need for the use of specialized equipment and/or personnel.
Figure 10. Temperature sensor assembled in wedge-type connector:
(a) at room temperature; (b) with heating and cooling between 80 and 90 °C; (c) above 100 °C.
4. Conclusions
The LC evaluated under artiicial conditions in thermal and UV radiation chambers did not show signiicant alterations in terms of chemical structure or the color change feature. The evaluation of the protective polymeric ilm under the same test conditions also veriied stability. Thus, these materials appear to be viable for the development of temperature sensors for use in the ield.
Temperature sensor prototypes were prepared and subjected to UV and thermal degradation tests, and their behavior in terms of color change and stability was evaluated. The results demonstrated the stability of the sensor under the test conditions, since there was no change in the functional characteristics (color change) after the tests.
Other important factors are related to the conception of the temperature sensor. Besides being assembled without the need for specialized equipment and personnel, the aluminum plate used as the recipient base can be easily dimensioned, broadening the possibilities for the use of this sensor in other components of electrical systems which can show undesired overheating. The prototypes were sent for field monitoring on real connectors in the electric distribution network. These sensors, during an evaluation period of 90 days, indicated good performance on monitoring the overheating of these connectors. Based on the results obtained, the temperature sensor developed in this study is able to identify hot spots for long periods of time in service. Also, the easy color visualization is fundamental to accelerating the inspection of the components of electrical systems.
5. Acknowledgements
The authors would like to thank Centrais Elétricas de Santa Catarina S.A (CELESC P&D) 5697-8712/2012 for their inancial support.
6. References
1. Braunovic M, Myshkin NK, Konchits VV. Electrical Contacts:
Fundamentals, Applications and Technology.Boca Raton:
2. CELESC - Centrais Elétricas de Santa Catarina S.A. Manual
Especial: Conector cunha; 2006. Available from: <http://
novoportal.celesc.com.br/portal/index.php/normas-tecnicas/ especiicacao-de-equipamentos-e-materiais>. Access in: 12/2/2014.
3. Pelizzari E, Martins COD, Menezes AFS. Aplicações da termograia como ferramenta de manutenção preditiva em conectores elétricos. In: 17º Congresso Brasileiro de Engenharia e Ciência
dos Materiais (CBECIMat); 2006 Nov 15-19; Foz do Iguaçu,
PR, Brazil. p. 6315-6325.
4. Brasil. Agência Nacional de Energia Elétrica (ANEEL). Resolução Nº 024: Estabelece as disposições relativas à continuidade da
distribuição de energia elétrica às unidades consumidoras;
2000. Available from: <http://www.aneel.gov.br>. Access in: 12/2/2014.
5. Revie RW, ed. Uhlig’s Corrosion Handbook. 3rd ed. Hoboken:
John Wiley & Sons; 2011. 1296 p.
6. Lindquist TM, Bertling L, Eriksson R. Estimation of disconnector contact condition for modelling the efect of maintenance and ageing. In: Power Tech, 2005 IEEE Russia; 2005 June 25-30;
St. Petersburg, Russia. IEE. p. 1-7.
7. Suesut T, Nunak N, Nunak T, Rotrugsa A, Tuppadung Y. Emissivity
measurements on material and equipment in electrical distribution system. In: 11th International Conference on Control, Automation
and Systems; 2011 Oct 26-29; Gyeonggi-do, South Korea.
IEEE. p. 1259-1263.
8. Braunovic M. Aluminium Connections: legacies of the past. In:
Proceedings of the Fortieth IEEE Holm Conference on Electrical
Contacts; 1994 Oct 17-19; Chicago, IL, USA. IEEE. p. 1-31.
9. Fu WH, Hsiao VKS, Tang JY, Wu MH, Chen Z. All iber-optic sensing of light using side-polished iber overlaid with photoresponsive liquid crystals. Sensors and Actuators B:
Chemical. 2011;156(1):423-427.
10. Smith CR, Sabatino DR, Praisner TJ. Temperature sensing with thermochromic liquid crystals. Experiments in Fluids.
2001;30(2):190-201.
11. Brown TL. Química: a Ciência Central. 9a ed. São Paulo:
Pearson Education; 2005. 992 p.
12. Algorri JF,Urruchi V, Bennis N, Sánchez-Pena JM, (2014) A
Novel High-Sensitivity, Low-Power, Liquid Crystal Temperature
Sensor, Sensors (Basel). 14(4): 6571–6583.
13. Heiney PA, Fontes E, de Jeu WH, Riera A, Carroll P, Smith
AB. Frustration and helicity in the ordered phases of a discotic compound. Journal de Physique France. 1989;50(4):461-462.
14. Goodby JW. Phase Structures of calamitic liquid crystals. In: Demus D, Goodby J, Gray GW, Spiess HW, Vil V. Handbook of liquid crystals. Pt II. Weinheim: Wiley-VCH; 1998. p. 3-21. 15. Meier G, Sackmann E, Grabmaier JG. Applications of Liquid
Crystals. Berlin Heidelberg: Springer-Verlag; 1975.
16. Moreira MF, Carvalho ICS, Cao W, Bailey C, Taheri B, Palfy-Muhoray P. Cholesteric liquid-crystal laser as an optic iber-based temperature sensor. Applied Physics Letters. 2004;85(14):2691.
17. EPAGRI. Dados históricos. 2015. Available from: <http://sol. ciram.sc.gov.br/siscrici/produtos/form_dadosHist.jsp?Dia1=2 0&Mes1=4&Ano1=2015&Dia2=20&Mes2=5&Ano2=2015& estacao=1043>. Access in: 19/1/2015.
18. Frenkel M, Marsh KN. Spectral Data for Steroids. Boca Raton:
CRC Press; 1994. 996 p.
19. Gao W, SchmoldtD, SlusserJR, eds. UV Radiation in Global
Climate Change: Measurements, Modeling and Efects on
Ecosystems. Berlin Heidelberg: Springer-Verlag; 2010.
20. Rånby B. Photodegradation and photo-oxidation of synthetic
polymers. Journal of Analytical and Applied Pyrolysis.
1989;15:237-247.
21. Fragata F, Amorim CC, Ordine AP. Desempenho de tintas de acabamento frente às radiações ultravioleta, UVA e UVB, e condensação de umidade. Corrosão e Protecção de Materiais.
2010;29(3):91-98.
22. Nonemacher R, Santos P, Tomasi L, Santana FA, Evangelista M, Pires M, et al. Avaliação da aplicabilidade de técnicas MIC/ FT-IR/DSC para a caracterização de ilmes multicamadas.
Polímeros. 2007;17(2):158-168.
23. Holland BJ, Hay JN. The thermal degradation of PET and
analogous polyesters measured by thermal analysis–Fourier transform infrared spectroscopy. Polymer. 2002;43(6):1835-1847.
24. Botelho G, Queirós A, Liberal S, Gijsman P. Studies on thermal and thermo-oxidative degradation of poly(ethylene terephthalate) and poly(butylene terephthalate). Polymer Degradation and
Stability. 2001;74(1):39-48.
25. Bruno S, Zapponi M, Lazzarino HE, Pedraza JP. Metodología para Estimar la Resistencia al “Weathering” de Material Prepintado.