The composition of a self-compacting concrete (SCC) should be deined to fulills a number of requirements, such as self-compactibility, strength and durability. This study aims to compare three methods of dosage for SCC with local materials, so as to determine which one is the most economical and rational, thus assisting the executor in making a decision and enabling economic and technical feasibility for its application. The methods used in the experimental program were: Nan Su et al., which was developed in 2001 [1]; Repette-Melo, which was proposed in 2005 [2]; and Tutikian & Dal Molin, which was developed in 2007 [3]. From the results obtained in the experimental program, it was observed that the method which presented the lowest cost and highest compressive strength at the ages of 7, 28 and 91 days was Tutikian & Dal Molin, while the one which reached the lowest chloride ion penetration, best compactness and highest elasticity modulus was Repette-Melo. In tests carried out in the fresh state, all tested methods yielded mixtures which comply with the self-compactibility levels required by ABNT NBR 15823:2010 [4].
Keywords: self-compacting concrete, methods of dosing, properties in the fresh and hardened state.
A composição de um concreto autoadensável (CAA) deve ser deinida de forma a satisfazer um conjunto de requisitos, como a autocompactabili -dade, resistência e durabilidade. O objetivo deste artigo é comparar três métodos de dosagem para CAA com materiais locais, a im de determinar o mais econômico e racional, auxiliando a tomada de decisão por parte do executor e proporcionando a viabilidade econômica e técnica para aplicações. Os métodos utilizados no programa experimental foram: o de Nan Su et al., desenvolvido em 2001 [1], o de Repette-Melo, proposto em 2005 [2] e o de Tutikian & Dal Molin, elaborado no ano de 2007 [3]. A partir dos resultados obtidos no programa experimental, observou-se que o método que apresentou os menores custos e maiores resistências à compressão nas idades de 7, 28 e 91 dias foi o de Tutikian & Dal Molin e o que atingiu menor penetração de íons cloretos, melhor compacidade e maior módulo de elasticidade foi o de Repette-Melo. Nos ensaios rea -lizados no estado fresco todos os métodos experimentados obtiveram misturas que se enquadraram na classe de autoadensabilidade requerida pela ABNT NBR 15823:2010 [4].
Palavras-chave: concreto autoadensável. métodos de dosagem. propriedades no estado fresco e endurecido.
Self-compacting concretes (SCC) – comparison of
methods of dosage
Concreto autoadensável (CAA) – comparativo entre
métodos de dosagem
B. F. TUTIKIAN a [email protected]
M. PACHECO b [email protected]
a ENGENHARIA CIVIL, PPGEC, UNISINOS, [email protected] – Av. Unisinos, 950, centro 6 – Exatas, São Leopoldo / RS, Brasil; b ENGENHARIA CIVIL, UNISINOS, [email protected] – Av. Unisinos, 950, centro 6 – Exatas, São Leopoldo / RS, Brasil; Received: 17 Aug 2011 • Accepted: 03 Mar 2012 • Available Online: 03 Aug 2012
Abstract
1. Introduction
The development of self-compacting concrete represents a big step towards eficiency and working conditions at construction sites and in the prefabricated buildings industry. Such material enables shorter concreting times, better inish of the concrete surface, as well as better characteristics in the hardened state, thus generat-ing more durable structures (GRUNEWALD, 2004 [5]).
The beneits of SCC go beyond durability and resistance. Its use reduces noise pollution, since it does not call for the use of vibra -tors, which also contributes to lower electrical energy consump-tion. The use of SCC also minimizes the risk of accidents caused by an excessive number of people upon the slabs, since it requires less manpower. It also reduces ergonomic problems which affect workers, since the effort made in the launch and inish is smaller. According to Tutikian (2007 [3]), the use of SCC steers construc -tion services towards more industrialized produc-tion by reducing manpower cost, increasing quality, durability, conidence in the structure and workers’ security.
SCC can be considered the most signiicant achievement in con -crete technology in decades, and it should gradually replace part of the conventional concrete which is currently produced. SCC is a material which boasts a unique combination of performance and uni-formity, requirements which cannot be reached through the use of regular conventional construction components (SONEBI 2004 [6]). Tutikian (2007 [3]) states that the interest SCC has attracted in Brazil is increasing, and it has been used in the prefabricated build-ings industry as well as in current special constructions. However, the main studies focus on its mechanical properties, durability and possibility of use with speciic types of local materials. Dosage, which is one of the key aspects of this material, has only been studied supericially.
SCC is more widely used in Japan and in Europe. In Brazil, howev-er, a higher level of conidence in the methods of dosage is neces -sary in order to make SCC more reliable and widespread, thus al-lowing bigger possibilities for its application anywhere that proves to be economically feasible (TÉCHNE MAGAZINE, 2008 [7]). Several international and national procedures or recommendations for SCC dosage have been issued as studies have become more consistent. Such methods might differ in criteria for the deinition of granular composition, such as the amount of ine materials, the setting of limits for the water/cement ratio, paste volume, amount of superplasticizer admixture, the use of viscosity modifying ad-mixture and separate studies of paste and mortar. Some methods also consist of sequences of calculations, which translate into limit intervals for each material in the mixture.
This study compares three existing methods of dosage for SCC with local materials in order to determine which one is the most economi -cal, sensible and durable, thus assisting the executor in making a decision and providing economical and technical feasibility for prac -tical applications, while also expanding the knowledge about SCC as well as its use. The methods of dosage chosen were the one proposed by Nan Su et al. [1], from 2001, for it is based on equations and empirical calculations; the one by Repette-Melo [2], developed in 2005, for it proposes a sequence of tests from the admixture in the paste to the concrete for the adjustment of the components in the mixture; the one by Tutikian & Dal Molin [3], developed in 2007, for it studies the granular skeleton of concrete before making it
self-compared through tests such as low, t500mm, “L-box” and “V-funnel” based on the limits deined by ABNT NBR 15823:2010 [4]. In the hardened state, the characteristics analyzed were compressive strength at 7, 28 and 91 days, the elasticity modulus at 91 days, propagation velocity of ultrasound waves at 91 days, and chloride ion penetration at 28 days, for all mixtures. This study also deter -mined the cost based on market values of the concrete components.
2. Aims of research
The main aim of this study is to make technical and economical comparisons between the methods of dosage for SCC proposed by Nan Su et al. in 2001 [1], Repette-Melo in 2005 [2], and Tutikian & Dal Molin in 2007 [3], through the use of materials available in the state of Rio Grande do Sul (RS), Brazil.
3. Materials and experimental program
In view of the objectives laid out here, an experimental program was created and developed which deines the tests conducted on the dif -ferent concretes as well as the materials used in the research. The experimental work was carried out at the Construction Materials Lab (CML) at the Vale do Rio dos Sinos University (UNISINOS). A vertical axis mixer was used in the manufacturing of all concretes, and the placing of materials followed an established order. Firstly, the coarse aggregate was placed, followed by 80% of the water, regular sand, ine sand, cement, admixture and the remainder of the water. In total, 8 mixtures of concrete were measured, with 11 samples mea -suring 10 cm in diameter and 20 cm in height being manufactured for each one of those mixtures, totaling 88 samples. These samples re -mained at room temperature for 24 hours, the tops of which protected by sheets of glass. Next, they were removed from their molds and taken to a moist chamber, where they were kept until they reached the relevant ages at which the tests should be performed.
3.1 Showcase of the methods of dosage used
3.1.1 Nan Su et al Method [1]
This method is divided into steps, as shown in Fig. 1. To deter -mine the amount of aggregates, the volume ratio between the ine
amount of cement has been determined, the water/cement ratio must be established according to local requirements and aggres-sive environmental exposure.
In order to establish the amount of water to be added to the mix-ture, the relevant ABNT NBR 6118:2007 [8] requirements were fulilled, and the aggressive environmental exposure was deined as III, with a water/cement ratio ≤ 0.50, which was the limit used. From Equation 4 the amount of water in the mixture is then known.
(4)
W
aC= (
a
/
c
)*
C
Hence WaC = 196 kg/m³.
The ine material selected for the dosage was ine sand. Since the amounts for all the other SCC components are known, the remain -ing volume miss-ing to complete 1 m³ belongs to the to the ine material (Vf) which should be found through Equation 5.
(5)
V
f=
1
-W
g-
Ws
-
C
-
W
aC- V
ar1000*G
g1000*G
s1000*G
c1000*G
aWhere:
Gg - coarse aggregate speciic mass; Gs - ine aggregate speciic mass; Gc - cement speciic mass; Ga - water speciic mass;
Var - amount of air incorporated into the SCC (in %).
The result obtained, 0.13, is applied in Equation 6 and thus the inal result for the amount of ine sand in the mixture is known.
(6)
W
f=Vf * 1000 * G
afWhere:
Wf - amount of ines in kg/m³;
Gaf - speciic mass for the ine material used in kg/m³; Vf - volume of ines in the mixture.
Wf = 303 kg/m³ of ine sand in the SCC mixture.
After the amounts of all aggregates are deined and the cement and wa -ter consumption is obtained, the percent additive is yet to be de-termined. The admixture/binder ratio adopted was 0.70% (amount of solids and liquids in the admixture), which was the value selected as an initial parameter, although such value might be changed depend -ing on the workability tests results.
The amount of water in the superplasticizer was considered as part of the water from the mixture. The quantity of admixture (in kg/m³) used in the mixture was calculated using Equation 7.
(7)
W
sp= n%*(C)
aggregate and the aggregate total (S/t) should be veriied. According to this method, this ratio should range between 50% and 57%. Given these igures, a 53% S/t ratio was established, and the eficacy of the mixture for self-compactibility on the fresh state tests was analyzed. The coarse aggregate composition was made up of 60% of 25 mm gravel and 40% of 19 mm gravel to be then employed in Equation 1. This was the arrangement which represented the largest number of voids.
(1)
W
g= PF*W
gL*(1-S/t)
Where:
Wg - amount of coarse aggregate in kg/m³;
WgL - density of coarse aggregate, in loose state in kg/m³ (1528 kg/m³ for the materials studied);
PF - loose state aggregate and compacted state aggregate ratio, in mass (0.941 for the materials studied);
S/t - volume ratio between ine aggregate and aggregate total, which ranges from 50% to 57% (53% adopted).
The result was Wg = 677 kg/m³ of coarse aggregate, being 406.20 kg/m³ for the 25 mm gravel and 270,80 kg/m³ for the 19 mm gravel. The ine aggregate, i.e., regular sand, was determined through Equation 2.
(2)
W
s= PF*W
sL*S/t
Where:
Ws - amount of ine aggregate in kg/m³;
WsL - density of ine aggregate, loose state, in kg/m³ (1470 kg/m³ for the materials studied);
PF - loose state aggregate and compacted state aggregate ratio, in mass (0.902 for the materials studied);
S/t - volume ratio between ine aggregate and aggregate total, which ranges from 50% to 57% (53% adopted).
The result was Ws = 703 kg/m³ of ine aggregate.
After having established the amounts of gravel and regular sand, the amount of cement is determined. So as to obtain the amount of cement per m³, it is irst necessary to adopt the required compres-sive strength in MPa (f’c) at 28 days.
The f’c selected for the calculation was 55 MPa. Therefore the compressive strength of the SCC at 28 days is supposed to be 55 MPa. From Equation 3 the cement consumption for the mixture can then be known.
(3)
C = f c
0,14
Where:
C - cement consumption in kg/m³;
f’c - required compressive strength in MPa.
workability tests were conducted, in compliance with ABNT NBR 15823:2010 [4], and it was concluded that the values were within the acceptable limits. The inal admixture/binder ratio in the mix-ture was 0.85.
It should be noted that for this method it was possible to create only one unit composition for the SCC mixture, since this method does not mention how to quantify auxiliary unit compositions for the dosage.
Table 1 shows the unit composition for this method.
3.1.2 Repette-Melo Method [2]
The lowchart for obtaining the SCC mixture by this method of dos-age is shown in Fig. 2.
The initial step for making the SCC mixture is the paste composition, by determining the water/cement ratio and the amount of ines added. n% is the superplasticizer/binder ratio, C is the amount of cement
per m³ in the mixture, m% is the amount of solids in the superplas -ticizer, Wsp is the amount of superplasticizer admixture used, and Wasp is the amount of water in the superplasticizer admixture. Considering Wsp = 2.75 kg/m³ worth of superplasticizer admixture, the amount of water existing in the admixture is calculated using Equation 8.
(8)
W
asp= (1 - m%)*W
spThe result was Wasp = 1.65 kg/m³ worth of water existing in the admixture.
Considering the amount of water existing in the superplasticizer admixture, the initial water consumption in the mixture became 197.65 kg/m³.
Taking into account all the ratios determined for the SCC composi-tion, the materials were then taken into the lab for dosage, with a unit composition test as the initial step. It is important to observe that the only amounts which may be altered after this step are the water/cement ratio and the amount of admixture/binder ratio. After mixing the materials using a mixer, workability tests were then carried out in order to verify the self-compactibility of the SCC. Based on the low test performed, it was veriied that the mixture was not luid enough, presenting a low result of 450 mm. From that result, superplasticizer admixture was added so as to reach better workability in the mixture, even before other tests were carried out. No water was added to the mixture.
After increasing the amount of admixture in the mixture, new
Table 1 – proportions obteined in each determination method
PARAMETER
Tutikian
METHODS
Nan Su et al.
Repette-Melo
1:m
3
4
5
6
4,28
3,50
3,97
4,32
w/c (kg/kg)
0,35
0,47
0,56
0,68
0,50
0,39
0,48
0,56
a
(%)
64
62
60
59
67
61
60
59
C (kg/m³)
538
421
350
297
393
490
432
398
TAF (%)
20
20
20
20
18
10
10
10
TG (%)
48
48
48
48
40
50
50
50
Adt (%)
0,62
0,62
0,62
0,62
0,85
0,75
0,75
0,75
R$
313,04
252,53
215,86
188,08
249,25
298,97
267,14
248,49
Where
1:m = Unit trace for each family a/c = Water / cement ratio (kg/kg) α = Content of mortar (%)
C = Cement consuption (kg/m³)
TAF = Content of fine sand aggregate in relation of total weight in mass (%) TG = Content of gravel aggregate in relation of total weight in mass (%) Adt = Content of additive (%) in relation of cement weight
$ = Total cost to obtein a 1m³ of concrete
In order to determine the water/cement ratio, the starting point es -tablished was the compressive strength according to the amount of water and cement used in each unit composition. For the deini -tion of a family of concrete, three values for the water/cement ratio were determined initially: one for the poor unit composition (w/c: 0.56), one for the rich (w/c: 0.39) and one for the intermediate unit composition (w/c: 0.48), based on the previous knowledge about the materials.
The amount of ines is determined for each speciied water/cement ratio and it is dosed to replace the cement, in volume. The method establishes that a percentage of iller passing through the 0.075 mm sieve should be used in this stage. Fine sand was used as ine material in order to achieve the SCC mixture. Since ine sand does not have a signiicant amount of particles smaller than 0.075 mm, it could not be included in the paste composition.
During the next step, the mortar for the mixture is prepared, by deining the amount of ine aggregate in relation to the total volume of mortar and then the basic amount of superplasticizer admixture. The amount of ine aggregate was adjusted only for a water/ce -ment ratio, the intermediate one, with the percentage found being used for the others.
As a basic guideline, the method establishes that the volume of ine aggregate in relation to the total volume of mortar should pref -erably be not less than 35% and not more than 55%.
A regular sand and ine sand composition was deined as ine ag -gregate. The choice of percentages for these materials was based on the optimal granulometric curve of the aggregates. From there it was concluded that the amount of ine aggregate which it best to the limit curve established by the method was the composition made up of 80% of regular sand and 20% of ine sand.
In order to determine the amount of ine aggregate, the mortars were assessed based on the low test, which was adapted for mortar. According to the test, the ideal amount of ine aggre -gate in the mortar composition was 50% in relation to the total volume, achieving satisfying test results when the amount of admixture was 0.20% (considering only the amount of solids), since the drainage time was 4 seconds and the low was 240
mm. According to the method, the ideal amount of admixture is the one which results in a mortar low diameter between 200 and 280 mm and a draining time in the “V-funnel” between 3.5 and 10 seconds.
The mortar with intermediate amount of water/cement was used in order to determine the amount of coarse aggregate for the prepa-ration of an initial test mixture with 30% of coarse aggregate in relation to the total volume of concrete. The method proposes an amount of coarse aggregate between 27% and 33%, the optimal value being the one which presents satisfying results on the work-ability tests while reaching a 0.3% percentage of admixture (taking into consideration only the amount of solids). Thus a value of 30% was adopted, which was the midpoint between the proposed limits. Using that percentage, a trial mixture with the intermediate unit composition was created so as to verify the acceptability of the ad-opted ratio, considering the initial amount of admixture determined during the mortar stage.
A mixture made up of 50% 25 mm gravel and 50% 19 mm gravel was used as coarse aggregate. These percentages were adopted based on the granulometric analyses of the gravel.
Figure 3 shows the granulometric curve of the ine and the coarse aggregate, according to the percentages adopted and the limit curves imposed by the method for determining the granulometric arrangement. As can be seen in Figure 3, the resulting granulo -metric curve from the mix of aggregates used for the mixture is within the limits recommended by the method. Were it not pos -sible to it any one of the aggregate compositions into the limit curves, it would be necessary to specify other materials with differ -ent granulometric characteristics and which enabled the feasibility of the mixture.
According to the method, the amount of admixture in the mor-tar represents a good indication of the results which will be achieved in the concrete. Generally speaking, an increase of roughly 0.1% in relation to the optimal amount of mortar is need -ed. Following the guidelines regarding the amount of admixture, the trial mixture contained initially 0.2% worth of superplasticiz -er. The low test showed that the mixture was not luid enough, which led to a gradual increase in admixture up to the maximum admissible amount, i.e. 0.3% (considering only the amount of solids). In case of unsatisfying results, the amount of coarse aggregate should be altered in relation to the total volume of
Figure 3 – granulometric curve of the
composition of the aggregates used
in the Repette-Melo [2] method
concrete while the mixture should be remade with different unit composition components. After the 0.1% increase in admixture, the low test was performed again and it was veriied that with the added superplasticizer the result obtained was in accor -dance with the established values. The remaining workability tests were then performed, namely T50, “L-box”, “V-funnel”, so as to verify the compliance of their results with the values given by ABNT NBR 15823:2010 [4].
Once the unit composition test was deined, and through the re-sults obtained, it was possible to calculate the inal unit composi -tions for the SCC. In order to calculate the amount of materials, 1 m³ worth of concrete was used, which was made up of 30% of coarse aggregate and 70% of mortar. The mortar was composed by 35% of ine aggregate while the remaining 65% was composed by water, cement and admixture.
It should be noted that due to the procedures determined by the method of dosage, it is necessary to maintain the same amount of coarse and ine aggregates for all water/cement ratios outlined in the initial step of the mixture procedure. This is relevant when it is recommended that the amount of mortar should be adjusted only for a water/cement ratio (the intermediate one, in the case of the construction of the curve of the family of concrete with three strengths). That implies that the only material which will be altered for each concrete is the cement consumption, which will cause a change in admixture consumption and amount of water. However, from one mixture to another, water will be added and cement and admixture will be reduced, considering for this group a constant amount of 0.35 m³.
The inal amount of superplasticizer admixture was 0.3% (only the amount of solids), which is the equivalent of 0.75% if the amount of solids and liquids existing in the admixture is considered. This percentage is set for other unit compositions with the same aggre-gate/cement ratio in mass, adjusting only the water/cement ratio. Table 1 shows the unit composition for this method.
3.1.3 Tutikian-Dal Molin Method
The method is presented in schematic form in Fig. 4. The irst step taken in order to obtain the mixture was to determine the granu-lar skeleton. The materials were packaged, two by two, starting with the ones with the largest granulometry going all the way down to the ones with the least granulometry. The irst package of the compression test was between the 25 mm gravel and the 19 mm gravel, followed by the compacity with regular sand and, lastly, with ine sand.
Table 2 shows the results of packaging the 25 mm gravel with the 19 mm gravel. It was observed that the mixture percentage which provided the smallest number of voids was the one with 60% of 25 mm gravel and 40% 19 mm gravel, with 41.02% of voids. It should be noted that the unit mass of this mixture is not the biggest of all, i.e., the ideal ratio is always the one which results in a smaller num-ber of voids. The compacted unit mass is only an indicator, since it is not suficient to reach a conclusion.
The second step of the packaging for the SCC mixture was obtain -ing the compactness between the previous mixture, with 25 mm gravel and 19 mm gravel, and regular sand. Table 3 shows the result of the packaging of the gravel and the regular sand. Lastly, the last packaging was performed, between the ine sand and and previously packaged aggregates. Table 4 shows the re-sults obtained from the compactness test of those materials. It was observed that the optimal composition was 80% a mix of 25 mm and 19 mm gravel and regular sand with 20% ine sand, which resulted in 16.61% worth of voids. The test was initiated with substitutions from 10% to 10% and increased in precision to 5% as it neared the ideal inal value.
The compactness test values between materials resulted in the following proportions for the SCC mixtures, in mass: 28.80% 25 mm gravel, 19.20% 19 mm gravel, 32% regular sand and 20% ine sand.
Table 2 – packing test between 25 mm gravel and 19 mm gravel
25 mm Gravel
(%)
19 mm Gravel
(%)
Unit massa of
mixture (kg/m³)
Compacted bulk
density (kg/m³)
Index of voids
(%)
100
0
3065,00
1704,35
44,39
90
10
3044,50
1736,23
42,97
80
20
3024,00
1755,36
41,95
70
30
3003,50
1753,04
41,63
60
40
2983,00
1759,42
41,02
50
50
2962,50
1736,23
41,39
40
60
2942,00
1701,45
42,17
30
70
2921,50
1634,78
44,04
20
80
2901,00
1597,10
44,95
10
90
2880,50
1556,52
45,96
Table 4 – packing test between 25 mm gravel, 19 mm gravel, the regular sand and fine sand
25 mm, 19 mm gravel
and regular sand (%)
Fine sand
(%)
Unit massa of
mixture (kg/m³)
Compacted bulk
density (kg/m³)
Index of voids
(%)
100
0
2725,80
2125,22
22,03
90
10
2686,22
2154,78
19,78
85
15
2657,29
2182,61
17,86
80
20
2646,64
2206,96
16,61
75
25
2626,85
2182,61
16,91
70
30
2607,06
2120,58
18,66
65
35
2587,27
2090,43
19,20
60
40
2567,48
2032,75
20,83
55
45
2547,69
1974,49
22,50
50
50
2527,90
1921,74
23,98
40
60
2488,32
1886,96
24,17
30
70
2448,74
1800,00
26,49
20
80
2409,16
1750,72
27,33
10
90
2369,58
1663,77
29,79
0
100
2330,00
1561,74
32,97
Table 3 – packing test between 25 mm gravel and 19 mm gravel and the regular sand
25 mm and 19 mm
Gravel (%)
Regular sand
(%)
Unit massa of
mixture (kg/m³)
Compacted bulk
density (kg/m³)
Index of voids
(%)
100
0
2983,00
1759,42
41,02
90
10
2918,70
1846,28
36,74
80
20
2854,40
1951,30
31,64
70
30
2790,10
2062,03
26,09
65
35
2757,95
2092,75
24,12
60
40
2725,80
2125,22
22,03
55
45
2693,65
2091,01
22,37
50
50
2661,50
2078,84
22,39
40
60
2597,20
2014,49
22,44
30
70
2532,90
1959,42
22,64
20
80
2468,60
1892,17
23,35
10
90
2404,30
1745,51
27,40
Following the completion of the compactness test, the next step was to determine the water/cement ratio and the amount of super-plasticizer admixture.
From that point on, unit composition I (1:4) was used to prepare the adjustment mixture, so as to conirm the water/cement ratio and, most importantly, determine the amount of superplasticizer admixture experimentally. First an admixture value of 0.50% (con -sidering the amount of solids and liquids in the admixture) was deined, in relation to the cement mass and a water/cement ratio of 0.40. After determining those values, the intermediate mixture was initiated, and from the tests performed in the fresh state, the inal ideal amount of superplasticizer admixture and the water/cement ratio were deined.
From the results obtained, the inal unit compositions for the SCCs were determined without the need for substitutions. According to the method, the ideal is to create four points so that the behavior equations have a higher coeficient of determination, allowing the curves to be better adjusted. The individual unit compositions are shown in Table 1.
3.2 Tests performed in the fresh state
In the fresh state the SCC families were tested in order to assess the low properties, passing ability, resistance to segregation and apparent plastic viscosity, following the technical speciications de-ined by ABNT NBR 15823:2010 [4]. The tests included low tests (SF), draining time (VS), “L-box” (PL) and “V-funnel” (VF). Fig. 5 shows the tests in the fresh state being performed in the lab.
3.3 Tests performed in the hardened state
In order to compare the properties obtained in each SCC family in the hardened state, the concretes were submitted to compressive strength tests at 7, 28 and 91 days, modulus of elasticity at 91 days, propagation velocity of the ultrasound wave at 91 days, and chloride ion penetration at 28 days.
The compressive strength test, performed in compliance with ABNT NBR 5739:2007 [7], was carried out because that is the most com -monly used property in research and in real applications, as well as the
Figure 5 – Tests carried out in the fresh state
most recalled by designers and other professionals. The SCC modulus of elasticity test, based on ABNT NBR 8522:2008 [10], was carried out because that is an important characteristic which impacts the removal
of the structural pieces from their molds while it is also a reason why some professionals choose not to use SCC, once it may face a signii-cant reduction in its value due to the materials used in its composition.
able 5 – chemical, fisical and mechanical properties of CP-V-ARI
Chemical properties
Fisical and mechanical properties
Cement chemical composition
Results (%)
Set time
Begining
02h22min
Silicon dioxide(SiO )
2
18,67
End
03h04min
Aluminum oxide (Al O )
2 3
4,07
Bulk Density
3
(g/cm )
3,13
Calcium oxide (CaO)
59,90
Compressive
strenght
(MPa)
1 day
20,5
Iron oxide (Fe O )
2 3
2,56
3 days
33,8
Magnesium oxide (MgO)
5,31
7 days
40,5
Sulfur oxide (SO )
3
3,02
28 days
48,6
Loss on ignition
3,32
Freedom CaO
1,70
Insoluble residue
0,64
Equivalent alkali
0,63
Table 6 – characteristics of the aggregates used in mixtures of SCC
Opening of sieves (mm)
Gravel 25 mm
Gravel 19 mm
Regular sand
Fine sand
Amount retained acumulated (%)
# 25
0
0
0
0
# 19
7
0
0
0
# 12,5
35
16
0
0
# 9,5
70
31
0
0
# 6,3
99
86
0
0
# 4,8
100
100
0
0
# 2,4
100
100
15
0
# 1,2
100
100
32
0
# 0,6
100
100
56
3
# 0,3
100
100
97
17
# 0,15
100
100
99
84
# 0,075
100
100
100
99
Depth (< 0,075)
100
100
100
100
Fineness modulus
6,77
6,31
2,11
1,04
Maximum size
25 mm
9,5 mm
4,8 mm
0,6 mm
Bulk density
3,07 kg/dm³
2,86 kg/dm³
2,34 kg/dm³
2,33 kg/dm³
Unit mass compacted
1,70 kg/dm³
1,50 kg/dm³
1,63 kg/dm³
1,56 kg/dm³
velocity of the ultrasound wave procedure, which was chosen for being a test which relies heavily on the compacity of the mixtures, identifying the packaging among all components. The chloride ion penetration test was chosen for being a representative for durability, regardless of its ap -plication. This test was adapted from the ASTM 1202:2007 [12] norm. Fig. 6 shows the tests performed in the hardened state.
3.4 Materials used
For the execution of the experimental work, the materials selected were ones found in the state of Rio Grande do Sul (RS), which are economi-cal and already used by the construction services for other purposes. In order to determine the characteristics of the aggregates used in the experimental work, the procedures adopted were in accor -dance with the following standards: the speciic mass tests of the ine aggregates (regular sand and ine sand) were performed ac -cording to ABNT NBR NM 52:2009 [13], while the speciic mass tests for the coarse aggregates followed ABNT NBR NM 53:2009 [14]. The unit mass tests were performed following ABNT NBR NM 45:2006 [15], and the granulometric composition analyses were made according to the ABNT NBR NM 248:2003 [16] procedures.
3.4.1 Cement
The cement used was CPV-ARI (Portland cement with high initial resistance). It was chosen because it is the most widely used in the prefabricated building industry, which is one of the areas where SCC can be employed with the most beneits. Table 5 shows its chemical, physical and mechanical properties.
3.4.2 Aggregates
Two basalt gravel compositions were used as coarse aggregate.
Table 7 – characteristics of superplastizer additive
Technical datas
Function:
Superplastizer additive of third generation for concrete
Chemical base:
Polycarboxylic ether
Aspect:
Liquid
White cloudy
Seciundary action
Water reducer
Total water solubility
It does nor contein calcium chloride, intentionally added, or chloride-based ingredients.
Test
Specification
Unit
Appearance
White cloudy liquid
Visual
pH
5 – 7
-
Density
1,067 – 1,107
g/cm³
Solids
38,0 – 42,0
%
Viscosity
< 150
cps
lanic material was used as ine material, namely ine sand. This aggregate is also used by some local companies, especially con -creting service providers for conventional concrete (CC) compo-sition and it may be stored outside in stalls which are relatively easy to be built, without the need for great resources such in the acquisition of a silo, for instance. All aggregates are commercially available in the South of Brazil. Table 6 shows the characteristics of the aggregates.
3.4.3 Superplastizer Additive
In order to dose the SCCs, a third generation superplasticizer ad -mixture was used, one based on a chain of modiied polycarbox-ylic ether which acts as a dispersant for the cementitious material, enabling superplastiication and great water reduction, making the concrete more workable without change in the setting time. The characteristics are shown in Table 7.
3.4.4 Water
Water from the public water supply was used in the manufacturing of the concretes, according to ABNT NBR 15900:2009 [17].
4. Results and Discussions
Table 1 shows the unit compositions obtained from the duties im -posed by each method of dosage performed in the experimental program.
basalt gravel cost 0.022 R$/Kg, and the superplasticizer admixture used cost 14.50 R$/Kg.
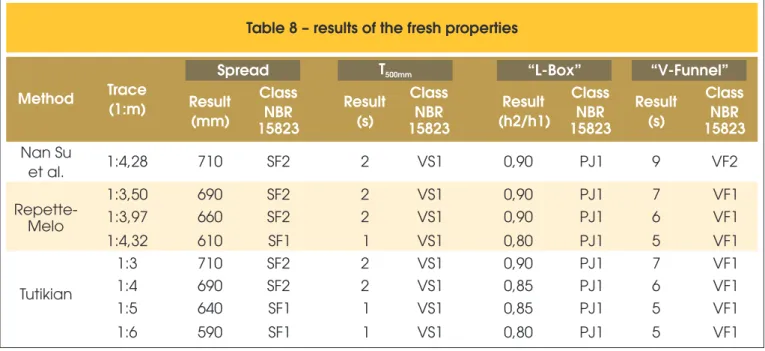
4.1 Fresh state tests results
Table 8 shows the results for the tests performed to assess the SCC behavior in the fresh state.
Considering the results obtained in the fresh state, it was possible to
Table 8 – results of the fresh properties
Method
Trace
(1:m)
Spread
T
500mm“L-Box”
“V-Funnel”
Result
(mm)
Class
NBR
15823
Result
(s)
Class
NBR
15823
Result
(h2/h1)
Class
NBR
15823
Result
(s)
Class
NBR
15823
Nan Su
et al.
1:4,28
710
SF2
2
VS1
0,90
PJ1
9
VF2
Repette-Melo
1:3,50
690
SF2
2
VS1
0,90
PJ1
7
VF1
1:3,97
660
SF2
2
VS1
0,90
PJ1
6
VF1
1:4,32
610
SF1
1
VS1
0,80
PJ1
5
VF1
Tutikian
1:3
710
SF2
2
VS1
0,90
PJ1
7
VF1
1:4
690
SF2
2
VS1
0,85
PJ1
6
VF1
1:5
640
SF1
1
VS1
0,85
PJ1
5
VF1
1:6
590
SF1
1
VS1
0,80
PJ1
5
VF1
conclude that the values achieved in the procedures carried out to assess SCC self-compactibility, as shown in Table 8, were satisfy-ing, for they it the standards outlined by ABNT NBR 15823:2010 [4]. In each family executed, it was veriied that the SCC unit composi-tion which provided the most cohesion, luidity and viscosity was the one which presented the highest cement consumption, a larger amount of mortar and consequently a smaller gravel consumption per m³, which allows the concrete more freedom to low.
Table 9 – values for the comparisons between the three methods of the experimental program
COMPARISONS BETWEEN METHODS
Nan Su et al., Repette-Melo e Tutikian & Dal Molin
Property
Reference
Comparison
reference
Values of
Compressive
strength at 7,28
and 91 days
Unit trace
Compressive strength at 7, 28 and 91 days for the
same unit traces
4,28
Cost
Compressive strength
at 7 days
Cost of the mixtures for the same range of
compressive strength at 7 days
36,7 MPa
Cost
Compressive strength
at 28 days
Cost of the mixtures for the same range of
compressive strength at 28 days
42,6 MPa
Cost
Compressive strength
at 91 days
Cost of the mixtures for the same range of
compressive strength at 91 days
48,8 MPa
Modulus of
elasticity
Compressive strength
at 91 days
Modulus of elasticity for the same range of
compressive strength at 91 days
48,8 MPa
Ultrasound
Compressive strength
at 91 days
Ultrasound for the same range of compressive
strength at 91 days
48,8 MPa
Chloride ions
4.2 Hardened state concrete properties comparisons
Firstly, the compressive strengths found at 7, 28 and 91 days will be compared for the same individual unit compositions and after the mixtures costs, as well as the modulus of elasticity, the propa-gation velocity of the ultrasound wave, and the chloride ion pen -etration, for the same compressive strength range.
In the Nan Su et al. method, it was not possible to execute the be -havior equation and the dosage diagram, since only one unit com-position was determined through it. Hence, so that the compari -sons could be made, the base values resulting from this method of dosage were used. For the other two experiments, Repette-Mello, 2005 [2], and Tutikian & Dal Molin, 2007 [3], the same individual unit composition and compressive strength in the behavior equa -tions will be sought, and they will be determined according to the characteristic properties of those methods.
It should be noted that this comparison is valid, since the results found by Nan Su et al., 2001 [1], are within the data limits estab -lished in the hardened state properties achieved in the Repette-Melo, 2005 [2], and Tutikian & Dal Molin, 2007 [3].
Table 9 shows the values established for the comparisons, in the hardened state, between the three dosage experiments. The age of 91 days will be the standard for the comparisons involving the modulus of elasticity, propagation velocity of the ultrasound wave, and chloride ion penetration.
4.2.1 Compressive strengths to 7, 28 and 91 days for the same unit stroke
For this comparison, an individual unit composition (1:m) was set. Through the behavior equations, the compressive strength at 7, 28 and 91 days was searched, as shown in Fig. 7, and it was possible to analyze which experiment reached the highest compressive strength for the same individual unit composition (1:4.28).
Observing Fig. 7, it can be concluded that the Tutikian & Dal Molin method, 2007 [3], presented a compressive strength at 7 days 1% higher than that presented by Nan Su et al., 2001 [1], and 29.5% higher than that presented by Repette-Melo, 2005 [2]. It should also be noted that, at 28 days, the Tutikian & Dal Molin method,
other two methods. Its value was 6.8% higher than the one ob-tained by Nan Su et al., 2001 [1], and 28.5% higher than that of Repette-Melo, 2005 [2]. Lastly, it was veriied that the Tutikian & Dal Molin method, 2007 [3], was also superior regarding compres-sive strength for the same individual unit composition, compared to the two other methods. At 91 days the result found was 4.5% higher than that of Nan Su et al., 2001 [1], and 29.1% higher than that of Repette-Melo, 2005 [2].
4.2.2 Cost of mixtures for the same compressive strength range at 7, 28 and 91 days
The cost comparisons, having the compressive strength set at 7 days, for all the methods, are shown in Fig. 8.
Based on the data presented in Fig. 8, it is observed that the Tu -tikian & Dal Molin method, 2007 [3], presented, for the same com-pressive strength range at 7 days, a cost which was 4.50% lower than that obtained by Nan Su et al., 2001 [1], and 14.5% lower than that obtained by Repette-Melo, 2005 [2].
For the same compressive strength range at 28 days, the Tutikian & Dal Molin method, 2007 [3], presented an estimated result which is 7.6% lower than that found by Nan Su et al., 2001 [1], and 14.9% lower than the result found by Repette-Melo, 2005 [2].
Finally, it was observed that for the compressive strength at 91 days the Tutikian & Dal Molin method, 2007 [3], once again obtained a value 6.1% lower than that by Nan Su et al., 2001 [1], and 14.4% lower than the value obtained by Repette-Melo, 2005 [2].
This behavior is probably owed to a better packaging of the ma -terials promoted by the method of dosage and the lower admix-ture consumption in relation to the amount of cement used in the admixture. Better aggregate granulometric packaging enables the mixture to boast fewer voids, thus obtaining a more homoge -neous structure.
In the concretes dosed by the Tutikian & Dal Molin method, the amount of superplasticizer admixture used was about 27% lower than that used by Nan Su et al., 2001 [1], and approximately 17.3% lower than that used by Repette-Melo, 2005 [2], thus favoring a cost comparison.
Figure 7 – Compressive strength of
“j” days for the same unit trace 1:4,28
4.2.3 Modulus of elasticity for the same compressive strength range at 91 days
The performance analysis done in all methods, which relates the modulus of elasticity for the same compressive strength range at 91 days is shown in Fig. 9.
According to the data presented in Fig. 9, it is observed that the Repette-Melo method, 2005 [2], presented a larger modulus of elasticity, for a strength of 48.8 MPa at 91 days, which is 7.6% higher than what was obtained by Tutikian & Dal Molin, 2007 [3], and 22.7% higher than what was found by Nan Su et al., 2001 [1]. The higher results achieved by Repette-Melo, 2005 [2], for this property are probably due to the larger amount of coarse aggre -gate obtained in the mixture composition and the smaller amount of mortar promoted by the method of dosage.
When the amounts of mortar obtained by all methods are com-pared, setting a compressive strength of 48.8 MPa at 28 days,
which was achieved by Nan Su et al., 2001 [1], it is possible to demonstrate that the experiment conducted by the Repette-Melo method, 2005 [2], the mixture presented an amount of mortar of 59.9%, while Tutikian & Dal Molin, 2007 [3], achieved 60.6% and Nan Su et al., 2001 [1] presented 67.4%.
It should be noted that in the Repette-Melo method, 2005 [2], the amount of coarse aggregate used was 50% in relation to the ag -gregate total, in mass, compared to 48% used by Tutikian & Dal Molin, 2007 [3], and 40% used by Nan Su et al., 2001 [1].
4.2.4 Propagation of velocity of the ultrasound wave for the same compressive strength range at 91 days
The propagation velocity of the ultrasound wave measurements were taken using the same samples from the modulus of elasticity test, therefore the same compressive strength ranges for the com-parison were deined, as well as the test age, at 91 days.
Fig. 10 shows the comparisons made for all methods of dosage, relating the ultrasound wave velocity for the same strength range at 91 days.
As can be seen in Fig. 10, the method which presented the best results was Repette-Melo, 2005 [2]. It is important to highlight that the difference between the results found by Repette-Melo, 2005 [2] and those found by Tutikian & Dal Molin, 2007 [3], is small, namely 0.4%, while the results found by Nan Su et al., 2001 [1] were 8.3% higher.
The difference between the values found by those two methods to assess this property is too small, therefore it can be said that Tutikian & Dal Molin, 2007 [3], and Repette-Melo method, 2005 [2], reached similar values for the propagation velocity of the ul-trasound wave.
4.2.5 Chloride ions penetration for the same compressive strength range at 91 days
Lastly, Fig. 11 shows the values obtained by all concretes regard-ing chloride ion penetration.
Figure 9 – modulus of elasticity comparison
for the same range of compressive
strength of 91 days for all methods
Figure 10 – ultrasound wave speed
comparison for the same range of
compressive strength of 91 days for all methods
Figure 11 – chloride ions penetration comparison
for the same range of compressive
ent comparison between the performance diagram properties, the same compressive strength ranges selected for the other catego -ries were maintained.
Based on the data shown in Fig. 11, it can be concluded that the Repette-Melo method, 2005 [2], presented a chloride ion penetra-tion 9.8% lower than did Tutikian & Dal Molin, 2007 [3] and 17.4% lower than did Nan Su et al., 2001 [1].
The amount of water in relation to the cement consumption in the mixture is an important factor which impacts concrete porosity, which in turn has a direct impact on chloride ion penetration. Thus it should be noted that the Repette-Melo method, 2005 [2], pro-vided a water/cement ratio of 0.46, against 0.51 in Tutikian & Dal Molin, 2007 [3] and 0.50 in Nan Su et al., 2001 [1]. Those results were achieved by setting the compressive strength at 91 days at 48.8 MPa, which is the value deined by the experiments done by the Nan Su et al. method, 2001 [1]. That value was adapted to match the behavior equations identiied Tutikian & Dal Molin, 2007 [3] and Repette-Melo, 2005 [2].
4.3 Non quantitative aspects reported in
the executation of the methods of dosage
Among the non quantitative aspects observed during the proce-dures for obtaining SCC through the methods performed during the experimental program, it was observed that in the procedures deined by Nan Su et al., 2001 [1] the calculation of cement con -sumption depends solely on the required compressive strength. During the experimental work, in order to determine the proportion of cement in the SCC mixture, it was established that the compres-sive strength at 28 days, according to the formula, would be 55 MPa, which resulted in an amount of cement corresponding to the adopted strength. However, it can be veriied that this process did not work properly, since the result for compressive strength at 28 days for this method was 44.8 MPa, which is 18.5% less than the value deined in the proposed empirical formula. It is known that there are several types of cement, aggregates, binders and admix -tures which impact the inal strength, and, in case it is intended to establish a universal equation to calculate cement consumption, all the aforementioned variables must be included.
In order to deine the amount of admixture, which is an important factor in cost composition for the SCC mixtures, the Repette-Melo method, 2005 [2], determines an establishment of the proportions to be used, irstly during the paste stage, then during the mortar stage and inally in the concrete. These early studies, in order to obtain the best performance from the admixture in the mixture, ended up creating a slower and more troublesome procedure for the dosage of concrete. It was veriied, through other methods, that such ex-periments have little effect on the amount of admixture. In Tutikian & Dal Molin, 2007 [3], for instance, which does not make use of such processes in order to achieve the superplasticizer consumption, a percentage 21% smaller of material in the mixture was obtained, in contrast to what was found by Repette-Melo, 2005 [2]. Thus it can be said that the ideal and optimal content of the admixture depends on the interaction of all elements in the unit composition, i.e., cement, sand, gravel, and that is only possible in the concrete stage. The Repette-Melo method, 2005 [2], in order to determine the coarse aggregate, proposes that the values used should range from 27% to 33% in relation to the total volume of concrete. That is
age will have seven alternatives for the choice of amount of coarse aggregate in the mixture. That engenders doubt during the choice, as happened to Nan Su et al., where an intermediate percentage was selected.
5. Final Considerations
In this study, three methods of dosage for the manufacturing of SSC were compared technically and economically, using the same materials. In view of the proposed goals, after the lab work, it can be concluded that:
n From this study, it was veriied that, in order to dose SCC with
aggregates found in the South of Brazil, the method which pre-sented the smallest cost and higher compressive strengths at the ages of 7, 28 and 91 days was Tutikian & Dal Molin, 2007 [3], while the one which reached the highest chloride ion pen -etration and highest compacity and modulus of elasticity was Repette-Melo, 2005 [2]. During tests performed in the fresh state, all methods tried obtained mixtures which it in the re-quired self-compactibility class;
n However, it should be noted that during the comparisons made
between Repette-Melo, 2005 [2] and Tutikian & Dal Molin, 2007 [3], the characteristics which involve the propagation velocity of the ultrasound achieved very similar results, i.e., the results may be considered identical due to the number of samples analyzed;
n Regarding workability veriication, it is observed that the values
achieved for each method of dosage tried could be adjusted, as long as the proportion of superplasticizer admixture is increased. That was not done in this study, since the amount was set to achieve the values of the established self-compactibility class. These considerations are only valid for the concretes dosed in this study, with materials from the South of Brazil, determined ac-cording to the presented proportions. It should be noted that the mechanical properties may suffer alterations if other materials are used, or higher or lower amounts of admixture are used, for in -stance. The criteria and compared aspects suggested may be use-ful instruments in selecting, among various methods with poten -tially the same answers, the one which best its reality or speciic needs for applications.
6. References
[01] SU, N.; HSU, K.C.; CHAI, H.W. A simple mix design method for self-compacting concrete. In: Cement and Concrete Research, n. 31, p. 1799-1807, 2001. [02] MELO, K. A. Proposição de método de dosagem de
concreto autoadensável com adição de fíler calcáreo. Dissertação de mestrado, UFSC, 2005.
[03] TUTIKIAN, B. F. Proposição de um método de dosagem experimental para concretos autoadensáveis. Dissertação de doutorado, Universidade Federal do Rio Grande do Sul, Porto Alegre, 2007.
[04] ASSOCIAÇÃO BRASILEIRA DE NORMAS TÉCNICAS. NBR 15823: Concreto autoadensável. Rio de Janeiro, 2010.
Doctoral Thesis. Delft University of Technology, The Netherlands, 2004. 232p.
[06] SONEBI, M. Medium strength self-compacting concrete containing ly ash: Modelling using factorial experimental plans. Cement and Concrete research, 2004.
[07] REVISTA TÉCHNE. Artigo76078: Solução Fluída. Editora: Pini nº 132. São Paulo, 2008.
[08] ASSOCIAÇÃO BRASILEIRA DE NORMAS TÉCNICAS. NBR 6118: Projeto de Estruturas de Concreto, Rio de Janeiro, 2007.
[09] __________. NBR 5739: concreto – Ensaio de compressão de corpos-de-prova cilíndricos.
[10] __________. NBR 8522: Concreto - Determinação do módulo estático de elasticidade à compressão. Rio de Janeiro, 2008.
[11] __________. NBR 8802: Concreto endurecido – Determinação da velocidade de propagação de onda ultra-sônica - Método de ensaio. Rio de Janeiro, 1994. [12] AMERICAN SOCIETY FOR TESTING AND MATERIALS.
C1202. Standard test method for electrical indication of concrete´s ability to resist chloride ion penetration. ASTM 1202/2007.
[13] ASSOCIAÇÃO BRASILEIRA DE NORMAS TÉCNICAS. NBR NM 52: Agregado miúdo - Determinação da massa especíica e massa especíica aparente. Rio de Janeiro, 2009.
[14] __________. NBR NM 53: Agregado graúdo – Determinação da massa especíica, massa especíica aparente e absorção de água. Rio de Janeiro, 2009. [15] __________. NBR NM 45: Agregados – Determinação
da massa unitária e do volume de vazios. Rio de Janeiro, 2006.
[16] __________. NBR NM 248: agregados – Determinação da composição granulométrica. Rio de Janeiro, 2003. [17] __________. NBR 15900: Água para amassamento.
![Figure 1 – Flowchart of the Nan Su et al., [1] method](https://thumb-eu.123doks.com/thumbv2/123dok_br/18859940.417753/2.892.458.830.882.1132/figure-flowchart-nan-su-et-al-method.webp)
![Figure 2 – Flowchart of the Repette-Melo [2] method](https://thumb-eu.123doks.com/thumbv2/123dok_br/18859940.417753/4.892.456.829.920.1136/figure-flowchart-repette-melo-method.webp)