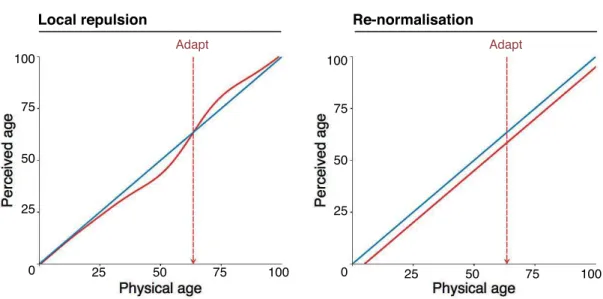
Facial Age Aftereffects Provide Some Evidence for Local Repulsion (But None for Re-Normalisation)
Texto
Imagem

Documentos relacionados
I anticipate that it will be very complicated the implementation due to the age group of people! The KPIs are well laid out functional, but to implement them effectively will be
Segundo Nogueira (2005) as empresas dependem impreterivelmente das pessoas para produzir seus produtos, atender bem sua clientela, competir no mercado de trabalho conseguindo
O tratamento não cirúrgico passa pelo desbridamento mecânico, que envolve a descontaminação supra e subgengival da superfície do implante (colarinho e pilar)
In this re- port the author did not mention the presence of Kayser- Fleicher’s ring but the age of disease onset (18 years of age), the progression to death after 4 years and
The FCER1B locus gives significant evidence of link- age and association, primarily but not exclusively with measures of atopy, but its effect has been controversial (Thomas
O seu desenvolvimento enquanto projecto foi condicionado pelo enquadramento específico desta horta, quer em termos territoriais, de propriedade e mesmo programáticos:
These findings provide additional objective evidence that in older adults, total sedentary time may not be the most important predictor for abdominal obesity but that
The false checks observed in 45.1 % of the stu- died chubs may be due to the small scale growth rates observed from August to October, which can be related with the Jack
