ACPD
9, 25323–25360, 2009Hygroscopicity parameter of ambient
organic aerosol
R. Y.-W. Chang et al.
Title Page
Abstract Introduction
Conclusions References
Tables Figures
◭ ◮
◭ ◮
Back Close
Full Screen / Esc
Printer-friendly Version
Interactive Discussion
Atmos. Chem. Phys. Discuss., 9, 25323–25360, 2009 www.atmos-chem-phys-discuss.net/9/25323/2009/ © Author(s) 2009. This work is distributed under the Creative Commons Attribution 3.0 License.
Atmospheric Chemistry and Physics Discussions
This discussion paper is/has been under review for the journal Atmospheric Chemistry and Physics (ACP). Please refer to the corresponding final paper in ACP if available.
The hygroscopicity parameter (
κ
) of
ambient organic aerosol at a field site
subject to biogenic and anthropogenic
influences: Relationship to degree of
aerosol oxidation
R. Y.-W. Chang1, J. G. Slowik1, N. C. Shantz1,*, A. Vlasenko1,*, J. Liggio2, S. J. Sjostedt1, W. R. Leaitch2, and J. P. D. Abbatt1
1
Department of Chemistry, University of Toronto, Toronto, Canada
2
Science and Technology Branch, Environment Canada, Downsview, Canada
*
now at: Science and Technology Branch, Environment Canada, Downsview, Canada
Received: 3 November 2009 – Accepted: 13 November 2009 – Published: 25 November 2009 Correspondence to: R. Y.-W. Chang (rchang@chem.utoronto.ca)
ACPD
9, 25323–25360, 2009Hygroscopicity parameter of ambient
organic aerosol
R. Y.-W. Chang et al.
Title Page
Abstract Introduction
Conclusions References
Tables Figures
◭ ◮
◭ ◮
Back Close
Full Screen / Esc
Printer-friendly Version
Interactive Discussion
Abstract
Cloud condensation nuclei (CCN) concentrations were measured at a rural site in On-tario, Canada during the spring of 2007. The CCN concentrations were compared to values predicted from the aerosol chemical composition and size distribution us-ingκ-K ¨ohler theory. The hygroscopicity of the organic component was characterised 5
by two methods, both of which are based on the aerosol’s degree of oxygenation as determined by the mass spectra measured with an Aerodyne aerosol mass spectrome-ter. The first approach uses a statistical technique, positive matrix factorization (PMF), to separate hygroscopic and non-hygroscopic factors while the second uses the O/C, which is an indication of the aerosol’s degree of oxygenation. In both cases, the hygro-10
scopicity parameter (κ) of the organic component is varied so that the predicted and measured CCN concentrations are internally consistent and in good agreement. By focussing on a small number of organic components defined by their composition, we can simplify the estimates needed to describe the aerosol’s hygroscopicity. We find thatκof the oxygenated organic component from the PMF analysis is 0.20±0.03 while
15
κof the entire organic component can be parameterized asκorg=(0.30±0.05)×(O/C).
1 Introduction
Aerosols can affect climate directly by scattering and absorbing incoming solar radia-tion, or indirectly by acting as cloud condensation nuclei (CCN), which form clouds and in turn can reflect light (Twomey, 1977). The efficiency of aerosols as CCN also affects 20
both aerosol particle and cloud droplet lifetimes (Albrecht, 1989). It is well recognized that these effects represent one of the largest uncertainties in assessing the changes in radiative forcing from pre-industrial times to the present (IPCC, 2007). As such, understanding the hygroscopic properties of aerosols and the processes that govern cloud droplet activation are important.
ACPD
9, 25323–25360, 2009Hygroscopicity parameter of ambient
organic aerosol
R. Y.-W. Chang et al.
Title Page
Abstract Introduction
Conclusions References
Tables Figures
◭ ◮
◭ ◮
Back Close
Full Screen / Esc
Printer-friendly Version
Interactive Discussion
K ¨ohler theory has been used to predict the CCN-activity of inorganic compounds for many years (K ¨ohler, 1936). In the last decade, the focus has turned to the prediction of the CCN-activity of organic compounds in atmospheric particles. Laboratory studies have shown that the CCN-activity of organic, inorganic, or mixed aerosol systems can be predicted as long as the composition of the particles is well-characterised and their 5
properties known (Abbatt et al., 2005; Bilde and Svenningsson, 2004; Broekhuizen et al., 2004a; Raymond and Pandis, 2002, 2003). However, ambient aerosols are com-posed of numerous organic compounds that are difficult to identify and quantify (Jacob-son et al., 2000; Saxena and Hildemann, 1996), therefore complicating the prediction of the CCN-activity of those ambient particles. The organic fraction comprises a signifi-10
cant fraction of the aerosol at many locations in the Northern Hemisphere (Zhang et al., 2007), highlighting the need to study organic aerosol hygroscopicity. In this study, we test our ability to predict the CCN-activity of ambient aerosols at a continental site by conducting an aerosol-CCN closure study, in which we compare CCN concentrations measured using a CCN counter with those predicted using modified K ¨ohler theory. We 15
then vary the hygroscopicity of the organic aerosol component in the model to obtain the best degree of closure.
Two unique strategies are used in this paper to simplify the experimental approach to studying this aerosol property. These strategies reflect recent major developments in the aerosol field. First, field observations of the organic aerosol made by an Aerodyne 20
aerosol mass spectrometer (AMS) are characterised by the degree of oxygenation. Of late, this has been accomplished by factor analysis techniques (Zhang et al., 2005, 2007) including, more recently, positive matrix factorization (PMF) (Lanz et al., 2007; Ulbrich et al., 2009). Here aerosol mass spectra, which contain signal from hundreds if not thousands of organic molecules, are described as a linear combination of a few 25
ACPD
9, 25323–25360, 2009Hygroscopicity parameter of ambient
organic aerosol
R. Y.-W. Chang et al.
Title Page
Abstract Introduction
Conclusions References
Tables Figures
◭ ◮
◭ ◮
Back Close
Full Screen / Esc
Printer-friendly Version
Interactive Discussion
fractions found in some global models (Chung and Seinfeld, 2002; Cooke and Wilson, 1996; Lohmann et al., 1999). A combination of AMS measurements (Zhang et al., 2007) and the subsequent application of PMF (Ulbrich et al., 2009) is now a common approach used in the organic aerosol community. This study also uses the O/C to directly determine the aerosol’s degree of oxygenation.
5
The second simplifying advance that we take advantage of is to describe the or-ganic hygroscopicity using theκ-K ¨ohler method (Petters and Kreidenweis, 2007, 2008). Specifically, this expression of the K ¨ohler model groups the properties of each com-pound present in the aerosol that affects its hygroscopicity into a single variable, κ. Thus, knowledge of the individual molecular solubilities, surface tension properties and 10
molecular weights, which are largely unknown in ambient aerosol, is obviated. And so, the overall goal of this work is to determine the hygroscopic properties, expressed as theκparameter, for the small number of PMF factors that can now be used to describe organic aerosol composition, as well as in relation to the degree of oxygenation as determined from the O/C.
15
An extensive review of early aerosol-CCN closure studies that had limited information about the organic component of the aerosol can be found in Broekhuizen et al. (2006). However, with the recent widespread use of the AMS and following the initial study of Broekhuizen et al. (2006), a few closure studies have since been conducted in which the aerosol chemical composition is highly time resolved and the organic fraction quan-20
tified. These studies from the field achieved closure by determining the hygroscopicity of either the entire aerosol by assuming an average chemical composition in continen-tal China (Rose et al., 2008), or the entire organic component by assuming that the hygroscopicity in the organic component was constant at rural locations (Chang et al., 2007; Medina et al., 2007; Stroud et al., 2007), in the Amazon (Gunthe et al., 2009; 25
ACPD
9, 25323–25360, 2009Hygroscopicity parameter of ambient
organic aerosol
R. Y.-W. Chang et al.
Title Page
Abstract Introduction
Conclusions References
Tables Figures
◭ ◮
◭ ◮
Back Close
Full Screen / Esc
Printer-friendly Version
Interactive Discussion
et al., 2006; Cubison et al., 2008; Quinn et al., 2008), although this can also be true for remote locations (Ervens et al., 2007). Here we provide the first characterisation of varying hygroscopicity of the organic component based on its degree of oxygenation. This study builds on the results from previous closure studies conducted in our group at urban and rural sites (Broekhuizen et al., 2006; Chang et al., 2007).
5
2 Experimental method
The Egbert 2007 study took place between 14 May and 15 June 2007, at Environ-ment Canada’s Centre for Atmospheric Research and ExperiEnviron-ment (CARE). This rural site, situated at Egbert, Ontario, Canada (44.23 N, 79.78 W, 251 m above sea level), is approximately 70 km north of Toronto, is surrounded by farmland, and experiences 10
relatively minimal influences from local sources. The actual sampling location is 125 m from the main CARE building and the nearest road, 75 m away, is used by only a few ve-hicles per hour. The site is often impacted by polluted urban outflow from the populated and industrialized regions of Southwestern Ontario and mid-western United States, as well as cleaner continental air from the north (Rupakheti et al., 2005).
15
The main goal of Egbert 2007 was to improve our understanding of the sources and hygroscopicity of organic aerosols. To this end, recent publications from this cam-paign have shown that the oxidation state of the aerosol correlates with the photo-chemical age of the air (Vlasenko et al., 2009), significant secondary organic aerosol mass can be formed from monoterpene oxidation (Slowik et al., 2009a), oxygenated 20
organic aerosols from anthropogenically-influenced air could have primary and sec-ondary sources, while biogenically-influenced air only had secsec-ondary sources (Chan et al., 2009), and aerosols from anthropogenically-influenced air showed a delay in cloud droplet activation compared to biogenically-influenced air (Shantz et al., 2009). The present study focusses on the hygroscopicity of the organic component of the 25
ACPD
9, 25323–25360, 2009Hygroscopicity parameter of ambient
organic aerosol
R. Y.-W. Chang et al.
Title Page
Abstract Introduction
Conclusions References
Tables Figures
◭ ◮
◭ ◮
Back Close
Full Screen / Esc
Printer-friendly Version
Interactive Discussion
source of air sampled at CARE. A wide variety of instruments were deployed during the study, but only those of direct relevance to this analysis are described here.
2.1 Scanning mobility particle sizer
A scanning mobility particle sizer (SMPS, TSI 3071, 3081, 3080) measured aerosol size distributions between 10 nm and 420 nm in diameter every 15 min with a sample to 5
sheath flow ratio of 1:6, where the sheath flow was dried with silica gel. All instruments sampled from the roof of the building, with intakes ≈5.5 m above ground. The main
inlet was a PVC pipe (0.2 m inner diameter), lined with aluminium tape to decrease electrostatic deposition, where the residence time was ≈1 min. The SMPS sampled
from the centre line of the main inlet in stainless steel tubing with a residence time of 10
the secondary lines of≈1 s.
2.2 CCN counter
The CCN concentration was measured at a constant supersaturation using a parallel-plate continuous flow thermal gradient diffusion chamber that was previously used in a closure study at the same site (Chang et al., 2007). This instrument, built at the Univer-15
sity of Toronto, is a more portable and automated version of the design described by Pradeep Kumar et al. (2003). It consists of two parallel aluminium plates held at diff er-ent temperatures, which results in a supersaturation forming at the cer-entre of the cham-ber (Saxena et al., 1970). A sheath flow (1.8 L min−1) keeps the sample aerosol flow (0.2 L min−1) at the centre of the chamber such that particles that are CCN-active at that 20
ACPD
9, 25323–25360, 2009Hygroscopicity parameter of ambient
organic aerosol
R. Y.-W. Chang et al.
Title Page
Abstract Introduction
Conclusions References
Tables Figures
◭ ◮
◭ ◮
Back Close
Full Screen / Esc
Printer-friendly Version
Interactive Discussion
residence time to vary from 9 to 21 s. For most of this study, the residence time of the chamber was 19 s where the highest concentration of CCN was measured.
The CCN counter was calibrated four times throughout the study using monodis-perse ammonium sulphate particles to determine the size at which 50% of the aerosols activated. Based on these calibrations, the effective supersaturation in the chamber 5
was determined to be 0.42±0.03%. This instrument also sampled from the main inlet
with a residence time in its secondary line of<6 s.
2.3 Proton-transfer-reaction mass spectrometer
Volatile organic compounds (VOCs) were measured using a proton-transfer-reaction mass spectrometer (PTR-MS, Ionicon Analytik). The details of this method and its 10
application to ambient air sampling have been described elsewhere (de Gouw and Warneke, 2007). A description of the instrument performance during this particular study can be found in Vlasenko et al. (2009). In brief, ambient air was sampled at 4.4 L min−1 through a 7.5 m long PFA tube with 0.48 cm inner diameter whose inlet was 2 m from the main aerosol inlet. The PTR-MS sampled 0.2 L min−1from the main
15
flow through a heated 0.2 cm outer diameter silocosteel line. Protonated VOC species were recorded in scanning mode fromm/z 21 to 160 on a 140 s time interval. The sys-tem was calibrated by standard addition using commercial custom-made gas mixtures (Apel-Riemer Inc. and Scott Specialty Gases). In addition, background measurements were made by installing a charcoal cartridge (Supelco) upstream of the PTR-MS inlet 20
line.
2.4 Aerosol mass spectrometers
A time-of-flight aerosol mass spectrometer (C-ToF AMS, Aerodyne) measured the aerosol chemical composition that was non-refractory at 870 K and 10−7torr. The op-eration of the AMS has been described elsewhere (Drewnick et al., 2005; Jayne et al., 25
ACPD
9, 25323–25360, 2009Hygroscopicity parameter of ambient
organic aerosol
R. Y.-W. Chang et al.
Title Page
Abstract Introduction
Conclusions References
Tables Figures
◭ ◮
◭ ◮
Back Close
Full Screen / Esc
Printer-friendly Version
Interactive Discussion
is described by Slowik et al. (2009a). This AMS sampled offa separate stainless steel and copper inlet≈3 m from the main inlet with a residence time of ≈15 s. AMS mass
concentration measurements are complicated by uncertainties in collection efficiency due to the possibility of particle bounce at the vaporizer surface. However, this does not affect the analysis below, which only uses the fractional composition and assumes 5
an internally mixed particle ensemble.
The PMF receptor modelling technique uses multivariate statistical methods to rep-resent an input data matrix as a linear combination of a set of factor profiles (mass spectra, for AMS data) and their time-dependent intensities (Paatero, 1997; Paatero and Tapper, 1994). Application of PMF to AMS datasets have previously been dis-10
cussed (Lanz et al., 2007; Slowik et al., 2009b; Ulbrich et al., 2009; Allan et al., 2009), as has the PMF analysis for the present study (Slowik et al., 2009a). In the present study, four factors were resolved for the organic component: a hydrocarbon-like organic aerosol (HOA) component correlating with tracers for primary anthropogenic emis-sions (e.g. NOxand benzene); a biomass burning organic aerosol (BBOA) component; 15
and two oxygenated organic aerosol components (OOA-1, OOA-2), where OOA-1 is more oxygenated than OOA-2. OOA-1 correlates with tracers for long-range transport (e.g. particulate sulphate), while OOA-2 correlates with VOCs measured by the PTR-MS atm/z 71 (ion C4H6OH+) which is thought to arise from products of photochemistry (e.g. methacrolein and methyl vinyl ketone). The reader is directed to the publication by 20
Slowik et al. (2009a) for further detailed information on the PMF solution. The impor-tant point for the current analysis is the differentiation between the oxygenated (OOA and BBOA) and unoxygenated (HOA) components of the organic aerosol.
A high-resolution time-of-flight AMS (HR-ToF AMS) was also deployed at the site. The mass resolution of the W-ToF AMS, (3000–5000), means that fragments of nom-25
ACPD
9, 25323–25360, 2009Hygroscopicity parameter of ambient
organic aerosol
R. Y.-W. Chang et al.
Title Page
Abstract Introduction
Conclusions References
Tables Figures
◭ ◮
◭ ◮
Back Close
Full Screen / Esc
Printer-friendly Version
Interactive Discussion
for ambient aerosols using an AMS is not well established, it can be used as a tracer for atmospheric oxidation. High resolution data analysis for this study was completed using a custom algorithm, which incorporated a peak fitting procedure, typical AMS correction factors and a correction for the O/C as suggested by Aiken et al. (2008) to account for discrepancies between AMS derived O/C and that derived from laboratory 5
standards. While the subsequent calculations and results are from the C-ToF AMS, they will be compared with O/C results from the HR-ToF AMS in Sect. 4.2.
3 Methodology for determining the hygroscopicity parameter
Data were averaged into 15 min intervals and using the chemical composition mea-sured by the C-ToF AMS, the activation diameter for a dry particle at the supersatura-10
tion of the CCN chamber (0.42%) was calculated usingκ-K ¨ohler theory (Petters and Kreidenweis, 2007, 2008), where K ¨ohler curves were generated for increasing particle sizes until the critical supersaturation of the initial dry particle was less than or equal to the supersaturation of the CCN counter. The aerosol size distribution, as measured by the SMPS, was then integrated for all dry particle sizes greater than the activation 15
diameter to arrive at the predicted CCN concentration. The hygroscopicity parameter of the aerosol’s organic component (κorg) was then iteratively varied (changing the ac-tivation diameter and thus the predicted CCN concentrations) to yield predicted CCN concentrations consistent with those measured by the CCN counter. The rest of this section describes in detail how the activation diameter was calculated and the assump-20
tions made in order to determineκorg.
κ-K ¨ohler theory (Petters and Kreidenweis, 2007, 2008) simplifies the K ¨ohler equation by combining all the compound-specific variables (e.g. molecular weight, density, van’t Hofffactor) into a single parameterκ, as shown in Eq. 1:
S= D
3
−D3i
D3−D3
i(1−κ)
exp
4σM
w
ρwRTD
, (1)
ACPD
9, 25323–25360, 2009Hygroscopicity parameter of ambient
organic aerosol
R. Y.-W. Chang et al.
Title Page
Abstract Introduction
Conclusions References
Tables Figures
◭ ◮
◭ ◮
Back Close
Full Screen / Esc
Printer-friendly Version
Interactive Discussion
whereDandDi are the droplet wet diameter and initial dry diameter, respectively,σis the droplet surface tension (0.072 N m−2 initially),Mw is the molecular weight of water,
ρw is the density of water,R is the universal gas constant andT is the temperature. In
this equation, the overallκof the aerosol is calculated as the volume-weighted average of theκ of the components, which assumes that the total volume of the water content 5
can be calculated by adding the water contents of the individual components (Petters and Kreidenweis, 2007), i.e.
κ=X i
εiκi, (2)
whereεi andκi are the volume fraction andκof theithcomponents of the aerosol. For a soluble compound,κi can be calculated as:
10
κi=
iiρiMw ρwMi
, (3)
whereii,ρi, andMi are the van’t Hofffactor, density and molecular weight, respectively, of the compound.
Measurements of ammonium, nitrate and sulphate from the AMS were grouped to-gether and assumed to behave as ammonium sulphate, with aκof 0.61 and density of 15
1770 kg m−3(Petters and Kreidenweis, 2007; Windholz, 1983). The errors associated with this assumption are not large since the aerosol was not acidic during the study and the κ and density of ammonium nitrate are 0.67 and 1730 kg m−3, respectively, which are close to the values for ammonium sulphate. In this analysis, the bulk aerosol mass spectrum was used, which means that the aerosol is assumed to be internally 20
mixed with a constant chemical composition and degree of oxygenation at all sizes. These assumptions are justified by the lack of local sources, and the observation that the aerosol mass distribution, in both the SMPS and AMS, was mostly unimodal with little mass at particle sizes less than 70 nm, the upper bound of the typical activation diameter, suggesting that the sampled aerosols were well processed and hence inter-25
ACPD
9, 25323–25360, 2009Hygroscopicity parameter of ambient
organic aerosol
R. Y.-W. Chang et al.
Title Page
Abstract Introduction
Conclusions References
Tables Figures
◭ ◮
◭ ◮
Back Close
Full Screen / Esc
Printer-friendly Version
Interactive Discussion
in Sect. 4.3 and the contribution of mineral dust to the aerosol submicron fraction is considered negligible at this site.
There are numerous approaches in representingκorg. However, in this analysis we will focus on two methods, both of which are based on the degree of oxygenation of the organic component as determined from AMS measurements. We generally assume 5
that a more oxygenated organic aerosol is more polar and therefore more soluble and hygroscopic than a less oxygenated organic aerosol. This is supported by laboratory studies that have found that oleic acid aerosols that have undergone ozonolysis have significantly increased CCN-activity (Broekhuizen et al., 2004b; Shilling et al., 2007), chamber studies that show that aging secondary organic aerosols can also increase 10
their CCN-activity (Duplissy et al., 2008; Petters et al., 2006), and ambient observa-tions that have found air masses with more OOA-rich aerosols to be more hygroscopic (McFiggans et al., 2005). In contrast, the more hydrocarbon-like component of the aerosol is non-polar and therefore less hygroscopic. Thus, there is an expectation that the degree of oxygenation will dictate the aerosol’s hygroscopicity.
15
The first approach to representingκuses the factors from the PMF analysis grouped into two components: a non-hygroscopic, unoxygenated component consisting of the HOA factor, whose κ (κunox) is approximated by 0, and a hygroscopic component, consisting of the oxygenated factors OOA-1, OOA-2 and BBOA. This oxygenated com-ponent is assumed to have a single hygroscopicity, with aκ (κox) that was varied until 20
the predicted CCN number concentrations were in good agreement with the measured concentrations (the criteria for this will be described in Sect. 4.1.1). The oxygenated factors were grouped together because our model was not sensitive enough to eluci-date separate hygroscopicities for each factor. In this approach, Eq. 2 can be rewritten as:
25
κorg=εox×κox+εunox×κunox=εox×κox, (4)
ACPD
9, 25323–25360, 2009Hygroscopicity parameter of ambient
organic aerosol
R. Y.-W. Chang et al.
Title Page
Abstract Introduction
Conclusions References
Tables Figures
◭ ◮
◭ ◮
Back Close
Full Screen / Esc
Printer-friendly Version
Interactive Discussion
density is calculated assuming a density for ammonium, nitrate, sulphate, and organic of 1760, 1730, 1770 and 1200 kg m−3
, respectively.
The second approach assumes a direct relationship between the organic aerosol’s degree of oxygenation and its hygroscopicity. The simplest relationship is a linear one, so that
5
κorg=a×(O/C), (5)
where O/C, the mole ratio of atomic oxygen to atomic carbon, is a measurement of the organic aerosol’s degree of oxygenation and can be estimated from the fraction of the total organic signal occurring atm/z 44 measured by the C-ToF AMS, as described by Aiken et al. (2008). In Eq. 5, a is the value of κorg when the O/C is one and is 10
varied until the predicted CCN concentrations are in good agreement with measured concentrations. This relationship between the organic aerosol’s O/C and hygroscopicity may not be linear and more complicated relationships between the two quantities will exist that may be more accurate, but for the purposes of this initial attempt, we start with the simplest functionality.
15
Using either approach, κ for the entire aerosol can be calculated from Eq. 2 com-bined with either Eq. 4 or Eq. 5, and then the activation diameter calculated from Eq. 1 for the supersaturation of the CCN counter (0.42%).
4 Results and discussion
4.1 Calculations using PMF factors 20
4.1.1 Results from the entire study
ACPD
9, 25323–25360, 2009Hygroscopicity parameter of ambient
organic aerosol
R. Y.-W. Chang et al.
Title Page
Abstract Introduction
Conclusions References
Tables Figures
◭ ◮
◭ ◮
Back Close
Full Screen / Esc
Printer-friendly Version
Interactive Discussion
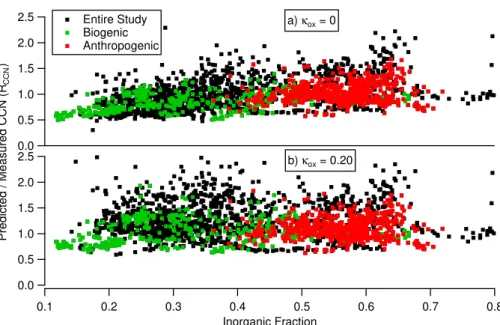
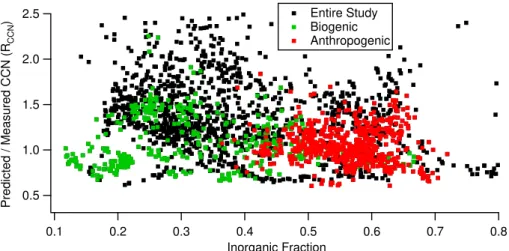
hygroscopicity of the organic fraction becomes unimportant in assessing the overall hygroscopicity of the particle. As such, the ratio of CCN concentrations predicted us-ing theκ-K ¨ohler model to CCN concentrations measured with the CCN counter (RCCN) for the entire study is plotted as a function of aerosol inorganic fraction in Fig. 1. Fig-ure 1a shows thatRCCN is dependent on composition when the organic component is 5
assumed to be non-hygroscopic (i.e. κunox=κox=0), with the organic-rich data points being underpredicted (RCCN=0.892±0.008) compared to the inorganic-rich data points (1.14±0.01), where the uncertainty given is the standard error.
Allowing the oxygenated OOA and BBOA components to be hygroscopic with aκoxof 0.20 (Fig. 1b) reduces the difference between the meanRCCN of the organic-rich data 10
points and the inorganic-rich data points (mean RCCN are 1.23±0.01 and 1.22±0.01, respectively). For a K ¨ohler model that predicts with a consistent accuracy for all chem-ical composition,RCCNshould be independent of composition. If the meanRCCNof the organic-rich data points is lower than that of the inorganic-rich data points, then the hygroscopicity of the organic component needs to be increased untilRCCNis indepen-15
dent of composition by increasingκox. Conversely, if the meanRCCN is higher for the organic-rich data points, thenκox is too high and needs to be decreased.
In order to assess this systematically, the data points were split into two equal pop-ulations based on the magnitude of their inorganic fraction and their meanRCCN was then compared. κox for the entire data set was varied until the means of the two halves 20
were no longer significantly different (two-tailed t-test, unequal variances, significance level of p<0.05). Since aerosols with a high inorganic fraction are less sensitive to changes in the hygroscopicity of the aerosol’s organic component (see Broekhuizen et al., 2006; Chang et al., 2007), the mean of the more inorganic half of the population was used as a reference. Using this method,κox for the entire study was found to be 25
0.20±0.03.
ACPD
9, 25323–25360, 2009Hygroscopicity parameter of ambient
organic aerosol
R. Y.-W. Chang et al.
Title Page
Abstract Introduction
Conclusions References
Tables Figures
◭ ◮
◭ ◮
Back Close
Full Screen / Esc
Printer-friendly Version
Interactive Discussion
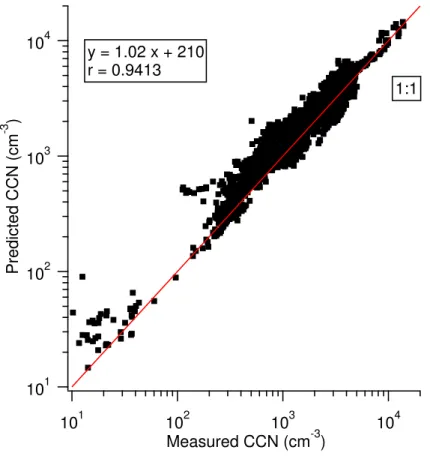
errors in the sizing of the SMPS and counting errors in both systems, as well as un-certainties in model assumptions, such as mixing state, particle sphericity, density, etc. As such, the criterion for the best value ofκox is a consistent RCCN, whether over or underpredicted, regardless of composition. Although the overprediction from this cal-culation is approximately 20%, a linear regression of the predicted and measured CCN 5
concentrations results in a slope of 1.02 (see Fig. 2), which suggests that the model is appropriate and is comparable to other field studies (Broekhuizen et al., 2006; Chang et al., 2007; Medina et al., 2007; Wang et al., 2008).
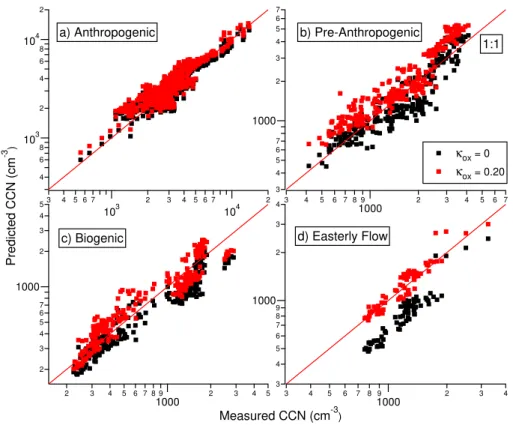
4.1.2 Results from select time periods
Because local sources were not prominent during the study, it was possible to charac-10
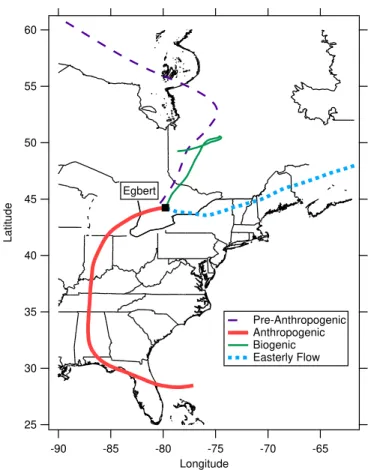
terise regional air masses during which the organic aerosol composition was assumed to be more uniform. From this analysis, we can assess the uncertainty that arises from assuming that the organic components have the same hygroscopicity regardless of source. The study was broken down into four air regimes based on aerosol chemical composition, the characteristics of the organic component (based on the PMF factors), 15
local wind direction and wind speed, the photochemical age of the air from the ratio of toluene to benzene (de Gouw et al., 2005; Roberts et al., 1984), and back trajec-tories. The four periods are described below and illustrated in Fig. 3 with typical back trajectories calculated using HYSPLIT (Draxler and Rolph, 2003; Rolph, 2003) shown in Fig. 4. All dates and times are local, eastern daylight savings time.
20
1. For this study, periods of high anthropogenic influence were characterised by both high sulphate and organic aerosol mass loading. The toluene/benzene was often high, suggesting a shorter photochemical age, and back trajectories show that the air masses originated from populated regions to the south (the red trace in Fig. 4). These periods are referred to as “Anthropogenic”, while recognizing that 25
ACPD
9, 25323–25360, 2009Hygroscopicity parameter of ambient
organic aerosol
R. Y.-W. Chang et al.
Title Page
Abstract Introduction
Conclusions References
Tables Figures
◭ ◮
◭ ◮
Back Close
Full Screen / Esc
Printer-friendly Version
Interactive Discussion
2. Two of the Anthropogenic periods were preceded by times when the local winds were from the southeast and the aerosol was mostly organic (specifically high HOA and 1, as opposed to the Anthropogenic period which had more OOA-2) with very little sulphate. The back trajectories, however, tended to be from the northwest to northeast, suggesting that these air masses did not originate from 5
highly populated or polluted regions (purple trace in Fig. 4). However, because the toluene/benzene was high (suggesting that the photochemical age was short), it would appear that the aerosols during these times were from clean continental air but were influenced by more local anthropogenic sources (e.g. a highway 10 km to the east). These periods are referred to as “Pre-Anthropogenic”.
10
3. Continental air, characterised by low sulphate loadings, a low toluene/benzene (suggesting enhanced photochemical processing) and higher organic mass frac-tions, was associated with trajectories from the mostly forested north (green trace in Fig. 4). The earlier episode (19–21 May) was colder and expectedly less influenced by biogenics whereas the episode near the end of the study (8– 15
13 June) was characterised by warmer temperatures and high organic mass load-ings mostly from biogenic sources (Slowik et al., 2009a). These periods are re-ferred to as “Biogenic” for this analysis. Measurements during the second bio-genic period were interrupted by a failure in the CCN counter, as well as a period (11 June, 18:15–12 June, 18:30) during which the air was elevated in SO2 and 20
particulate sulphate concentrations. The majority of the sulphur in the latter case is suspected to have originated from smelters in the Sudbury region based on the back trajectories (not shown); such an observation at Egbert is not uncommon (Rupakheti et al., 2005).
4. At the end of the study, after the second Biogenic period, the winds shifted from 25
ACPD
9, 25323–25360, 2009Hygroscopicity parameter of ambient
organic aerosol
R. Y.-W. Chang et al.
Title Page
Abstract Introduction
Conclusions References
Tables Figures
◭ ◮
◭ ◮
Back Close
Full Screen / Esc
Printer-friendly Version
Interactive Discussion
different from the Biogenic period. This period will be referred to as “Easterly Flow”.
The composition of the aerosol during the Anthropogenic period was dominated by the inorganic fraction, which in turn, dominates the hygroscopicity of the entire aerosol. This means that these aerosols are much less sensitive to changes in the hygroscop-5
icity of the organic component (Chang et al., 2007). This can be seen in Fig. 1, which shows thatRCCNfor the Anthropogenic period (in red) is dominated by inorganics and is less sensitive to an increase inκox compared to the Biogenic period (in green). As such, the meanRCCN of the Anthropogenic period was used as a reference, and, in an approach similar to that described in the previous section, it was compared to the 10
meanRCCNof the other time periods asκoxwas varied. The final value ofκoxfor a time period was determined when its meanRCCN was no longer significantly different than that of the Anthropogenic period (two-tailed t-test, unequal variances, significance level ofp<0.05) with the sameκox. Table 1 showsκoxfound for the different time periods and the uncertainties denote when the means of the two populations became significantly 15
different.
For the Biogenic and Easterly Flow times, κox are the same, suggesting that the hygroscopicity of the organic component can be characterised in the same manner. They are also similar to the value of 0.20 that was found from the earlier analysis for the whole study period. However, the Pre-Anthropogenic period had a lowerκox than the 20
rest of the study, suggesting that during this time, the oxygenated components are not contributing significantly to the hygroscopicity of the aerosol. At this point we can only suggest reasons why this behaviour was observed. In particular, noting that the HOA component of the aerosol is high, it is possible that the HOA plays a role in suppressing CCN-activity, perhaps through an effect on the mass accommodation coefficient for 25
water uptake, similar to the observations by Shantz et al. (2009). However, this is only speculation and we have no firm evidence that this is the case.
ACPD
9, 25323–25360, 2009Hygroscopicity parameter of ambient
organic aerosol
R. Y.-W. Chang et al.
Title Page
Abstract Introduction
Conclusions References
Tables Figures
◭ ◮
◭ ◮
Back Close
Full Screen / Esc
Printer-friendly Version
Interactive Discussion
we see that during the Anthropogenic time (Fig. 5a), the predicted CCN concentrations do not change significantly compared to the Biogenic and Easterly Flow times (Fig. 5c and d), as well as the Pre-Anthropogenic time, which is even overpredicted (Fig. 5b).
4.2 Results from the entire study using O/C
A similar analysis to that described in Sect. 4.1.1 was performed on the entire data set 5
by dividing the population into two equal populations based on the inorganic fraction and comparing theirRCCN. However,κorgwas calculated from the O/C using Eq. 5, and not the PMF factors derived from the AMS spectra. By varying the value ofκorg for an organic component with an O/C of one (ain Eq. 5), the relationship
κorg=(0.30±0.05)×(O/C) (6) 10
was found to give an internally consistent result, where the uncertainties are values for which the means of the two halves of the population are not significantly different (two-tailed t-test, unequal variances, significance level ofp<0.05). As mentioned previously, the O/C was estimated from the fraction of the organic signal atm/z 44, directly from the C-ToF AMS mass spectra, which, on average, is 6% higher than that calculated 15
from the HR-ToF AMS. The grey trace in the top panel of Fig. 3 shows the time series for κorg calculated using the PMF factors, assuming κox=0.2 and κunox=0, while the black and red traces are from Eq. 6, using O/C estimated from the C-ToF and HR-ToF AMSs, respectively. We see that all three estimates ofκorg yield similar results. This is not completely unexpected since both the PMF and O/C approaches incorporate the 20
degree of oxygenation of the organic component calculated using different analyses. In essence, this shows that the O/C of the entire aerosol can be reasonably expressed as a linear combination of the O/C of the PMF factors.
Putting the results from the O/C analysis into context with those obtained from the PMF factors, Table 2 showsκcalculated for the PMF factors from their O/C using Eq. 6. 25
ACPD
9, 25323–25360, 2009Hygroscopicity parameter of ambient
organic aerosol
R. Y.-W. Chang et al.
Title Page
Abstract Introduction
Conclusions References
Tables Figures
◭ ◮
◭ ◮
Back Close
Full Screen / Esc
Printer-friendly Version
Interactive Discussion
is reasonable. The BBOA κ, 0.05, is low compared to that of the biomass burning marker levoglucosan (κ=0.21, Petters and Kreidenweis, 2007), suggesting that there are components to the BBOA that are not as hygroscopic as levoglucosan. This is supported by the biomass burning experiments performed by (Petters et al., 2009), in which the lower limit that was measured (κ=0.05) is thought to be representative of the 5
organic component in their experiments.
The advantage of the described method is thatκorg is calculated from the degree of oxygenation of the organic component of the aerosol as deduced from aerosol mass spectra and does not depend on the PMF analysis, which involves a stage of statisti-cal analysis. It is unclear whether this approach can be generalized to other aerosol 10
types as the range in the O/C for this study was limited to 0.3 to 0.6. As such, further analysis of ambient aerosols with a wider range of oxygenation should be studied in or-der to determine whether this simple relationship between hygroscopicity and aerosol oxygenation can be applied widely.
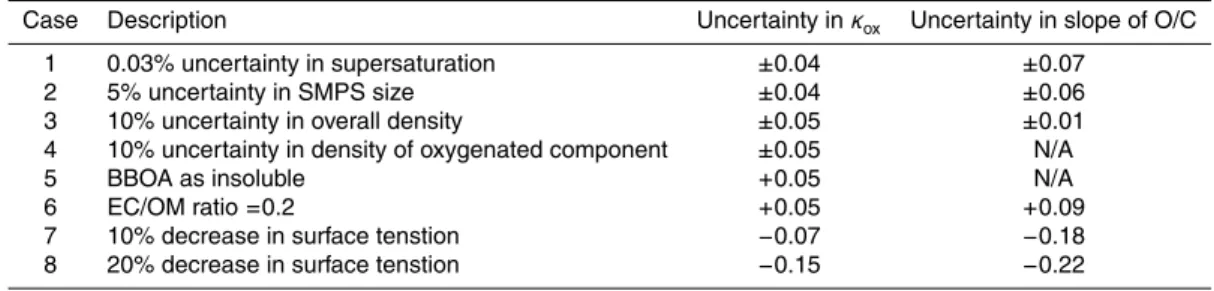
4.3 Uncertainties 15
Table 3 shows the sensitivity of our results to different uncertainties. Systematic uncer-tainties in the chamber supersaturation (±0.03% supersaturation, Case 1) and SMPS
diameter sizing (±5%, Case 2) are quantified for both calculation methods in Table 3.
Other uncertainties pertain to the aerosol chemical composition and attempts to quan-tify uncertainties in the overall aerosol density (Case 3) as well as the density of the 20
oxygenated component (Case 4), both of which affect the calculation of the volume fraction in Eq. 4. If the BBOA component is considered as insoluble (Case 5), the re-sults forκoxare 0.05 higher. Results from Chan et al. (2009) for Egbert 2007 found that the ratio of elemental carbon to organic matter (EC/OM) for the study was 0.2 except for the final Biogenic period, during which it decreased to 0.15. Case 6 considers the 25
ACPD
9, 25323–25360, 2009Hygroscopicity parameter of ambient
organic aerosol
R. Y.-W. Chang et al.
Title Page
Abstract Introduction
Conclusions References
Tables Figures
◭ ◮
◭ ◮
Back Close
Full Screen / Esc
Printer-friendly Version
Interactive Discussion
of the results to a decrease in the surface tension of the droplet by 10% and 20%, respectively, which has the greatest effect on the predicted values.
With the exception of surface tension lowering effects, the uncertainties are indi-vidually similar to the uncertainty determined statistically for κox and a, although the cumulative effects of multiple cases occuring at once are not quantified. Reductions in 5
the droplet surface tension result in the greatest uncertainty since they affect the ex-ponential term in Eq. 1. However, theκ-K ¨ohler model usually uses the surface tension of water and κ is varied to account for aerosol properties (Petters and Kreidenweis, 2007). As such, the uncertainties in Cases 7 and 8 are presented to gain general understanding in the sensitivity of our results.
10
4.4 Comparison with literature values
For a theoretical compound that has a van’t Hoff factor of one, a molecular weight of 150 g mol−1 and a density of 1500 kg m−3,κ is calculated to be 0.18 from Eq. 3. This is consistent with the 0.2 calculated forκox, suggesting that its hygroscopicity could be explained by these reasonable assumptions in physical properties.
15
Studies of secondary organic aerosols (SOA) formed in smog chambers with monoterpene VOC precursors have measured theκ of the entire aerosol to be in the range of 0.04–0.14 (Duplissy et al., 2008; Engelhart et al., 2008; Prenni et al., 2007; Wex et al., 2009) as compared to the values of roughly 0.2 for the OOA factors mea-sured in this study. However, chamber-generated aerosols are typically less oxidized 20
than the OOA components of ambient aerosols (in particular, the OOA-1 component) in part due to higher precursor concentrations, perhaps arising from increased particle-phase partitioning of the more volatile, less oxygenated and hygroscopic components that can arise at high mass loadings frequently used in chamber experiments (Du-plissy et al., 2008; Kostenidou et al., 2009; Shilling et al., 2009). The difference could 25
ACPD
9, 25323–25360, 2009Hygroscopicity parameter of ambient
organic aerosol
R. Y.-W. Chang et al.
Title Page
Abstract Introduction
Conclusions References
Tables Figures
◭ ◮
◭ ◮
Back Close
Full Screen / Esc
Printer-friendly Version
Interactive Discussion
oxygenated aerosol, i.e. it may have some saturated hydrocarbon functional groups that lower its hygroscopicity. As such, it is not surprising that the ambient data are somewhat more hygroscopic than the results from the chamber studies.
For example, and to be more specific, in an OH oxidation study performed by Du-plissy et al. (2008), κ for the entire aerosol was found to be 0.12 for initial precursor 5
concentrations of 10 ppb forα-pinene and 3.8 ppbv NOx. The fraction of the organic signal atm/z 44 was approximately 0.12, which would result in aκ of 0.16, calculated using Eq. 6. Similarly, in an ozonolysis study ofα-pinene by George (2009), the ratio ofm/z 44 to total organic ranged from 0.046 to 0.069, corresponding to a range ofκfor the entire aerosol from 0.08 to 0.1. In all cases, the resultingκfor the entire aerosol is 10
consistently lower than the 0.2 found for the OOA components in this study, where the
m/z 44 to total organic fraction was 0.10 to 0.19.
Other studies that have attempted to quantifyκorgin the field found that using a value of 0.1 can adequately describe the CCN-activity of the aerosol at cloud-level (Wang et al., 2008) and in the Amazon rainforest (Gunthe et al., 2009). This is comparable to 15
the campaign-wide average for this study of 0.14 forκorg, calculated using both Eqs. 4 and 6.
Others have simplified aerosol hygroscopicity even further by using a single κ for the whole aerosol over an entire study. If we do this, we find that the average κ
of 0.30 is consistent with the 0.3 value that was found in continental China (Rose 20
et al., 2008). However, we find that if we apply this constant κ to all data, we signif-icantly overpredict CCN numbers when the aerosol is dominated by the organic-rich fraction (RCCN=1.37±0.01) compared to times when the aerosol is mostly inorganic (RCCN=1.14±0.01) (Fig. 6). This indicates that more chemical information is needed in order to accurately predict the CCN-activity of ambient aerosols, as opposed to the 25
ACPD
9, 25323–25360, 2009Hygroscopicity parameter of ambient
organic aerosol
R. Y.-W. Chang et al.
Title Page
Abstract Introduction
Conclusions References
Tables Figures
◭ ◮
◭ ◮
Back Close
Full Screen / Esc
Printer-friendly Version
Interactive Discussion
In summary, while our overall results match averageκ values derived for bulk ambi-ent aerosols, average κorg from ambient aerosols, as well as smog chamber studies, we find that information about the degree of oxygenation of the organic component improves our ability to predict a particle’s hygroscopicity.
5 Conclusions
5
In this analysis we use the degree of oxygenation of the organic fraction of continental aerosol to determine its overall hygroscopicity. Two methods are used to determine the degree of oxygenation, factors elucidated from PMF analysis and from the values of O/C, both of which yield a similar result in terms of the overallκorg. Analysis of the entire study found that aκoxof 0.20±0.03 is suitable if we assume that the unoxygenated HOA
10
component is non-hygroscopic, and that this overall value is similar to those for most of the specific time periods for the study. However, there are select occasions, such as the Pre-Anthropogenic period, when the organic component does not contribute signicantly to the overall hygroscopicity and we can only speculate that this may have been due to a surface coating or oligomerization process that inhibited water uptake. 15
The hygroscopicity of the organic component was also found to be related to the O/C through the proposed equationκorg=(0.30±0.05)×(O/C), although the degree of oxygenation of the aerosol in this study was limited in range and further studies in locations with aerosols of different degrees of oxygenation are needed to see if this relationship is more widely applicable.
20
With the wide-spread use of the AMS and subsequent PMF analysis to characterise ambient aerosol composition, these results are especially relevant in light of the limita-tions inherent to climate models that can only incorporate a limited number of aerosol components. Specifically, these models frequently only incorporate a hydrophobic and a hydrophilic organic aerosol species, similar in nature to the HOA and OOA AMS fac-25
ACPD
9, 25323–25360, 2009Hygroscopicity parameter of ambient
organic aerosol
R. Y.-W. Chang et al.
Title Page
Abstract Introduction
Conclusions References
Tables Figures
◭ ◮
◭ ◮
Back Close
Full Screen / Esc
Printer-friendly Version
Interactive Discussion
the type presented in this paper, an empirically-based hygroscopicity constant for the climate model organic aerosol component can be determined.
Acknowledgements. The authors would like to acknowledge significant support from F. Froude and the staffat the Centre for Atmospheric Research Experiments, Helena Dryfhout-Clark for the meteorological information and Environment Canada. Thanks also to M. McGuire for
help-5
ful discussions. Funding for the study came from NSERC, including a CGS-D awarded to R. Chang, and CFCAS, through the Cloud Aerosol Feedbacks and Climate Network. Partial infrastructure funding came from CFI and OIT. The authors also gratefully acknowledge the NOAA Air Resources Laboratory (ARL) for the provision of the HYSPLIT transport and disper-sion model and READY website (http://www.arl.noaa.gov/ready.html) used in this publication.
10
References
Abbatt, J., Broekhuizen, K., and Pradeep Kumar, P.: Cloud condensation nucleus activity of in-ternally mixed ammonium sulfate/organic acid aerosol particles, Atmos. Environ., 39, 4767– 4778, 2005. 25325
Aiken, A. C., DeCarlo, P. F., and Jimenez, J. L.: Elemental Analysis of Organic Species with
15
Electron Ionization High-Resolution Mass Spectrometry, Anal. Chem., 79, 8350–8353, 2007. 25330
Aiken, A. C., Decarlo, P. F., Kroll, J. H., Worsnop, D. R., Huffman, J. A., Docherty, K. S., Ulbrich, I. M., Mohr, C., Kimmel, J. R., Sueper, D., Sun, Y., Zhang, Q., Trimborn, A., Northway, M., Ziemann, P. J., Canagaratna, M. R., Onasch, T. B., Alfarra, M. R., Prevot, A. S. H., Dommen,
20
J. J. D., Metzger, A., Baltensperger, U., and Jimenez, J. L.: O/C and OM/OC ratios of primary, secondary, and ambient organic aerosols with high-resolution time-of-flight aerosol mass spectrometry, Environ. Sci. Technol., 42, 4478–4485, 2008. 25330, 25331, 25334
Albrecht, B.: Aerosols, Cloud Microphysics, and Fractional Cloudiness, Science, 245, 1227– 1230, 1989. 25324
25
Allan, J. D., Williams, P. I., Morgan, W. T., Martin, C. L., Flynn, M. J., Lee, J., Nemitz, E., Phillips, G. J., Gallagher, M. W., and Coe, H.: Contributions from transport, solid fuel burning and cooking to primary organic aerosols in two UK cities, Atmos. Chem. Phys. Discuss., 9, 19103–19157, 2009,
http://www.atmos-chem-phys-discuss.net/9/19103/2009/. 25330
ACPD
9, 25323–25360, 2009Hygroscopicity parameter of ambient
organic aerosol
R. Y.-W. Chang et al.
Title Page
Abstract Introduction
Conclusions References
Tables Figures
◭ ◮
◭ ◮
Back Close
Full Screen / Esc
Printer-friendly Version
Interactive Discussion
Bilde, M. and Svenningsson, B.: CCN activation of slightly soluble organics: the importance of small amounts of inorganic salt and particle phase, Tellus B, 56, 128–134, 2004. 25325 Broekhuizen, K., Pradeep Kumar, P., and Abbatt, J. P. D.: Partially soluble organics as cloud
condensation nuclei: Role of trace soluble and surface active species, Geophys. Res. Lett., 31, L01107, doi:10.1029/2003GL018 203, 2004a. 25325
5
Broekhuizen, K., Chang, R. Y.-W., Leaitch, W. R., Li, S.-M., and Abbatt, J. P. D.: Closure be-tween measured and modeled cloud condensation nuclei (CCN) using size-resolved aerosol compositions in downtown Toronto, Atmos. Chem. Phys., 6, 2513–2524, 2006,
http://www.atmos-chem-phys.net/6/2513/2006/. 25326, 25327, 25335, 25336
Broekhuizen, K. E., Thornberry, T., Pradeep Kumar, P., and Abbatt, J. P. D.: Formation of cloud
10
condensation nuclei by oxidative processing: Unsaturated fatty acids, J. Geophys. Res., 109, D24206, doi:10.1029/2004JD005 298, 2004b. 25333
Chan, T. W., Huang, L., Leaitch, W. R., Sharma, S., Brook, J. R., Slowik, J. G., Abbatt, J. P. D., Brickell, P. C., Liggio, J., Li, S.-M., and Moosm ¨uller, H.: Determination of OM/OC ratios and specific attenuation coefficients (SAC) in ambient fine PM at a rural site in southern Ontario:
15
implications for emission sources, particle aging, and radiative forcing, Atmos. Chem. Phys. Discuss., 9, 14315–14359, 2009,
http://www.atmos-chem-phys-discuss.net/9/14315/2009/. 25327, 25340
Chang, R. Y.-W., Liu, P., Leaitch, W., and Abbatt, J.: Comparison between measured and predicted CCN concentrations at Egbert, Ontario: Focus on the organic aerosol fraction at a
20
semi-rural site, Atmos. Environ., 41, 8172–8182, 2007. 25326, 25327, 25328, 25334, 25335, 25336, 25338
Chung, S. H. and Seinfeld, J. H.: Global distribution and climate forcing of carbonaceous aerosols, J. Geophys. Res., 107(D19), 4407, doi:10.1029/2001JD001 397, 2002. 25326 Cooke, W. F. and Wilson, J. J. N.: A global black carbon aerosol model, J. Geophys. Res., 101,
25
19395–19409, 1996. 25326
Cubison, M. J., Ervens, B., Feingold, G., Docherty, K. S., Ulbrich, I. M., Shields, L., Prather, K., Hering, S., and Jimenez, J. L.: The influence of chemical composition and mixing state of Los Angeles urban aerosol on CCN number and cloud properties, Atmos. Chem. Phys., 8, 5649–5667, 2008,
30
http://www.atmos-chem-phys.net/8/5649/2008/. 25327
ACPD
9, 25323–25360, 2009Hygroscopicity parameter of ambient
organic aerosol
R. Y.-W. Chang et al.
Title Page
Abstract Introduction
Conclusions References
Tables Figures
◭ ◮
◭ ◮
Back Close
Full Screen / Esc
Printer-friendly Version
Interactive Discussion
223–257, 2007. 25329
de Gouw, J. A., Middlebrook, A. M., Warneke, C., Goldan, P. D., Kuster, W. C., Roberts, J. M., Fehsenfeld, F. C., Worsnop, D. R., Canagaratna, M. R., Pszenny, A. A. P., Keene, W. C., Marchewka, M., Bertman, S. B., and Bates, T. S.: Budget of organic carbon in a polluted atmosphere: Results from the New England Air Quality Study in 2002, J. Geophys. Res.,
5
110, D16305, doi:10.1029/2004JD005 623, 2005. 25336
Draxler, R. R. and Rolph, G. D.: HYSPLIT (HYbrid Single-Particle Lagrangian Integrated Trajec-tory) Model access via NOAA ARL READY Website, http://www.arl.noaa.gov/ready/hysplit4. html, last access: 21 September 2009, 2003. 25336, 25358
Drewnick, F., Hings, S. S., DeCarlo, P., Jayne, J. T., Gonin, M., Fuhrer, K., Weimer, S., Jimenez,
10
J. L., Demerjian, K. L., Borrmann, S., and Worsnop, D. R.: A new time-of-flight aerosol mass spectrometer (TOF-AMS) – Instrument description and first field deployment, Aerosol Sci. Tech., 39, 637–658, 2005. 25329
Duplissy, J., Gysel, M., Alfarra, M. R., Dommen, J., Metzger, A., Prevot, A. S. H., Wein-gartner, E., Laaksonen, A., Raatikainen, T., Good, N., Turner, S. F., McFiggans, G., and
15
Baltensperger, U.: Cloud forming potential of secondary organic aerosol under near atmo-spheric conditions, Geophys. Res. Lett., 35, L03818, doi:10.1029/2007GL031 075, 2008. 25333, 25341, 25342
Engelhart, G. J., Asa-Awuku, A., Nenes, A., and Pandis, S. N.: CCN activity and droplet growth kinetics of fresh and aged monoterpene secondary organic aerosol, Atmos. Chem. Phys., 8,
20
3937–3949, 2008,
http://www.atmos-chem-phys.net/8/3937/2008/. 25341
Ervens, B., Cubison, M., Andrews, E., Feingold, G., Ogren, J. A., Jimenez, J. L., DeCarlo, P. F., and Nenes, A.: Prediction of cloud condensation nucleus number concentration using mea-surements of aerosol size distributions and composition and light scattering enhancement
25
due to humidity, J. Geophys. Res., 112, D10S32, doi:10.1029/2006JD007 426, 2007. 25327 Ervens, B., Cubison, M. J., Andrews, E., Feingold, G., Ogren, J. A., Jimenez, J. L., Quinn, P. K., Bates, T. S., Wang, J., Zhang, Q., Coe, H., Flynn, M., and Allan, J. D.: CCN predictions using simplified assumptions of organic aerosol composition and mixing state: a synthesis from six different locations, Atmos. Chem. Phys. Discuss., 9, 21237–21256, 2009,
30
http://www.atmos-chem-phys-discuss.net/9/21237/2009/. 25326
ACPD
9, 25323–25360, 2009Hygroscopicity parameter of ambient
organic aerosol
R. Y.-W. Chang et al.
Title Page
Abstract Introduction
Conclusions References
Tables Figures
◭ ◮
◭ ◮
Back Close
Full Screen / Esc
Printer-friendly Version
Interactive Discussion
Gunthe, S. S., King, S. M., Rose, D., Chen, Q., Roldin, P., Farmer, D. K., Jimenez, J. L., Artaxo, P., Andreae, M. O., Martin, S. T., and P ¨oschl, U.: Cloud condensation nuclei in pristine tropical rainforest air of Amazonia: size-resolved measurements and modeling of atmospheric aerosol composition and CCN activity, Atmos. Chem. Phys., 9, 7551–7575, 2009,
5
http://www.atmos-chem-phys.net/9/7551/2009/. 25326, 25342
Jacobson, M. C., Hansson, H.-C., Noone, K. J., and Charlson, R. J.: Organic Atmospheric Aerosols: Review and State of the Science, Rev. Geophys., 38, 267–294, 2000. 25325 Jayne, J., Leard, D., Zhang, X., Davidovits, P., Smith, K., Kolb, C., and Worsnop, D.:
Devel-opment of an Aerosol Mass Spectrometer for Size and Composition Analysis of Submicron
10
Particles, Aerosol Sci. Tech., 33, 49–70, 2000. 25329
Jimenez, J., Jayne, J., Shi, Q., Kolb, C., Worsnop, D., Yourshaw, I., Seinfeld, J., Fla-gan, R., Zhang, X., Smith, K., Morris, J., and Davidovits, P.: Ambient aerosol sam-pling using the Aerodyne Aerosol Mass Spectrometer, J. Geophys. Res., 108(D7), 8425, doi:10.1029/2001JD001 213, 2003. 25329
15
K ¨ohler, H.: The nucleus in and the growth of hygroscopic droplets, T. Faraday Soc., 32, 1152– 1161, 1936. 25325
Kostenidou, E., Lee, B. H., Engelhart, G. J., Pierce, J. R., and Pandis, S. N.: Mass Spectra Deconvolution of Low, Medium, and High Volatility Biogenic Secondary Organic Aerosol, Environ. Sci. Technol., 43, 4884–4889, 2009. 25341
20
Lance, S., Nenes, A., Mazzoleni, C., Dubey, M. K., Gates, H., Varutbangkul, V., Rissman, T. A., Murphy, S. M., Sorroshian, A., Flagan, R. C., Seinfeld, J. H., and Jonsson, H. H.: Cloud condensation nuclei activity, closure, and droplet growth kinetics of Houston aerosol during the Gulf of Mexico Atmospheric Composition and Climate Study (GoMACCS), J. Geophys. Res., 114, D00F15, doi:10.1029/2008JD011 699, 2009. 25326
25
Lanz, V. A., Alfarra, M. R., Baltensperger, U., Buchmann, B., Hueglin, C., and Pr ´ev ˆot, A. S. H.: Source apportionment of submicron organic aerosols at an urban site by factor analytical modelling of aerosol mass spectra, Atmos. Chem. Phys., 7, 1503–1522, 2007,
http://www.atmos-chem-phys.net/7/1503/2007/. 25325, 25330
Lohmann, U., Feichter, J., Chuang, C. C., and Penner, J. E.: Prediction of the number of cloud
30
droplets in the ECHAM GCM, J. Geophys. Res., 104, 9169–9198, 1999. 25326
ACPD
9, 25323–25360, 2009Hygroscopicity parameter of ambient
organic aerosol
R. Y.-W. Chang et al.
Title Page
Abstract Introduction
Conclusions References
Tables Figures
◭ ◮
◭ ◮
Back Close
Full Screen / Esc
Printer-friendly Version
Interactive Discussion
component of atmospheric particulates, Faraday Discuss., 130, 341–362, 2005. 25333 Medina, J., Nenes, A., Sotiropoulou, R.-E. P., Cottrell, L. D., Ziemba, L. D., Beckman, P. J.,
and Griffin, R. J.: Cloud condensation nuclei closure during the International Consortium for Atmospheric Research on Transport and Transformation 2004 campaign: Effects of size-resolved composition, J. Geophys. Res., 112, D10S31, doi:10.1029/2006JD007 588, 2007.
5
25326, 25336
Paatero, P.: Least squares formulation of robus non-negative factor analysis, Chemometr. Intell. Lab., 37, 23–35, 1997. 25330
Paatero, P. and Tapper, U.: Positive matrix factorization: A non-negative factor model with optimal utilization of error estimates of data values, Environmetrics, 5, 111–126, 1994. 25330
10
Petters, M., Carrico, C., Kreidenweis, S. M., Prenni, A., DeMott, P., Collett, J., and Moosmuller, H.: Cloud Condensation Nucleation Activity of Biomass Burning Aerosol, J. Geophys. Res., doi:10.1029/2009JD012353, in press, 2009. 25340
Petters, M. D. and Kreidenweis, S. M.: A single parameter representation of hygroscopic growth and cloud condensation nucleus activity, Atmos. Chem. Phys., 7, 1961–1971, 2007,
15
http://www.atmos-chem-phys.net/7/1961/2007/. 25326, 25331, 25332, 25340, 25341 Petters, M. D. and Kreidenweis, S. M.: A single parameter representation of hygroscopic growth
and cloud condensation nucleus activity - Part 2: Including solubility, Atmos. Chem. Phys., 8, 6273–6279, 2008,
http://www.atmos-chem-phys.net/8/6273/2008/. 25326, 25331
20
Petters, M. D., Prenni, A. J., Kreidenweis, S. M., DeMott, P. J., Matsunaga, A., Lim, Y. B., and Ziemann, P. J.: Chemical aging and the hydrophobic-to-hydrophilic conversion of carbona-ceous aerosol, Geophys. Res. Lett., 33, L24806, doi:10.1029/2006GL027 249, 2006. 25333 Pradeep Kumar, P., Broekhuizen, K., and Abbatt, J. P. D.: Organic acids as cloud condensation nuclei: Laboratory studies of highly soluble and insoluble species, Atmos. Chem. Phys., 3,
25
509–520, 2003,
http://www.atmos-chem-phys.net/3/509/2003/. 25328
Prenni, A. J., Petters, M. D., Kreidenweis, S. M., DeMott, P. J., and Ziemann, P. J.: Cloud droplet activation of secondary aerosol, J. Geophys. Res., 112, D10223, doi:10.1029/2006JD007 963, 2007. 25341
30
ACPD
9, 25323–25360, 2009Hygroscopicity parameter of ambient
organic aerosol
R. Y.-W. Chang et al.
Title Page
Abstract Introduction
Conclusions References
Tables Figures
◭ ◮
◭ ◮
Back Close
Full Screen / Esc
Printer-friendly Version
Interactive Discussion
http://www.atmos-chem-phys.net/8/1029/2008/. 25327
Raymond, T. M. and Pandis, S. N.: Cloud activation of single-component organic aerosol parti-cles, J. Geophys. Res., 107(D24), 4787, doi:10.1029/2002JD002 159, 2002. 25325
Raymond, T. M. and Pandis, S. N.: Formation of cloud droplets by multicomponent organic particles, J. Geophys. Res., 108(D15), 4469, doi:10.1029/2003JD003 503, 2003. 25325
5
Roberts, G., Artaxo, P., Zhou, J., Swietlicki, E., and Andreae, M. O.: Sensitivity of CCN spectra on chemical and physical properties of aerosol: A case study from the Amazon Basin, J. Geophys. Res., 107(D20), 8070, doi:10.1029/2001JD000 583, 2002. 25326
Roberts, J. M., Fehsenfeld, F. C., Liu, S. C., Bollinger, M. J., Hahn, C., Albritton, D. L., and Sievers, R. E.: Measurements of aromatic hydrocarbon ratios and NOxconcentrations in the
10
rural troposphere: Observation of air mass photochemical aging and NOx removal, Atmos. Environ., 18, 2421–2432, 1984. 25336
Rolph, G. D.: Real-time Environmental Applications and Display sYstem (READY) Website, http://www.arl.noaa.gov/ready/hysplit4.html, last access: 21 September 2009, 2003. 25336, 25358
15
Rose, D., Nowak, A., Achtert, P., Wiedensohler, A., Hu, M., Shao, M., Zhang, Y., Andreae, M. O., and P ¨oschl, U.: Cloud condensation nuclei in polluted air and biomass burning smoke near the mega-city Guangzhou, China - Part 1: Size-resolved measurements and implica-tions for the modeling of aerosol particle hygroscopicity and CCN activity, Atmos. Chem. Phys. Discuss., 8, 17343–17392, 2008,
20
http://www.atmos-chem-phys-discuss.net/8/17343/2008/. 25326, 25342
Rupakheti, M., Leaitch, W., Lohmann, U., Hayden, K., Brickell, P., Lu, G., Li, S.-M., Toom-Sauntry, D., Bottenheim, J., Brook, J., Vet, R., Jayne, J., and Worsnop, D.: An Intensive Study of the Size and Composition of Submicron Atmospheric Aerosols at a Rural Site in Ontario, Canada, Aerosol Sci. Tech., 39, 722–736, 2005. 25327, 25337
25
Saxena, P. and Hildemann, L. M.: Water-soluble organics in atmospheric particles: A critical review of the literature and application of thermodynamics to identify candidate compounds, J. Atmos. Chem., 24, 57–109, 1996. 25325
Saxena, V. K., Burford, J. N., and Kassner Jr, J. L.: Operation of a Thermal Diffusion Chamber for Measurements on Cloud Condensation Nuclei, J. Atmos. Sci., 27, 73–80, 1970. 25328
30
ACPD
9, 25323–25360, 2009Hygroscopicity parameter of ambient
organic aerosol
R. Y.-W. Chang et al.
Title Page
Abstract Introduction
Conclusions References
Tables Figures
◭ ◮
◭ ◮
Back Close
Full Screen / Esc
Printer-friendly Version
Interactive Discussion
http://www.atmos-chem-phys-discuss.net/9/13775/2009/. 25327, 25338
Shilling, J. E., King, S. M., Mochida, M., Worsnop, D. R., and Martin, S. T.: Mass Spectral Evidence That Small Changes in Composition Caused by Oxidative Aging Processes Alter Aerosol CCN Properties, J. Phys. Chem. A, 111, 3358–3368, 2007. 25333
Shilling, J. E., Chen, Q., King, S. M., Rosenoern, T., Kroll, J. H., Worsnop, D. R., DeCarlo, P.
5
F., Aiken, A. C., Sueper, D., Jimenez, J. L., and Martin, S. T.: Loading-dependent elemental composition ofα-pinene SOA particles, Atmos. Chem. Phys., 9, 771–782, 2009,
http://www.atmos-chem-phys.net/9/771/2009/. 25341
Slowik, J. G., Stroud, C., Bottenheim, J. W., Brickell, P. C., Chang, R. Y.-W., Liggio, J., Makar, P. A., Martin, R. V., Moran, M. D., Shantz, N. C., Sjostedt, S. J., van Donkelaar, A., Vlasenko,
10
A., Wiebe, H. A., Xia, A. G., Zhang, J., Leaitch, W. R., and Abbatt, J. P. D.: Characterization of a large biogenic secondary organic aerosol event from eastern Canadian forests, Atmos. Chem. Phys. Discuss., 9, 18113–18158, 2009,
http://www.atmos-chem-phys-discuss.net/9/18113/2009/. 25327, 25330, 25337
Slowik, J. G., Vlasenko, A., McGuire, M., Evans, G. J., and Abbatt, J. P. D.: Simultaneous factor
15
analysis of organic particle and gas mass spectra: AMS and PTR-MS measurements at an urban site, Atmos. Chem. Phys. Discuss., 9, 6739–6785, 2009 25330
Solomon, S., Qin, D., Manning, M., Chen, Z., Marquis, M., Averyt, K. B., Tignor, M., and Miller, H. (eds.): IPCC, 2007: Summary for Policymakers, Climate Change 2007: The Physical Science Basis. Contribution of Working Group I to the Fourth Assessment Report of the
20
Intergovernmental Panel on Climate Change, Cambridge University Press, New York, 2007. 25324
Stroud, C. A., Nenes, A., Jimenez, J. L., DeCarlo, P. F., Huffman, J. A., Bruintjes, R., Nemitz, E., Delia, A. E., Toohey, D. W., Guenther, A. B., and Nandi, S.: Cloud Activating Properties of Aerosol Observed during CELTIC, J. Atmos. Sci., 64, 441–459, 2007. 25326
25
Twomey, S.: The Influence of Pollution on the Shortwave Albedo of Clouds, J. Atmos. Sci., 34, 1149–1152, 1977. 25324
Ulbrich, I. M., Canagaratna, M. R., Zhang, Q., Worsnop, D. R., and Jimenez, J. L.: Interpreta-tion of organic components from Positive Matrix FactorizaInterpreta-tion of aerosol mass spectrometric data, Atmos. Chem. Phys., 9, 2891–2918, 2009,
30
http://www.atmos-chem-phys.net/9/2891/2009/. 25325, 25326, 25330
Proton-ACPD
9, 25323–25360, 2009Hygroscopicity parameter of ambient
organic aerosol
R. Y.-W. Chang et al.
Title Page
Abstract Introduction
Conclusions References
Tables Figures
◭ ◮
◭ ◮
Back Close
Full Screen / Esc
Printer-friendly Version
Interactive Discussion
Transfer-Reaction Mass Spectrometry at a Rural Ontario Site: Sources and Correlation to Aerosol Composition, J. Geophys. Res., 114, D21305, doi:10.1029/2009JD012 025, 2009. 25327, 25329
Wang, J., Lee, Y.-N., Daum, P. H., Jayne, J., and Alexander, M. L.: Effects of aerosol organics on cloud condensation nucleus (CCN) concentration and first indirect aerosol effect, Atmos.
5
Chem. Phys., 8, 6325–6339, 2008,
http://www.atmos-chem-phys.net/8/6325/2008/. 25326, 25336, 25342
Wex, H., Petters, M. D., Carrico, C. M., Hallbauer, E., Massling, A., McMeeking, G. R., Poulain, L., Wu, Z., Kreidenweis, S. M., and Stratmann, F.: Towards closing the gap between hygro-scopic growth and activation for secondary organic aerosol: Part 1 - Evidence from
mea-10
surements, Atmos. Chem. Phys., 9, 3987–3997, 2009, http://www.atmos-chem-phys.net/9/3987/2009/. 25341
Windholz, M. (ed.): The Merck index, Tenth Edition, Merck and Co., Inc., Rahway, NJ, 1983. 25332
Zhang, Q., Alfarra, M. R., Worsnop, D. R., Allan, J. D., Coe, H., Canagaratna, M. R., and
15
Jimenez, J. L.: Deconvolution and Quantification of Hydrocarbon-like and Oxygenated Or-ganic Aerosols Based on Aerosol Mass Spectrometry, Environ. Sci. Technol., 39, 4938– 4952, 2005. 25325
Zhang, Q., Jimenez, J. L., Canagaratna, M. R., Allan, J. D., Coe, H., Ulbrich, I., Alfarra, M., Takami, A., Middlebrook, A. M., Sun, Y., Dzepina, K., Dunlea, E., Docherty, K., DeCarlo,
20
P. F., Onasch, T. B., Jayne, J., Miyoshi, T., Shimono, A., Hatakeyama, S., Takegawa, N., Kondo, Y., Schneider, J., Drewnick, F., Borrmann, S., Weimer, S., Demerjian, K., Williams, P., Bower, K., Bahreini, R., Cottrell, L., Griffin, R. J., Rautiainen, J., Sun, J., Zhang, Y., and Worsnop, D.: Ubiquity and dominance of oxygenated species in organic aerosols in anthropogenically-influenced Northern Hemisphere midlatitudes, Geophys. Res. Lett., 34,
25
ACPD
9, 25323–25360, 2009Hygroscopicity parameter of ambient
organic aerosol
R. Y.-W. Chang et al.
Title Page
Abstract Introduction
Conclusions References
Tables Figures
◭ ◮
◭ ◮
Back Close
Full Screen / Esc
Printer-friendly Version
Interactive Discussion
Table 1.κoxfor select time periods.
Time Period κox
ACPD
9, 25323–25360, 2009Hygroscopicity parameter of ambient
organic aerosol
R. Y.-W. Chang et al.
Title Page
Abstract Introduction
Conclusions References
Tables Figures
◭ ◮
◭ ◮
Back Close
Full Screen / Esc
Printer-friendly Version
Interactive Discussion
Table 2.κcalculated for the PMF factors of the organic aerosol component.
Factor m/z 44/Total Organic O/C κ
OOA-1 0.19 0.81 0.24 OOA-2 0.10 0.46 0.14 BBOA 0.025 0.17 0.05 HOA 8×10⁻⁸