ACPD
9, 25983–26012, 2009PTR-TD-MS: a new approach to study organic aerosols
R. Holzinger et al.
Title Page
Abstract Introduction
Conclusions References
Tables Figures
◭ ◮
◭ ◮
Back Close
Full Screen / Esc
Printer-friendly Version
Interactive Discussion Atmos. Chem. Phys. Discuss., 9, 25983–26012, 2009
www.atmos-chem-phys-discuss.net/9/25983/2009/ © Author(s) 2009. This work is distributed under the Creative Commons Attribution 3.0 License.
Atmospheric Chemistry and Physics Discussions
This discussion paper is/has been under review for the journal Atmospheric Chemistry and Physics (ACP). Please refer to the corresponding final paper in ACP if available.
Aerosol analysis using
a Proton-Transfer-Reaction
Thermo-Desorption Mass Spectrometer
(PTR-TD-MS): a new approach to study
processing of organic aerosols
R. Holzinger1, J. Williams2, F. Herrmann2, J. Lelieveld2, N. M. Donahue3, and T. R ¨ockmann1
1
Institute for Marine and Atmospheric research Utrecht, Princetonplein 5, 3584 CC, Utrecht, The Netherlands
2
Max Planck Institute for Chemistry, Mainz, Germany
3
Center for Atmospheric Particle Studies, Carnegie Mellon Univ., Pittsburgh PA 15213, USA Received: 25 November 2009 – Accepted: 26 November 2009 – Published: 3 December 2009 Correspondence to: R. Holzinger ([email protected])
Published by Copernicus Publications on behalf of the European Geosciences Union.
ACPD
9, 25983–26012, 2009PTR-TD-MS: a new approach to study organic aerosols
R. Holzinger et al.
Title Page
Abstract Introduction
Conclusions References
Tables Figures
◭ ◮
◭ ◮
Back Close
Full Screen / Esc
Printer-friendly Version
Interactive Discussion
Abstract
We present a novel analytical approach to measure the chemical composition of organic aerosol. The new instrument combines proton-transfer-reaction mass-spectrometry (PTR-MS) with a collection-thermo-desorption aerosol sampling tech-nique. For secondary organic aerosol produced from the reaction of ozone with iso-5
prenoids in a laboratory reactor, the PTR-TD-MS instrument detected typically 80% of the mass that was measured with a scanning mobility particle sizer (SMPS). The first field deployment of the instrument was the EUCAARI-IOP campaign at the CESAR tall tower site in the Netherlands. For masses with low background values (∼30% of all masses) the detection limit of aerosol compounds was below 0.2 ng/m3 which 10
corresponds to a sampled compound mass of 35 pg. Comparison of thermograms from ambient samples and from chamber-derived secondary organic aerosol shows that, in general, organic compounds from ambient aerosol samples desorb at much higher temperatures than chamber samples. This suggests that chamber aerosol is not a good surrogate for ambient aerosol and therefore caution is advised when ex-15
trapolating results from chamber experiments to ambient conditions.
1 Introduction
Organic aerosol (OA) sources in the global atmosphere are enormously uncertain. While state-of-the-art models predict total organic aerosol formation rates of 12– 70 Tg yr−1 (Hallquist et al., 2009; Kanakidou et al., 2005), alternative budgeting ap-20
proaches indicate significantly higher OA production. Field observations consistently reveal 3–10 times more organic aerosol than predicted by models (Heald et al., 2005; Volkamer et al., 2006), while top-down estimates suggest between 60 and 330 Tg C yr−1(120–660 Tg OA yr−1) (Goldstein and Galbally, 2007), again several times higher than global model predictions. The search for this “missing” OA has become 25
ACPD
9, 25983–26012, 2009PTR-TD-MS: a new approach to study organic aerosols
R. Holzinger et al.
Title Page
Abstract Introduction
Conclusions References
Tables Figures
◭ ◮
◭ ◮
Back Close
Full Screen / Esc
Printer-friendly Version
Interactive Discussion (SOA) yields from volatile organic precursors such as isoprene (Kroll et al., 2006;
Paulot et al., 2009) or toluene (Hildebrandt et al., 2009; Ng et al., 2007), heterogeneous uptake of glyoxal (Kroll et al., 2005; Volkamer et al., 2007), aqueous photochemistry (Ervens et al., 2008), or oxidation of low vapor-pressure “intermediate volatility organ-ics” (IVOC) (Donahue et al., 2006; Grieshop et al., 2008; Robinson et al., 2007). 5
Not only is there more organic aerosol in the atmosphere than represented by mod-els, it is also oxidized to a very high degree. A compilation of aerosol mass spectrom-eter (AMS) field observations in the Northern Hemisphere shows that approximately 95% of the OA mass in the remote continental boundary layer has a characteristic electron-impact ionization mass spectrum dubbed “oxidized organic aerosol” (OOA), 10
with urban environments containing about 67% OOA (Zhang et al., 2007). Subsequent principal component analyses have decomposed ambient AMS data into four to six factors, typically including two classes of OOA (Lanz et al., 2008), and the advent of high-resolution time-of-flight AMS measurements (DeCarlo et al., 2006) has enabled more accurate determination of the oxygen content of those factors (Aiken et al., 2008). 15
The oxygen-to-carbon ratio (O:C) of the OOA ranges from about 0.5:1 for the less oxy-genated OOA-2 to about 1:1 for the more heavily oxyoxy-genated OOA-1 (Aiken et al., 2008). Field observations employing a temperature-scanning thermodenuder reveal that OOA-1 is relatively less volatile while OOA-2 is relatively more volatile (Huffman et al., 2009), consistent with observed correlations between OOA-1 and sulfate, and 20
between OOA-2 and nitrate (Lanz et al., 2008). Even if the absolute values of O:C and volatility from these measurements remain uncertain, they show conclusively that a substantial fraction of the OA has been subject to oxidation processes.
Here we described a new analytical approach, Proton-Transfer-Reaction Thermo-Desorption Mass Spectrometry (PTR-TD-MS), based on a novel combination of an 25
aerosol inlet previously developed for in situ thermal desorption GC-MS (Williams et al., 2006) and proton-transfer reaction mass spectrometry (PTR-MS, Holzinger et al., 2007) to evaluate both the composition and volatility of organic aerosol. The conceptual idea is similar to the method described by Thornberry et al. (2009). The PTR-TD-MS
ACPD
9, 25983–26012, 2009PTR-TD-MS: a new approach to study organic aerosols
R. Holzinger et al.
Title Page
Abstract Introduction
Conclusions References
Tables Figures
◭ ◮
◭ ◮
Back Close
Full Screen / Esc
Printer-friendly Version
Interactive Discussion instrument fills a niche because it allows for aerosol measurements at a time
reso-lution below 1 h, with detailed and comprehensive physicochemical information and an excellent detection limit. Therefore the new instrument has a high potential to eluci-date chemical processes that transform fresh aerosol (either primary emissions or first-generation secondary aerosol observed in smog-chamber experiments) to the highly 5
oxidized aerosol that is typically observed in the field.
We report first results obtained from chamber produced secondary organic aerosol (SOA) from ozonolysis of isoprenoids and from ambient aerosol as measured during the EUCAARI-IOP campaign in Cabauw, Netherlands, in May 2008.
2 Experimental
10
2.1 The PTR-TD-MS instrument
The PTR-TD-MS instrument consists of a modified commercial PTR-MS (Ionicon Inc., Innsbruck, Austria) which is equipped with both a gas and an aerosol inlet. A full de-scription of PTR-MS and its functionality is given elsewhere (Lindinger et al., 1998; Hansel et al., 1995). Here, we briefly describe the aspects that are necessary to un-15
derstand the potential of the new approach: PTR-MS is a chemical ionization technique using protonated water (H3O+) as ionizing agent. Guided by an electrical field of∼60– 70 V/cm, the H3O+ ions are pulled through the drift tube in which a typical pressure of 2–4 mbar is maintained by a low flow (10–15 ml/min) of sample gas. A small fraction of primary ions reacts with organic species in the sample gas. The amount of product 20
ions formed in the drift tube is directly proportional to the concentration of the organic compounds in the sample gas. Primary ions and product ions are detected with a mass spectrometer. The data reported here rely on a unit mass resolution quadrupole mass spectrometer, but we are in the process up upgrading to a high mass resolution time-of-flight mass spectrometer.
ACPD
9, 25983–26012, 2009PTR-TD-MS: a new approach to study organic aerosols
R. Holzinger et al.
Title Page
Abstract Introduction
Conclusions References
Tables Figures
◭ ◮
◭ ◮
Back Close
Full Screen / Esc
Printer-friendly Version
Interactive Discussion The use of PTR-MS as detector for aerosol compounds is highly advantageous for
the following reasons: (i) PTR-MS is a relatively soft ionization technique; many com-pounds do not fragment and are detected at their protonated mass (molecular weight +1). If fragmentation occurs it often follows a well-defined pattern such as the loss of an H2O fragment in the case of higher alcohols. (ii) PTR-MS is very sensitive and therefore 5
low detection limits in aerosol analysis can be achieved. (iii) Virtually all compounds constituting the “organic carbon” fraction in aerosols can be detected, and (iv) although compounds are only identified by their mass to charge ratio in the mass spectrometer they can still be quantified at the∼30% accuracy level because of the well-defined con-ditions in the drift tube and the fact that proton-transfer reaction rates are usually close 10
to the ion-molecule collision rate when a reaction is energetically possible.
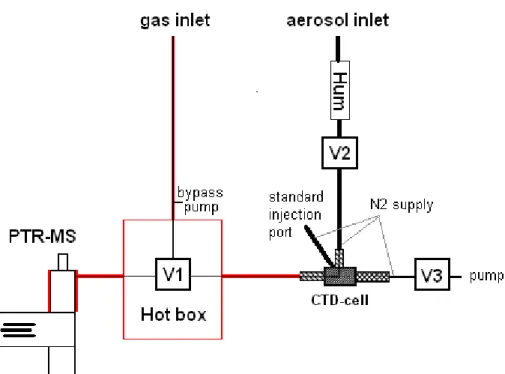
The centerpiece of the aerosol inlet is a Collection-Thermo-Desorption (CTD) cell (Aerosol Dynamics, Berkeley, CA, USA) that is similar in design to the CTD cell used with the Thermal Desorption Aerosol Gas Chromatograph described by (Williams et al., 2006). The CTD cell collects ambient particles in the 0.07–2µm size range at 15
an air sample flow rate of 1 l/min, and allows for gradual thermal desorption of the collected sample into the PTR-MS system. Particle collection is done by humidification-aided impaction, whereby the ambient airstream is humidified to∼70% RH by a Nafion-based humidifier to reduce particle rebound, and then impacted onto the stainless steel collection surface using a sonic jet impactor. Additionally, the CTD cell contains 20
an auxiliary injection port for the manual introduction of liquid standards by means of a syringe. All parts in contact with volatilized aerosol compounds (i.e. the CTD cell, the PTR-MS drift tube, and all transfer tubing and valves) were coated with the “Restek Sulfinert” treatment to increase the chemical inertness of the surface. The transfer lines and the PTR-MS drift tube were operated at elevated temperatures of 200◦C to 25
avoid re-condensation of evaporated aerosol compounds.
A schematic drawing of the instrument is presented in Fig. 1. In the “load” mode, air is pulled through the CTD cell via valves 2 and 3, and the aerosols are collected on a sharp point in the CTD cell. While loading the CTD cell, the PTR-MS is connected
ACPD
9, 25983–26012, 2009PTR-TD-MS: a new approach to study organic aerosols
R. Holzinger et al.
Title Page
Abstract Introduction
Conclusions References
Tables Figures
◭ ◮
◭ ◮
Back Close
Full Screen / Esc
Printer-friendly Version
Interactive Discussion via valve 1 to the gasphase inlet. In principle, the PTR-MS performs conventional gas
phase measurements in this mode. However, due to the high operating temperature of the drift tube and inlet lines a significant fraction of the aerosols evaporates, so that in fact we detect the combined signal of gas phase and condensed-phase organics rather than gas phase mixing ratios alone.
5
For the aerosol analysis, valves 2 and 3 are closed and valve 1 is switched to the aerosol inlet. A small flow of 10–12 ml/min of nitrogen carrier gas transports all com-pounds evaporating from the CTD cell directly into the PTR-MS. Note that there is no further splitting of the flow so that 100% of the CTD cell effluent passes through the drift tube of the PTR-MS. The temperature of the CTD cell is ramped at a rate of 25◦C/min 10
from ambient temperatures (∼25◦C) to a maximum temperature of 350◦C. Thus an aerosol measurement can be completed in about 15 min.
The PTR-MS measures mixing ratios of aerosol-derived compounds in the nitrogen carrier gas. The mass concentration of an aerosol compound in the air sample can be calculated according to
15
naer,x=(Cmean,x·MWx·FN2·tmeas)/(22.4·Fcol·tcol·0.001), (1)
wherenaer,x is the aerosol concentration of compound X in ng m−3,Cmean,x its (arith-metic) mean mixing ratio during the aerosol analysis in the nitrogen carrier gas in nmol/mol, MWx the molecular weight of compound X in g/mol, FN2 the flow of the carrier gas in standard liters per minute, tmeas the duration of the aerosol measure-20
ment in minutes, Fcol the flow rate at which the aerosols are collected in standard liters per minute, and tcol the duration of aerosol collection in minutes. The CTD cell also represents a preconcentration step because the aerosols of a gas volume Fcol·tcol are transferred into the much smaller volume FN
2·tmeas. For equal collection and
analy-sis times the preconcentration is a factor of Fcol/FN
2∼100, with longer sampling times
25
ACPD
9, 25983–26012, 2009PTR-TD-MS: a new approach to study organic aerosols
R. Holzinger et al.
Title Page
Abstract Introduction
Conclusions References
Tables Figures
◭ ◮
◭ ◮
Back Close
Full Screen / Esc
Printer-friendly Version
Interactive Discussion ionization techniques (including PTR-MS) for aerosol analysis are, thus far, restricted
to chamber experiments (Hellen et al., 2008; Hearn and Smith, 2004).
After a cool down period of 10–15 min a new collection cycle can be started. Valve switching, heating/cooling etc. is automated and therefore the system is capable of continuous measurements over extended periods of time.
5
2.2 Quantification of uncalibrated aerosol compounds
Ambient organic aerosols usually contain hundreds of different compounds and it is not possible to calibrate the instrument with standard mixtures for each of the constituents. Therefore we rely on calculation of the mixing ratio according to
Cx=(Sx/trx)/[(S19·k19/tr19+S37·k37/tr37)·treact·N], (2) 10
where Cx is the volume mixing ratio of compound X in units of mol/mol; Sx, S19, and S37 are the ion signals of compound X, H3O+, and the protonated water dimer, (H2O)2H+, in counts per second; trx,tr19, and tr37 are the respective dimensionless transmission factors of the quuadrupole mass spectrometer;k19 andk37are the reac-tion rate constants of compoundX with H3O+ and (H2O)2H+, respectively, in units of 15
cm3s−1molecule−1;treact the residence time of H3O+ ions in the drift tube; andN the number density of the sample gas in the drift tube in molecules per cm3.
The number densityN is calculated according to
N=N0·pdrift·T0/(p0·Tdrift), (3) whereN0 is 2.69×10
19
molecules cm−3 at 273 K (T0) and 1013.25 hPa (p0); pdrift and 20
Tdrift are the pressure and temperature in the drift tube, respectively. The residence or reaction time of H3O+ ions in the drift tube is calculated according to treact=d /vd, whered=9.6 cm, the length of the drift tube, andvd, the drift velocity of the hydronium ions is calculated according to
vd=E·µ0·p0·Tdrift/(pdrift·T0), (4) 25
ACPD
9, 25983–26012, 2009PTR-TD-MS: a new approach to study organic aerosols
R. Holzinger et al.
Title Page
Abstract Introduction
Conclusions References
Tables Figures
◭ ◮
◭ ◮
Back Close
Full Screen / Esc
Printer-friendly Version
Interactive Discussion whereE is the electrical field in V per cm; µ0=2.7 cm2/(V s), the reduced mobility of
H3O+ in nitrogen (N2), and the other values as in Eq. (3). Since the abundance of the protonated water dimer can be up to 20% of the H3O+ signal, the protonated water dimer is considered as second primary ion in Eq. (2).
The transmission efficiency of the quadrupole mass spectrometer was regularly mea-5
sured by sequentially measuring standard mixtures (mixing ratios of severalµmol/mol) of a set of calibration compounds for a few seconds. The transmission efficiency with respect to the primary ion signal can be calculated from the relative decrease/increase of the primary/product ion, respectively. For example, trimethylbenzene has been used to calibrate the transmission efficiency at mass 121. When an increase of one million 10
counts per second was observed at mass 121 the corresponding decrease of the pri-mary ion signal was typically only 550 000 counts per second. Form/z ratios above 121 Da, no appropriate calibration substances were available and we used the known fragmentation pattern ofβ-caryophyllene (Demarcke et al., 2009) to optimize our trans-mission curve. Above anm/z ratio of 205 the transmission efficiency was estimated. 15
Figure 2 shows the transmission curve that was used for calculating mixing ratios. For the majority of organic compounds the reaction rate constant is in the range 1.7– 2.5×10⁻⁹cm3s−1molecule−1 (Zhao and Zhang, 2004). However, oxygenated com-pounds react at higher rates of up to 3.8×10⁻⁹cm3s−1molecule−1, and values above 4×10⁻⁹cm3s−1molecule−1 are reported for some compounds. In this work we use 20
a standard reaction rate constant of 2×10⁻⁹cm3s−1molecule−1.
3 First results and discussion 3.1 Smog chamber measurements
Smog-chamber experiments were performed in an evacuable 570 l volume spherical glass vessel at the Max Planck Institute for Chemistry in Mainz. The experiments we 25
ACPD
9, 25983–26012, 2009PTR-TD-MS: a new approach to study organic aerosols
R. Holzinger et al.
Title Page
Abstract Introduction
Conclusions References
Tables Figures
◭ ◮
◭ ◮
Back Close
Full Screen / Esc
Printer-friendly Version
Interactive Discussion the ozonolysis of isoprene,α-pinene, limonene, andβ-caryophyllene. Ozone and
gas-phase compounds were monitored with FTIR and PTR-TD-MS, respectively. Aerosol concentrations were measured with an SMPS instrument and with PTR-TD-MS. Dur-ing the smog-chamber experiments the PTR-TD-MS recorded full mass spectra in the mass range 20–419 Da at a scanning speed of 0.1 s per mass unit, so that a full mass 5
scan was completed in 40 s.
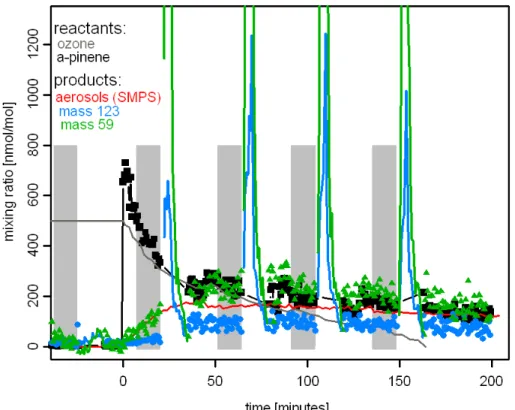
A typical course of an ozonolysis experiment is shown in Fig. 3. Before the start of the experiment the vessel was pressurised (∼980 hPa) with humidified air; ozone was added at typical levels of several 100s nmol/mol. The experiment was started by injecting the reactant (∼700 nmol/mol ofα-pinene for the experiment shown in Fig. 3). 10
The reaction immediately started, as can be seen by decreasing mixing ratios of ozone and α-pinene. Figure 3 also depicts the course of the mixing ratio of two products detected at masses 59 and 123 Da in the PTR-TD-MS. The symbols in Fig. 3 denote gas-phase mixing ratios; maximum mixing ratios of ∼250 and ∼75 nmol/mol indicate molar gas phase yields of 35% and 10% for m59 and m123, respectively. The maxi-15
mum particle concentration was reached 40–75 min after the start of the experiment. The grey shaded areas in Fig. 3 indicate the 15-min time periods of aerosol sampling. The aerosols were immediately analysed after collection and therefore the green and blue lines in Fig. 3 represent the abundance of compounds in aerosols detected at mass 59 and 123, respectively. Due to the preconcentration on the CTD cell the mixing 20
ratio is much higher during the aerosol measurement even though the concentration of the detected compounds is much larger in the gas phase.
3.1.1 Detected masses
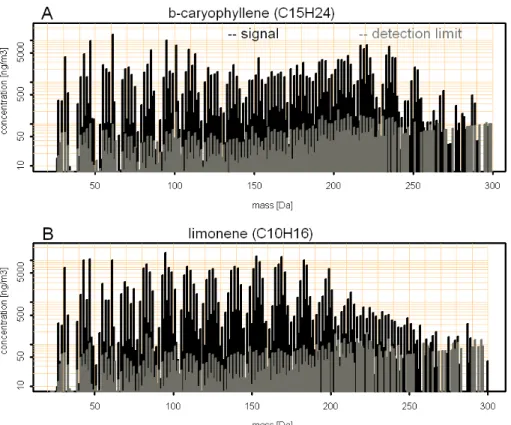
Figure 4 shows mass concentrations of compounds that were measured in aerosol produced from ozonolysis ofβ-caryophyllene (C15H24) and limonene (C10H16). The 25
concentrations were corrected for background contamination on the individual masses. On most masses the signal was significantly above the detection limit (also shown in Fig. 4), which was calculated as 3 times the standard error of the background signal.
ACPD
9, 25983–26012, 2009PTR-TD-MS: a new approach to study organic aerosols
R. Holzinger et al.
Title Page
Abstract Introduction
Conclusions References
Tables Figures
◭ ◮
◭ ◮
Back Close
Full Screen / Esc
Printer-friendly Version
Interactive Discussion The protonated masses ofβ-caryophyllene and limonene are 205 and 137 Da,
respec-tively, and they both have 2 double bonds that can react with ozone. Thus, a total of 4 oxygen atoms can be added by straightforward ozone chemistry and the high-est masses that are therefore expected in the mass spectra are 269 and 201 for β -caryophyllene and limonene, respectively. Masses above these threshold values con-5
tribute very little to the burden of total aerosol mass (Fig. 4). It is remarkable that high signals were observed at low molecular weights. The most prominent low-mass-peaks were detected at 31, 43, 47, and 61 Da. The detected signal at mass 48 and 62 was 1.5±0.3% and 2.5±0.3% of the signal detected at mass 47 and 61, respec-tively. We conclude that the ions detected at mass 47 and 61 contain 1 and 2 carbon 10
atoms, respectively. Therefore masses 31, 47, and 61 can be attributed to protonated formaldehyde, formic acid and acetic acid, respectively. At room temperature these compounds have high saturation vapour pressures (>150 hPa) and their contribution to the aerosol phase should be negligible. Therefore, the signals we observe at low molecular weights must be fragments of heavier compounds and the low masses may 15
actually be associated with high molecular weight compounds.
3.1.2 Mass balance
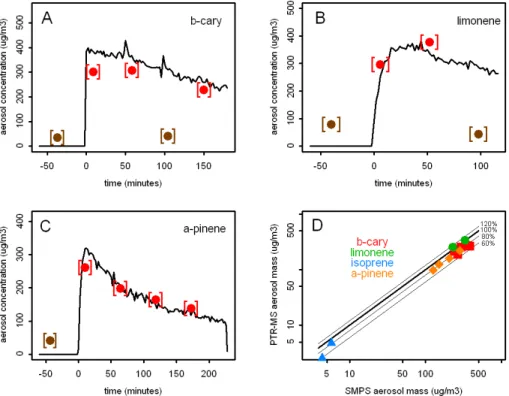
The total aerosol mass measured with the PTR-TD-MS system was calculated by sum-ming up the contributions from all individual ions. Figure 5a–c shows the evolution of aerosol mass during ozonolysis of β-caryophyllene, limonene, and α-pinene as ob-20
tained with the PTR-TD-MS system and the SMPS. The PTR-TD-MS system of course has a lower temporal resolution when compared to SMPS, but it captures the general evolution well. The PTR-TD-MS has some background signal which results in above zero concentrations at times when no aerosols were present in the chamber (nega-tive times in Fig. 5). Occasionally we also measured the background signal after the 25
ACPD
9, 25983–26012, 2009PTR-TD-MS: a new approach to study organic aerosols
R. Holzinger et al.
Title Page
Abstract Introduction
Conclusions References
Tables Figures
◭ ◮
◭ ◮
Back Close
Full Screen / Esc
Printer-friendly Version
Interactive Discussion mass data shown in Fig. 5d have been corrected by subtracting the appropriate
back-ground data. A scatter plot of total aerosol mass measured with the SMPS (assuming density 1 g cm−3) versus the total aerosol mass measured with the PTR-TD-MS sys-tem (Fig. 5d) shows that the total aerosol mass measured with the PTR-TD-MS was typically 20% below the mass measured with the SMPS. It is actually expected that 5
the PTR-TD-MS measures a lower total aerosol mass because, as discussed above, a significant fraction of aerosol compounds fragment during the protonation process. When fractionation occurs during a proton-transfer reaction only one fragment can be detected in the mass spectrometer, i.e. the fragment that carries the charge. The neu-tral fragment(s) are not detected and therefore a certain fraction of the aerosol mass 10
is lost and cannot be accounted for. We can roughly estimate the lost fraction by at-tributing signals below 90 Da to fragments and the signals above 90 Da to protonated compounds. In a second step we calculate the average molecular weight from the “protonated compounds”. For the two measurements shown in Fig. 4 these are 162 Da and 141 Da forβ-caryophyllene and limonene, respectively. In a third step we use the 15
average molecular weight to calculate the individual contributions from masses below 90 Da according to Eq. (1). Applying this simple procedure we find that 66–76% of the total aerosol mass should be detected. If we run the same procedure but using 60 and 120 Da as threshold that separates fragments from protonated compounds, we compute that 80–85% and 57–68% of the total aerosol mass is detected. Whereas 20
a threshold of 60 Da is certainly too low, 120 Da is probably on the high end of po-tentially reasonable threshold values. Therefore we conservatively state that the PTR-TD-MS instrument detected 55–80% of the total aerosol mass. The better agreement in Fig. 5d is probably an indication that the average reaction rate constant for proton transfer reactions of the H3O+ ions with aerosol compounds is larger than the value of 25
2×10⁻⁹cm3s−1molecule−1that we used for calculating the concentrations.
ACPD
9, 25983–26012, 2009PTR-TD-MS: a new approach to study organic aerosols
R. Holzinger et al.
Title Page
Abstract Introduction
Conclusions References
Tables Figures
◭ ◮
◭ ◮
Back Close
Full Screen / Esc
Printer-friendly Version
Interactive Discussion
3.1.3 Information obtained from the thermograms
The controlled heating of the CTD cell at a rate of 25◦C/min represents an addi-tional dimension in the dataset, constraining how easily individual compounds can be volatilized from the aerosols. Typical thermograms for chamber aerosol are given in Fig. 6 for different compounds, masses, and aerosol age. For better comparison of 5
different concentration ranges the measured mixing ratios have been normalized for this analysis. The evaporation profile of each compound has been fitted according to
Y(T≤Ta)=0, andY(T > Ta)=H·(T−Ta)2·e−((T−Ta)/W), (5)
whereY is the signal in arbitrary units;H,Ta, andW are free parameters (optimized by the non-linear least square method) and represent the height of the fit, the threshold 10
temperature at which the compound is being evaporated, and the width of the evapo-ration profile, respectively.
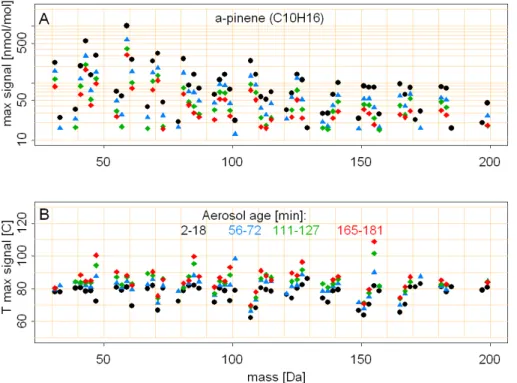
It is noteworthy that the aerosol compounds evaporate at slightly higher temperatures with increasing aerosol age. The maximum of the fit shifts by a few degrees towards higher temperatures. The temperature at which the fitting function maximizes is shown 15
in Fig. 7b for all significant compounds that were detected in aerosols produced from α-pinene ozonolysis. As a criterion of significance we used the condition that the max-imum mixing ratio of the aerosol compound exceeds 30 nmol/mol in the N2carrier gas. The maximum signal for all masses meeting this criterion (Fig. 7a) typically decreases by a factor of 3 from the first to the last measurement. The decrease is larger than 20
ACPD
9, 25983–26012, 2009PTR-TD-MS: a new approach to study organic aerosols
R. Holzinger et al.
Title Page
Abstract Introduction
Conclusions References
Tables Figures
◭ ◮
◭ ◮
Back Close
Full Screen / Esc
Printer-friendly Version
Interactive Discussion
3.2 Ambient air measurements during the EUCAARI-IOP campaign
Field measurements were carried out in May 2008 during the EUCAARI-IOP campaign at the Cabauw Experimental Site for Atmospheric Research (CESAR) site in the cen-tral Netherlands (http://www.knmi.nl/samenw/eucaari/). The PTR-TD-MS system was located inside the building and the aerosols were sampled from the roof at a height 5
of 5 m above the ground through a ∼10 m long copper tube (ID=4 mm). During the field experiments the PTR-TD-MS instrument recorded full mass spectra in the mass range 20–219 Da at a scanning speed of 0.2 s per mass unit, so a full mass scan was completed in 40 s.
Here we evaluate the period from 9–20 May, which can be sub-divided into 3 periods 10
with different meteorological conditions: (i) 9–12 May was characterized by cloudless conditions with air masses flowing in from the east/southeast and carried pollution from Central/Eastern Europe (http://transport.nilu.no/flexpart-projects?stn=CBW); (ii) between 13–16 May it was overcast, with significant rainfall on 16 May. Back trajectory calculations for this period show that the air masses were influenced by local emissions 15
from the Netherlands and Northern Germany. The last period (iii) from 17–20 May showed a distinct marine influence from the North Sea and air masses had little recent contamination from continental sources.
Figure 8 shows mixing ratios of example ions that were detected at masses 59, 69, and 155 as measured on 10 May, 2008. Whereas mass 59 most likely has the 20
structure of protonated acetone (C3H7O+), mass 69 and 155 cannot be attributed to a single molecular formula and different degrees of oxygenation have to be consid-ered. Data in green represent periods of gasphase measurements during which the CTD cell was loaded with aerosols (Tcol=172 min). Data in red represent the period of aerosol analysis during which the CTD cell was heated to 350◦C at a rate of 25 K/min 25
(tmeas=17 min). The cooling periods (blue data) were used to measure gasphase back-ground mixing ratios by passing the sample air stream through a heated platinum cat-alyst (T=350◦C) that removed all organic compounds. The aerosol background was
ACPD
9, 25983–26012, 2009PTR-TD-MS: a new approach to study organic aerosols
R. Holzinger et al.
Title Page
Abstract Introduction
Conclusions References
Tables Figures
◭ ◮
◭ ◮
Back Close
Full Screen / Esc
Printer-friendly Version
Interactive Discussion measured by analysing the unloaded CTD cell immediately after cooling (orange data
in Fig. 8). A full cycle was completed in 4 h. The signals of all aerosol measurements are clearly above the signals of the aerosol background measurements. The highest and lowest aerosol measurement in Fig. 8 (m59 at∼07:45 LT, and m155 at∼15:45 LT) correspond to an average aerosol concentration of 59 and 2.8 ng/m3, respectively, dur-5
ing the 172 min sampling period prior to the analysis. The detection limit depends on the background signal and was calculated as 3 times the standard error of the aerosol background signal. The detection limit was below 0.2 ng/m3for 67 and below 0.5 ng/m3 for 166 of the 200 monitored masses, respectively. This corresponds to 35–90 pg of collected mass of an aerosol compound. On 10 May, 2008, (i.e. the period shown in 10
Fig. 8) the signals of 181 masses were above the detection limit and their total concen-tration summed up to 1900 ng/m3.
Note that the background measurements during the field campaign had issues for both the gasphase and the aerosols. Many compounds showed unrealistically high concentrations during the gasphase background measurements due to a malfunction-15
ing pressure controller that failed to compensate for the higher resistance of the inlet line when the air was streamed through the catalytic converter. The effect was a lower pressure in the drift tube and therefore the short-term contamination from the aerosol measurements contributed disproportionately to the background signal. Such an el-evated background signal has been observed for many masses; an example can be 20
seen in the second panel of Fig. 8 were the gasphase background of mass 69 is above the values of ambient air. The aerosol background measurements do not account for effects from semi-volatile gas phase compounds that may also stick to the walls of the CTD cell and may evaporate along with aerosol compounds during the analysis. Ide-ally the aerosol background is determined by loading the CTD cell through a filter that 25
ACPD
9, 25983–26012, 2009PTR-TD-MS: a new approach to study organic aerosols
R. Holzinger et al.
Title Page
Abstract Introduction
Conclusions References
Tables Figures
◭ ◮
◭ ◮
Back Close
Full Screen / Esc
Printer-friendly Version
Interactive Discussion
3.3 Comparison of thermograms obtained from chamber aerosol with thermograms obtained from ambient aerosol.
Figure 9a juxtaposes the average thermograms (mass range was 30–220 Da) obtained from chamber SOA and from ambient samples. The first and most striking feature of these data is that the chamber SOA evaporates at much lower temperatures than 5
ambient OA samples. The lab SOA does not look like ambient OA. This finding applies to SOA generated in the lab from reactions of ozone andα-pinene, limonene, andβ -caryophyllene, and likewise to ambient OA obtained under clear and rainy “continental” and clear “marine” conditions.
Figure 9b shows that the thermograms of ambient aerosol are different for the three 10
source regions. The photochemically younger aerosol from the 13–16 May period is slightly more volatile than the more aged aerosol from the 9–12 May period. Both these periods are significantly more volatile than the (presumably) very aged aerosol sampled during the period of marine influence (17–20 May).
Average thermograms of different mass ranges from ambient data are shown in 15
Fig. 9c. As compared to electron-ionization typically employed in aerosol mass spec-trometry (AMS), our PTR-TD-MS data are substantially less fragmented, with numer-ous large peaks in the 100–220 Da range. Thus we can potentially gain some insight into the molecular weight of the compounds evolving from the thermal desorption sam-pler. Nonetheless, the PTR-TD-MS data also contain a significant mass fraction in 20
relatively light fragments, below 100 Da. Molecules of this low molecular weight are highly unlikely to be found in the condensed phase as monomers (Pankow and Asher, 2008), and so it is very likely that these are fragments produced either after proton transfer or during thermal desorption. Consistent with this hypothesis, the lightest frac-tions in Fig. 9c evolve at the highest temperatures, suggesting that these are indeed 25
associated with the least volatile organics in the sample. An interesting parallel is found in AMS thermodenuder data, where the OOA factors are dominated by low molecu-lar weight fragments but also are much less volatile than the more reduced primary
ACPD
9, 25983–26012, 2009PTR-TD-MS: a new approach to study organic aerosols
R. Holzinger et al.
Title Page
Abstract Introduction
Conclusions References
Tables Figures
◭ ◮
◭ ◮
Back Close
Full Screen / Esc
Printer-friendly Version
Interactive Discussion aerosol (HOA), which in turn has a characteristic “picket fence” spectrum extending out
to relatively highm/z (Huffman et al., 2009; Zhang et al., 2007).
The comparison of thermograms clearly shows that conventional chamber SOA ex-periments do not produce organic aerosol that looks like ambient OA samples from the perspective of the PTR-TD-MS system. Even the most volatile molecular weight 5
fraction (161–219 Da) from the ambient data is much less volatile than the chamber aerosol. The issue is not that chamber experiments are wrong, but rather that they may be incomplete. From precursor emission to deposition, organic aerosols are be-lieved to reside in the atmosphere for roughly one week if they remain in the boundary layer, or many weeks if they escape to the free troposphere (Williams et al., 2002). 10
However, chamber experiments typically only span a few hours. Gas-phase oxidation (by OH radicals) thus appears to be a part of the ambient aging process. Several other plausible mechanisms have been proposed, however, and in all likelihood several do play a role in the real world. To test these different mechanisms, the less fragmented spectra obtained in the PTR-TD-MS may prove vital. The new development of a high 15
mass resolution PTR-TD-MS (equipped with a time-of-flight mass spectrometer) has a high potential to provide insight into these mechanisms because the high mass res-olution allows an accurate measurement of the degree of oxygenation of the organic aerosol.
4 Conclusions
20
We successfully developed a new analytical approach for quantitative analysis of or-ganic aerosol. The PTR-TD-MS instrument directly quantifies a fraction of 55–80% of organic aerosol. Controlled thermo-desorption from the collection cell gives additional information on the volatility of aerosol compounds and a comparison of thermograms from chamber aerosol and ambient aerosol revealed large differences between these 25
ACPD
9, 25983–26012, 2009PTR-TD-MS: a new approach to study organic aerosols
R. Holzinger et al.
Title Page
Abstract Introduction
Conclusions References
Tables Figures
◭ ◮
◭ ◮
Back Close
Full Screen / Esc
Printer-friendly Version
Interactive Discussion and good physicochemical characterization of organic aerosol indicate the high
poten-tial of this technique for future applications which goes beyond of what is presented here. Unlike other aerosol instruments our approach is sensitive also to intermediate volatility and semi-volatile compounds and it provides the option for combined in situ gas phase and aerosol measurements of such compounds. Better quantification of the 5
degree of oxygenation of organic aerosols and a better elucidation of corresponding chemical oxidation processes are other promising areas of application for this instru-ment.
Acknowledgements. We thank the colleagues from KNMI and the Cabauw team for support during the field measurements. R. Winterhalter is gratefully acknowledged for maintaining the
10
SMPS system. This work was partly funded by The Netherlands Organization for Scientific Research (NWO) under the ALW-Middelgroot program (Grant 834.08.002).
References
Aiken, A. C., Decarlo, P. F., Kroll, J. H., Worsnop, D. R., Huffman, J. A., Docherty, K. S., Ul-brich, I. M., Mohr, C., Kimmel, J. R., Sueper, D., Sun, Y., Zhang, Q., Trimborn, A.,
North-15
way, M., Ziemann, P. J., Canagaratna, M. R., Onasch, T. B., Alfarra, M. R., Prevot, A. S. H., Dommen, J., Duplissy, J., Metzger, A., Baltensperger, U., and Jimenez, J. L.: O/C and OM/OC ratios of primary, secondary, and ambient organic aerosols with high-resolution time-of-flight aerosol mass spectrometry, Environ. Sci. Technol., 42, 4478–4485, 2008.
DeCarlo, P. F., Kimmel, J. R., Trimborn, A., Northway, M. J., Jayne, J. T., Aiken, A. C., Gonin, M.,
20
Fuhrer, K., Horvath, T., Docherty, K. S., Worsnop, D. R., and Jimenez, J. L.: Field-deployable, high-resolution, time-of-flight aerosol mass spectrometer, Anal. Chem., 78, 8281–8289, 2006.
Demarcke, M., Amelynck, C., Schoon, N., Dhooghe, F., Van Langenhove, H., and Dewulf, J.: Laboratory studies in support of the detection of sesquiterpenes by
proton-transfer-reaction-25
mass-spectrometry, Int. J. Mass Spectrom., 279, 156–162, 2009.
Donahue, N. M., Robinson, A. L., Stanier, C. O., and Pandis, S. N.: Coupled partitioning, dilution, and chemical aging of semivolatile organics, Environ. Sci. Technol., 40, 2635–2643, 2006.
ACPD
9, 25983–26012, 2009PTR-TD-MS: a new approach to study organic aerosols
R. Holzinger et al.
Title Page
Abstract Introduction
Conclusions References
Tables Figures
◭ ◮
◭ ◮
Back Close
Full Screen / Esc
Printer-friendly Version
Interactive Discussion
Ervens, B., Carlton, A. G., Turpin, B. J., Altieri, K. E., Kreidenweis, S. M., and Feingold, G.: Sec-ondary organic aerosol yields from cloud-processing of isoprene oxidation products, Geo-phys. Res. Lett., 35, L02816, doi:10.1029/2007GL031828, 2008.
Goldstein, A. H. and Galbally, I. E.: Known and unexplored organic constituents in the earth’s atmosphere, Environ. Sci. Technol., 41, 1514–1521, 2007.
5
Grieshop, A. P., Logue, J. M., Donahue, N. M., and Robinson, A. L.: Laboratory investigation of photochemical oxidation of organic aerosol from wood fires 1: measurement and simulation of organic aerosol evolution, Atmos. Chem. Phys., 9, 1263–1277, 2009,
http://www.atmos-chem-phys.net/9/1263/2009/.
Hallquist, M., Wenger, J. C., Baltensperger, U., Rudich, Y., Simpson, D., Claeys, M., Dommen,
10
J., Donahue, N. M., George, C., Goldstein, A. H., Hamilton, J. F., Herrmann, H., Hoffmann, T., Iinuma, Y., Jang, M., Jenkin, M. E., Jimenez, J. L., Kiendler-Scharr, A., Maenhaut, W., McFiggans, G., Mentel, Th. F., Monod, A., Pr ´ev ˆot, A. S. H., Seinfeld, J. H., Surratt, J. D., Szmigielski, R., and Wildt, J.: The formation, properties and impact of secondary organic aerosol: current and emerging issues, Atmos. Chem. Phys., 9, 5155–5235, 2009,
15
http://www.atmos-chem-phys.net/9/5155/2009/.
Hansel, A., Jordan, A., Holzinger, R., Prazeller, P., Vogel, W., and Lindinger, W.: Proton-transfer reaction mass-spectrometry – online trace gas- analysis at the ppb level, Int. J. Mass Spec-trom., 150, 609–619, 1995.
Heald, C. L., Goldstein, A. H., Allan, J. D., Aiken, A. C., Apel, E., Atlas, E. L., Baker, A. K.,
20
Bates, T. S., Beyersdorf, A. J., Blake, D. R., Campos, T., Coe, H., Crounse, J. D., DeCarlo, P. F., de Gouw, J. A., Dunlea, E. J., Flocke, F. M., Fried, A., Goldan, P., Griffin, R. J., Herndon, S. C., Holloway, J. S., Holzinger, R., Jimenez, J. L., Junkermann, W., Kuster, W. C., Lewis, A. C., Meinardi, S., Millet, D. B., Onasch, T., Polidori, A., Quinn, P. K., Riemer, D. D., Roberts, J. M., Salcedo, D., Sive, B., Swanson, A. L., Talbot, R., Warneke, C., Weber, R. J., Weibring,
25
P., Wennberg, P. O., Worsnop, D. R., Wittig, A. E., Zhang, R., Zheng, J., and Zheng, W.: Total observed organic carbon (TOOC) in the atmosphere: a synthesis of North American observations, Atmos. Chem. Phys., 8, 2007–2025, 2008,
http://www.atmos-chem-phys.net/8/2007/2008/.
Hearn, J. D. and Smith, G. D.: A chemical ionization mass spectrometry method for the online
30
analysis of organic aerosols, Anal. Chem., 76, 2820–2826, 2004.
ACPD
9, 25983–26012, 2009PTR-TD-MS: a new approach to study organic aerosols
R. Holzinger et al.
Title Page
Abstract Introduction
Conclusions References
Tables Figures
◭ ◮
◭ ◮
Back Close
Full Screen / Esc
Printer-friendly Version
Interactive Discussion
of secondary organic aerosols, Environ. Sci. Technol., 42, 7347–7353, 2008.
Hildebrandt, L., Donahue, N. M., and Pandis, S. N.: High formation of secondary organic aerosol from the photo-oxidation of toluene, Atmos. Chem. Phys., 9, 2973–2986, 2009, http://www.atmos-chem-phys.net/9/2973/2009/.
Holzinger, R., Millet, D. B., Williams, B., Lee, A., Kreisberg, N., Hering, S. V., Jimenez, J.,
Al-5
lan, J. D., Worsnop, D. R., and Goldstein, A. H.: Emission, oxidation, and secondary organic aerosol formation of volatile organic compounds as observed at Chebogue Point, Nova Sco-tia, J. Geophys. Res.-Atmos., 112, D10S24, doi:10.1029/2006JD007599, 2007.
Huffman, J. A., Docherty, K. S., Aiken, A. C., Cubison, M. J., Ulbrich, I. M., DeCarlo, P. F., Sueper, D., Jayne, J. T., Worsnop, D. R., Ziemann, P. J., and Jimenez, J. L.:
Chemically-10
resolved aerosol volatility measurements from two megacity field studies, Atmos. Chem. Phys., 9, 7161–7182, 2009,
http://www.atmos-chem-phys.net/9/7161/2009/.
Kanakidou, M., Seinfeld, J. H., Pandis, S. N., Barnes, I., Dentener, F. J., Facchini, M. C., Van Dingenen, R., Ervens, B., Nenes, A., Nielsen, C. J., Swietlicki, E., Putaud, J. P., Balkanski,
15
Y., Fuzzi, S., Horth, J., Moortgat, G. K., Winterhalter, R., Myhre, C. E. L., Tsigaridis, K., Vignati, E., Stephanou, E. G., and Wilson, J.: Organic aerosol and global climate modelling: a review, Atmos. Chem. Phys., 5, 1053–1123, 2005,
http://www.atmos-chem-phys.net/5/1053/2005/.
Kroll, J. H., Ng, N. L., Murphy, S. M., Flagan, R. C., and Seinfeld, J. H.: Secondary organic
20
aerosol formation from isoprene photooxidation, Environ. Sci. Technol., 40, 1869–1877, 2006.
Kroll, J. H., Ng, N. L., Murphy, S. M., Varutbangkul, V., Flagan, R. C., and Seinfeld, J. H.: Chamber studies of secondary organic aerosol growth by reactive uptake of simple carbonyl compounds, J. Geophys. Res.-Atmos., 110, D23207, doi:10.1029/2005JD006004, 2005.
25
Lanz, V. A., Alfarra, M. R., Baltensperger, U., Buchmann, B., Hueglin, C., Szidat, S., Wehrli, M. N., Wacker, L., Weimer, S., Caseiro, A., Puxbaum, H., and Prevot, A. S. H.: Source attribution of submicron organic aerosols during wintertime inversions by advanced factor analysis of aerosol mass spectra, Environ. Sci. Technol., 42, 214–220, 2008.
Lindinger, W., Hansel, A., and Jordan, A.: On-line monitoring of volatile organic compounds
30
at pptv levels by means of proton-transfer-reaction mass spectrometry (PTR-MS) – medical applications, food control and environmental research, Int. J. Mass Spectrom., 173, 191–241, 1998.
ACPD
9, 25983–26012, 2009PTR-TD-MS: a new approach to study organic aerosols
R. Holzinger et al.
Title Page
Abstract Introduction
Conclusions References
Tables Figures
◭ ◮
◭ ◮
Back Close
Full Screen / Esc
Printer-friendly Version
Interactive Discussion
Ng, N. L., Kroll, J. H., Chan, A. W. H., Chhabra, P. S., Flagan, R. C., and Seinfeld, J. H.: Secondary organic aerosol formation fromm-xylene, toluene, and benzene, Atmos. Chem. Phys., 7, 3909–3922, 2007,
http://www.atmos-chem-phys.net/7/3909/2007/.
Pankow, J. F. and Asher, W. E.: SIMPOL.1: a simple group contribution method for predicting
5
vapor pressures and enthalpies of vaporization of multifunctional organic compounds, At-mos. Chem. Phys., 8, 2773–2796, 2008,
http://www.atmos-chem-phys.net/8/2773/2008/.
Paulot, F., Crounse, J. D., Kjaergaard, H. G. K ¨urten, A., St. Clair, J. M., Seinfeld, J. H., and Wennberg, P. O.: Unexpected epoxide formation in the gas-phase photooxidation of
iso-10
prene, Science, 325, 730–733, 2009.
Robinson, A. L., Donahue, N. M., Shrivastava, M. K., Weitkamp, E. A., Sage, A. M., Grieshop, A. P., Lane, T. E., Pierce, J. R., and Pandis, S. N.: Rethinking organic aerosols: Semivolatile emissions and photochemical aging, Science, 315, 1259–1262, 2007.
Thornberry, T., Murphy, D. M., Thomson, D. S., de Gouw, J., Warneke, C., Bates, T. S.,
15
Quinn, P. K., and Coffman, D.: Measurement of aerosol organic compounds using a novel collection/thermal-desorption PTR-ITMS instrument, Aerosol Sci. Tech., 43, 486–501, 2009. Volkamer, R., Jimenez, J. L., San Martini, F., Dzepina, K., Zhang, Q., Salcedo, D., Molina, L. T.,
Worsnop, D. R., and Molina, M. J.: Secondary organic aerosol formation from anthro-pogenic air pollution: Rapid and higher than expected, Geophys. Res. Lett., 33, L17811,
20
doi:10.1029/2006GL026899, 2006.
Volkamer, R., Martini, F. S., Molina, L. T., Salcedo, D., Jimenez, J. L., and Molina, M. J.: A miss-ing sink for gas-phase glyoxal in Mexico City: Formation of secondary organic aerosol, Geo-phys. Res. Lett., 34, L19807, doi:10.1029/2007GL030752, 2007.
Williams, B. J., Goldstein, A. H., Kreisberg, N. M., and Hering, S. V.: An in-situ instrument
25
for speciated organic composition of atmospheric aerosols: Thermal Desorption Aerosol GC/MS-FID (TAG), Aerosol Sci. Tech., 40, 627–638, 2006.
Williams, J., de Reus, M., Krejci, R., Fischer, H., and Str ¨om, J.: Application of the variability-size relationship to atmospheric aerosol studies: estimating aerosol lifetimes and ages, Atmos. Chem. Phys., 2, 133–145, 2002,
30
http://www.atmos-chem-phys.net/2/133/2002/.
De-ACPD
9, 25983–26012, 2009PTR-TD-MS: a new approach to study organic aerosols
R. Holzinger et al.
Title Page
Abstract Introduction
Conclusions References
Tables Figures
◭ ◮
◭ ◮
Back Close
Full Screen / Esc
Printer-friendly Version
Interactive Discussion
Carlo, P. F., Salcedo, D., Onasch, T., Jayne, J. T., Miyoshi, T., Shimono, A., Hatakeyama, S., Takegawa, N., Kondo, Y., Schneider, J., Drewnick, F., Borrmann, S., Weimer, S., Demer-jian, K., Williams, P., Bower, K., Bahreini, R., Cottrell, L., Griffin, R. J., Rautiainen, J., Sun, J. Y., Zhang, Y. M., and Worsnop, D. R.: Ubiquity and dominance of oxygenated species in organic aerosols in anthropogenically-influenced Northern Hemisphere midlatitudes,
Geo-5
phys. Res. Lett., 34, L13801, doi:10.1029/2007GL029979, 2007.
Zhao, J., and Zhang, R. Y.: Proton transfer reaction rate constants between hydronium ion (H3O(+)) and volatile organic compounds, Atmos. Environ., 38, 2177–2185, 2004.
ACPD
9, 25983–26012, 2009PTR-TD-MS: a new approach to study organic aerosols
R. Holzinger et al.
Title Page
Abstract Introduction
Conclusions References
Tables Figures
◭ ◮
◭ ◮
Back Close
Full Screen / Esc
Printer-friendly Version
Interactive Discussion Fig. 1. Schematic drawing of the setup. Areas marked in red were operated at high
tempera-tures of 200◦
ACPD
9, 25983–26012, 2009PTR-TD-MS: a new approach to study organic aerosols
R. Holzinger et al.
Title Page
Abstract Introduction
Conclusions References
Tables Figures
◭ ◮
◭ ◮
Back Close
Full Screen / Esc
Printer-friendly Version
Interactive Discussion Fig. 2.Fractional transmission efficiency of the PTR-MS quadrupole mass spectrometer.
ACPD
9, 25983–26012, 2009PTR-TD-MS: a new approach to study organic aerosols
R. Holzinger et al.
Title Page
Abstract Introduction
Conclusions References
Tables Figures
◭ ◮
◭ ◮
Back Close
Full Screen / Esc
Printer-friendly Version
Interactive Discussion
α
ACPD
9, 25983–26012, 2009PTR-TD-MS: a new approach to study organic aerosols
R. Holzinger et al.
Title Page
Abstract Introduction
Conclusions References
Tables Figures
◭ ◮
◭ ◮
Back Close
Full Screen / Esc
Printer-friendly Version
Interactive Discussion Fig. 4.Two examples of compounds constituting chamber aerosol that was produced from(A)
b-caryophyllene and(B)limonene ozonolysis.
ACPD
9, 25983–26012, 2009PTR-TD-MS: a new approach to study organic aerosols
R. Holzinger et al.
Title Page
Abstract Introduction
Conclusions References
Tables Figures
◭ ◮
◭ ◮
Back Close
Full Screen / Esc
Printer-friendly Version
Interactive Discussion Fig. 5. Evolution of aerosol mass during ozonolysis of b-caryophyllene, limonene, and
ACPD
9, 25983–26012, 2009PTR-TD-MS: a new approach to study organic aerosols
R. Holzinger et al.
Title Page
Abstract Introduction
Conclusions References
Tables Figures
◭ ◮
◭ ◮
Back Close
Full Screen / Esc
Printer-friendly Version
Interactive Discussion Fig. 6. Typical thermograms of organic compounds from secondary organic aerosol produced
from ozone and terpenes. The individual thermograms are normalized. With increasing aerosol age the aerosol compounds evaporate at slightly higher temperatures.
ACPD
9, 25983–26012, 2009PTR-TD-MS: a new approach to study organic aerosols
R. Holzinger et al.
Title Page
Abstract Introduction
Conclusions References
Tables Figures
◭ ◮
◭ ◮
Back Close
Full Screen / Esc
Printer-friendly Version
Interactive Discussion
α
ACPD
9, 25983–26012, 2009PTR-TD-MS: a new approach to study organic aerosols
R. Holzinger et al.
Title Page
Abstract Introduction
Conclusions References
Tables Figures
◭ ◮
◭ ◮
Back Close
Full Screen / Esc
Printer-friendly Version
Interactive Discussion Fig. 8.Mixing ratios of example compounds measured during the EUCAARI-IOP campaign on
10 May 2008. The color code specifies what was measured. The highest and lowest aerosol measurement (m59 at∼7:45 LT, and m155 at∼15:45 LT) correspond to an average aerosol concentration of 59 and 2.8 ng/m3, respectively, during the 172 min sampling period prior to the analysis.
ACPD
9, 25983–26012, 2009PTR-TD-MS: a new approach to study organic aerosols
R. Holzinger et al.
Title Page
Abstract Introduction
Conclusions References
Tables Figures
◭ ◮
◭ ◮
Back Close
Full Screen / Esc
Printer-friendly Version
Interactive Discussion Fig. 9. (A)Averaged thermograms for all masses measured with a PTR-TD-MS for ambient