ACPD
15, 13395–13455, 2015Modeling organic aerosol composition
at the puy de Dôme mountain
C. Barbet et al.
Title Page
Abstract Introduction
Conclusions References
Tables Figures
◭ ◮
◭ ◮
Back Close
Full Screen / Esc
Printer-friendly Version Interactive Discussion
Discussion
P
a
per
|
Discussion
P
a
per
|
Discussion
P
a
per
|
Discussion
P
a
per
Atmos. Chem. Phys. Discuss., 15, 13395–13455, 2015 www.atmos-chem-phys-discuss.net/15/13395/2015/ doi:10.5194/acpd-15-13395-2015
© Author(s) 2015. CC Attribution 3.0 License.
This discussion paper is/has been under review for the journal Atmospheric Chemistry and Physics (ACP). Please refer to the corresponding final paper in ACP if available.
Modeling organic aerosol composition at
the puy de Dôme mountain (France) for
two contrasted air masses with the
WRF-Chem model
C. Barbet1,2, L. Deguillaume1,2, N. Chaumerliac1,2, M. Leriche3,4, A. Berger3,4,
E. Freney1,2, A. Colomb1,2, K. Sellegri1,2, L. Patryl5, and P. Armand5
1
Université Clermont Auvergne, Université Blaise Pascal, OPGC, Laboratoire de Météorologie Physique, BP 10448, 63000 Clermont-Ferrand, France
2
CNRS, LaMP/OPGC, UMR6016, BP80026, 63177 Aubière, France
3
Université de Toulouse, UPS, Laboratoire d’Aérologie, 14 avenue Edouard Belin, 31400 Toulouse, France
4
CNRS, LA, UMR 5560, 31400 Toulouse, France
5
CEA, DAM, DIF, 91297 Arpajon, France
ACPD
15, 13395–13455, 2015Modeling organic aerosol composition
at the puy de Dôme mountain
C. Barbet et al.
Title Page
Abstract Introduction
Conclusions References
Tables Figures
◭ ◮
◭ ◮
Back Close
Full Screen / Esc
Printer-friendly Version Interactive Discussion
Discussion
P
a
per
|
Discussion
P
a
per
|
Discussion
P
a
per
|
Discussion
P
a
per
|
Abstract
Simulations with the chemistry-transport model WRF-Chem are compared to aerosol measurements performed at the puy de Dôme station with a compact Time-of-Flight Aerosol Mass Spectrometer (cToF-AMS) for two episodes in autumn 2008 and in sum-mer 2010. The WRF-Chem model is used with the Volatility Basis Set (VBS) approach
5
dedicated to the formation of secondary organic aerosol (SOA). The model systemati-cally underestimates the observed concentrations of organic aerosol (OA), with signif-icant differences observed for the summer case. For this event, where high OA con-centrations were observed (12.5 µg m−3in average), simulated OA mass concentration is 2.0 µg m−3. For the autumn event, observed OA concentrations reached 2.6 µg m−3.
10
The simulated concentrations reached only 0.6 µg m−3.
During the summer event, several gas-phase volatile organic compounds (VOCs) were measured and were used to test the robustness of both emission/dry deposi-tion and SOA formadeposi-tion processes. The concentradeposi-tions of VOCs, and more specifi-cally the anthropogenic ones, calculated by the model are estimated to be much lower
15
than the observed ones. Hence, the emissions of all SOA precursors are multiplied by 2 in the model: this induces an increase of the mean OA mass concentration of 25 % (+0.5 µg m−3) and 18 % (+0.4 µg m−3), respectively for anthropogenic and bio-genic VOCs. The dry deposition of gas-phase organic condensable vapours (OCVs) is also critical to predict the SOA mass concentrations: dividing the deposition
fac-20
tor by 2 leads to an increase of OA mass by an additional 12 % (+0.2 µg m−3). How-ever, these increases were not sufficient to explain the observed OA concentration, and the underestimation of the OA concentration levels seems to be principally related to a lack in the parameterization of SOA formation. Changing the oxidation rate of OCVs from 1.0×10⁻¹¹to 4.0×10⁻¹¹cm3molecule−1s−1, doubling the SOA yields for
anthro-25
deposi-ACPD
15, 13395–13455, 2015Modeling organic aerosol composition
at the puy de Dôme mountain
C. Barbet et al.
Title Page
Abstract Introduction
Conclusions References
Tables Figures
◭ ◮
◭ ◮
Back Close
Full Screen / Esc
Printer-friendly Version Interactive Discussion
Discussion
P
a
per
|
Discussion
P
a
per
|
Discussion
P
a
per
|
Discussion
P
a
per
tion and SOA formation processes tests lead to a mean OA mass concentration of 10.7 µg m−3 for 2010, a value that is close to the observations. For 2008, modifying
solely the oxidation rate of OCVs and the SOA yields is sufficient to reproduce the ob-served level of mean OA mass (a mass of 2.4 µg m−3is obtained by the model whereas a mass of 2.6 µg m−3was observed).
5
1 Introduction
In the atmosphere, aerosol particles play key roles on climate, air quality, and human health (IPCC, 2013). These particles are composed of a complex mixture of organic and inorganic species originating from both biogenic and anthropogenic sources. Par-ticulate organic matter comes from primary organic aerosols (POA) directly emitted
10
to the atmosphere. Secondary organic aerosols (SOA) are formed through chemical reactions that convert more volatile species into lower volatility products, which are then distributed in the particulate phase. Organic aerosols (OA) represent a large frac-tion (from 20 to 90 %) of the submicron particulate mass at both urban and remote locations (Zhang et al., 2007), and they are mainly composed of secondary organic
15
aerosols (from 63 to 95 %; Ng et al., 2010b; Zhang et al., 2011). Despite the ubiq-uity of OA in the atmosphere, there are still large uncertainties in understanding the formation pathways of SOA (Kanakidou et al., 2005). Consequently, OA sources and physico-chemical transformations during their transport remain poorly represented in Chemistry-Transport Models (CTMs) (Hallquist et al., 2009; Volkamer et al., 2006).
20
Field measurements clearly demonstrate that the main sources of organic aerosols over the European continent in winter are the gaseous precursors and the primary particles emitted by the human activities (use of fossil fuels and biomass burning), whereas biogenic sources are predominant in summer (Gelencsér et al., 2007; Szidat et al., 2006). Analysis of organic aerosol mass spectra measured from an Aerosol Mass
25
ACPD
15, 13395–13455, 2015Modeling organic aerosol composition
at the puy de Dôme mountain
C. Barbet et al.
Title Page
Abstract Introduction
Conclusions References
Tables Figures
◭ ◮
◭ ◮
Back Close
Full Screen / Esc
Printer-friendly Version Interactive Discussion
Discussion
P
a
per
|
Discussion
P
a
per
|
Discussion
P
a
per
|
Discussion
P
a
per
|
of primary emissions, and oxygenated organic aerosol (OOA) resulting from chemical transformations and gas-phase condensation (Aiken et al., 2008; Zhang et al., 2005). As HOA mainly results from the combustion sources, their contribution to the organic aerosol is important during winter, while the OOA fraction is predominant during sum-mer (Lanz et al., 2010).
5
In the last decade, a large number of intensive field campaigns have been per-formed to characterize the inorganic and organic mass concentrations of the atmo-spheric aerosol, as well as the molecular composition of the organic particulate matter. Aircraft and ground-based measurements showed that aerosol species concentrations in the boundary layer are higher than those observed in the free troposphere. Some
10
measurements also highlighted that mass contribution of organic aerosol to the total particulate matter is higher in the free troposphere than in the boundary layer (Crumey-rolle et al., 2013a, b; Heald et al., 2006; Murphy et al., 2006). The origin of air masses also determines the mass concentrations of the organic aerosols: high concentrations have been measured for air masses transported over polluted areas (Freney et al.,
15
2011; Freutel et al., 2013). Even though these in situ observations provide informa-tion on the aerosol sources, as well as concentrainforma-tion levels, they are not numerous enough to describe the spatiotemporal size and chemical distribution of these parti-cles (Kulmala et al., 2011; Zhang et al., 2007). Only very recently, the work of Crippa et al. (2014) offered, with measurements from 17 sites, including the puy de Dôme
20
(PUY) station (France), an unprecedented overview of OA sources in Europe. However, even when widespread, observations are rather difficult to interpret in term of source identification/quantification and in term of chemical/physical processes responsible for the observed concentrations.
Chemistry-transport models allow linking the physical-chemical behaviour of gas
25
ACPD
15, 13395–13455, 2015Modeling organic aerosol composition
at the puy de Dôme mountain
C. Barbet et al.
Title Page
Abstract Introduction
Conclusions References
Tables Figures
◭ ◮
◭ ◮
Back Close
Full Screen / Esc
Printer-friendly Version Interactive Discussion
Discussion
P
a
per
|
Discussion
P
a
per
|
Discussion
P
a
per
|
Discussion
P
a
per
loss of process information (e.g. cloud/radiation feedbacks for example) because the physical and chemical processes usually occur on a time scale smaller than the time step of the meteorological model (Zhang, 2008). In “online” models where meteorolog-ical and chemmeteorolog-ical processes are solved simultaneously on the same grid, the errors in vertical mass distribution are smaller than in “offline” models because the strong
vari-5
ability in vertical velocity is attributable to high frequency motions (periods less than 10 min) (Baklanov et al., 2014). Online models allow simulating complex aerosol-cloud-radiation feedbacks, solving physical and chemical processes on the same grid and at the same time, exclude numerical problems resulting from spatiotemporal interpolation of meteorological fields (Grell et al., 2004).
10
Currently, large gaps still remain between simulated and measured SOA concen-trations: 3-D models tend to underestimate SOA concentrations both at regional and global scales and especially during summertime periods (Carlton et al., 2010; Knote et al., 2011; Yu et al., 2007). The models underestimate the SOA mass formed by a factor ranging from 8 to 100 in both the boundary layer (Kleinman et al., 2008;
Volka-15
mer et al., 2006) and in the free troposphere (Heald et al., 2005). This underestimation is much more important in polluted areas (Heald et al., 2005; Hodzic et al., 2010; Volkamer et al., 2006) compared to remote areas located away from anthropogenic emission sources for which simulated SOA concentrations are closer to observations (Chen et al., 2009; Hodzic et al., 2009; Slowik et al., 2010). The most recent
gener-20
ation of models appear to be particularly challenged in regions where anthropogenic and biogenic emissions mix and have suggested that anthropogenic emissions en-hance SOA formation from biogenic volatile organic compounds (Emanuelsson et al., 2013; Shilling et al., 2013). Carlton et al. (2010) estimate that approximately 50 % of the total biogenic SOA loading is from “anthropogenically-controlled” biogenic SOA while
25
Spracklen et al. (2011) come to an estimate of 70 %.
ACPD
15, 13395–13455, 2015Modeling organic aerosol composition
at the puy de Dôme mountain
C. Barbet et al.
Title Page
Abstract Introduction
Conclusions References
Tables Figures
◭ ◮
◭ ◮
Back Close
Full Screen / Esc
Printer-friendly Version Interactive Discussion
Discussion
P
a
per
|
Discussion
P
a
per
|
Discussion
P
a
per
|
Discussion
P
a
per
|
complexity of volatile organic compounds (VOCs) identified in the atmosphere (Gold-stein and Galbally, 2007), chemical species with similar characteristics (reactivity, func-tional groups, volatility, . . . ) are aggregated into one model species. This assumption can lead to potential errors in the chemical treatment of VOCs and thereby in SOA formation. Also, SOA formation pathways are sketched in transport models using
pa-5
rameterizations such as the most recent one called Volatility Basis Set (VBS) approach (Donahue et al., 2006), which is based upon SOA yields and VOCs oxidation rates that have been evaluated in simulation chambers under controlled conditions (pressure and temperature, chemical concentrations, humidity, etc.) that are far from real atmospheric conditions (Hao et al., 2011).
10
In this study, the central objective will be the evaluation of such uncertainties using the WRF-CHEM model (Weather Research and Forecasting – Chemistry; Grell et al., 2005) to simulate SOA formation. Due to its versatility, WRF-Chem is attracting a large user and developer community worldwide (Baklanov et al., 2014). In Europe, it is being used for regional air quality studies (Ritter et al., 2013; Solazzo et al., 2012; Tuccella
15
et al., 2012), for the impact of emissions from megacities, and for the impact of biomass burning and biogenic emissions on elevated ozone levels during the 2007 European hot summer (Hodnebrog et al., 2012). WRF-Chem is continually developed, improved and additional options are being implemented such as parameterizations for SOA formation (Ahmadov et al., 2012).
20
This paper will evaluate the ability of the WRF-CHEM model to reproduce the organic aerosol mass concentration originated from anthropogenic or/and biogenic emissions for two contrasted air masses. The model output will be compared to data available at the PUY station (France). For the first time, the detailed aerosol chemical composition from AMS measurements combined with measurements of their gas phase
precur-25
ACPD
15, 13395–13455, 2015Modeling organic aerosol composition
at the puy de Dôme mountain
C. Barbet et al.
Title Page
Abstract Introduction
Conclusions References
Tables Figures
◭ ◮
◭ ◮
Back Close
Full Screen / Esc
Printer-friendly Version Interactive Discussion
Discussion
P
a
per
|
Discussion
P
a
per
|
Discussion
P
a
per
|
Discussion
P
a
per
the OA formation (emission/dry deposition vs. SOA formation processes) in the WRF-Chem model.
2 Modeling observed situations at the puy de Dôme (France)
2.1 Model set up
The model used in this study is the version 3.4.1 of the WRF-Chem model (Grell et al.,
5
2005). WRF-Chem is an online model with state-of-the-art formulations of physical and chemical parameterizations and especially for the formation and aging of aerosols. The simulations last one week, which is the timescale of interest for simulating SOA formation episodes. Two nested domains are used as shown in Fig. S1. The coarse domain is located over Europe with a spatial resolution of 30 km and defined by 73 and
10
61 horizontal grid points respectively in the West–East and North–South directions. This domain is adapted to follow the origins of the air masses transported over the Atlantic Ocean, over the Mediterranean Sea or over continental area. The inner domain is located over France with a spatial resolution of 10 km and is defined by 130 and 97 horizontal grid points respectively in the West–East and North–South directions to
15
focus on a region including mountains around the PUY measurement station. Vertical levels are used with enhanced resolution in the near-surface and planetary boundary layer. This allows the model to better represent the lower layers of the atmosphere and more specifically the variations of the boundary layer height where atmospheric pollutants are emitted.
20
The initial and boundary meteorological conditions come from ERA-Interim Euro-pean reanalysis (Dee et al., 2011) provided by the EuroEuro-pean Centre for Medium-range Weather Forecast (ECMWF). They are available every 6 h with a horizontal resolu-tion of 0.5◦. The global model MOZART-4 (Emmons et al., 2010) provides initial and boundary conditions for concentrations of gaseous species and aerosol particles with
25
ACPD
15, 13395–13455, 2015Modeling organic aerosol composition
at the puy de Dôme mountain
C. Barbet et al.
Title Page
Abstract Introduction
Conclusions References
Tables Figures
◭ ◮
◭ ◮
Back Close
Full Screen / Esc
Printer-friendly Version Interactive Discussion
Discussion
P
a
per
|
Discussion
P
a
per
|
Discussion
P
a
per
|
Discussion
P
a
per
|
6 h. The correspondence established by Emmons et al. (2010) between the MOZART-4 chemical species and several chemical mechanisms implemented in the WRF-Chem model such as RACM (Stockwell et al., 1997) is used to allocate the concentrations of 35 gaseous species and all particulate compounds defined by MOZART-4 to the WRF-Chem model species.
5
The WRF-Chem model includes several options for physical parameterizations and the main options adopted in this paper are listed in Table 1. These include: the Noah Land Surface Model (Chen and Dudhia, 2001), the Yonsei University planetary bound-ary layer scheme (Hong et al., 2006), the Grell-Devenyi cumulus parameterization (Grell and Dévényi, 2002), the Rapid Radiation Transfer Model long-wave radiation
10
scheme (Mlawer et al., 1997), the Goddard shortwave radiation scheme (Chou et al., 1998) and the microphysical scheme of Morrison (Morrison et al., 2009). Chemical options used here are detailed in the next section.
2.2 Gas-phase mechanism and parameterization of SOA formation
The gas-phase chemical mechanism used is RACM (Stockwell et al., 1997), which
15
includes 84 species and 252 reactions. This mechanism takes into account the ox-idation of VOCs from both anthropogenic (alkanes, alkenes, . . . ) and biogenic (iso-prene, monoterpenes and sesquiterpenes) sources. Initially, the RACM mechanism implemented in the WRF-Chem model did not include sesquiterpenes. To take into account the contribution of these VOCs to SOA production, the sesquiterpenes class
20
was added within the RACM mechanism by Ahmadov et al. (2012) following the work of Papiez et al. (2009).
The WRF-Chem model commonly uses the aerosol module Modal Aerosol Dynam-ics Model for Europe (MADE; Ackermann et al., 1998) for the inorganic fraction coupled to the Secondary Organic Aerosol Model (SORGAM; Schell et al., 2001) for the organic
25
ACPD
15, 13395–13455, 2015Modeling organic aerosol composition
at the puy de Dôme mountain
C. Barbet et al.
Title Page
Abstract Introduction
Conclusions References
Tables Figures
◭ ◮
◭ ◮
Back Close
Full Screen / Esc
Printer-friendly Version Interactive Discussion
Discussion
P
a
per
|
Discussion
P
a
per
|
Discussion
P
a
per
|
Discussion
P
a
per
RACM gas-phase mechanism and the MADE inorganic aerosol module to the Volatility Basis Set (Ahmadov et al., 2012; Donahue et al., 2006, 2009; Lane et al., 2008; Murphy and Pandis, 2009) for the SOA formation. MADE/VBS in WRF-Chem uses the modal approach with three log-normally distributed modes (Aïtken, accumulation and coarse mode). The aerosol species treated in MADE/VBS are the main inorganic ions (NH+4,
5
NO−3, SO24−), elemental carbon (EC), organic matter (OM, primary and secondary OA), water, sea salt, and mineral dust.
Alkanes, alkenes, toluene, xylene, and cresol emitted by anthropogenic activities and isoprene, monoterpenes, and sesquiterpenes from biogenic sources are all oxi-dized by the hydroxyl radical HO•, ozone O3 or nitrate radicals NO•3 in the gas-phase
10
mechanism. Once these species are oxidized, the VBS parameterization is used to partition the organic matter produced between gas and aerosol phases according to their volatility. Donahue et al. (2006) have suggested that the numerous organic com-pounds present in the atmosphere can be described by lumping the species with similar volatilities in a decade of different volatilities bins established according to the
satura-15
tion concentration (C∗):C∗is ranging from 0.01 and 1 µg m−3
for “Low Volatile Organic Compounds” (LVOCs) and between 10 and 1000 µg m−3 for “Semi Volatile Organic
Compounds” (SVOCs). The “Intermediate Volatile Organic Compounds” (IVOCs) are characterized by saturation concentrations ranging from 1000 to 100 000 µg m−3. The 1-D-VBS parameterization by Ahmadov et al. (2012) used in WRF-Chem, includes
20
a four-bin volatility basis set with C∗ ranging from 1 to 1000 µg m−3 at 298 K and are
separated by one order of magnitude. In Ahmadov et al. (2012), the SOA yields are different for two regimes: high- and low-NOxconditions. Under low-NOx conditions, the peroxy radicals react preferentially with other peroxy radicals to form products that are characterised by lower volatilities and consequently higher SOA yields. Under
high-25
ACPD
15, 13395–13455, 2015Modeling organic aerosol composition
at the puy de Dôme mountain
C. Barbet et al.
Title Page
Abstract Introduction
Conclusions References
Tables Figures
◭ ◮
◭ ◮
Back Close
Full Screen / Esc
Printer-friendly Version Interactive Discussion
Discussion
P
a
per
|
Discussion
P
a
per
|
Discussion
P
a
per
|
Discussion
P
a
per
|
of Donahue et al. (2006), OCVs represented in that 1-D-VBS parameterization corre-spond to LVOCs (C∗
=1 µg m−3) and SVOCs (10 µg m−3< C∗ <1000 µg m−3). Among
OCVs, only SVOCs are aging and the oxidation processes are modeled using a rate constant for the reaction of OCVs with HO•radicals equal to 1.0×10⁻¹¹cm3molecule−1
s−1. After each oxidation reaction, the volatility of the OCVs is reduced by one order of
5
magnitude and the mass is increased by 7.5 % to account for supplementary oxygen atoms. The 1-D-VBS scheme neglects fragmentation processes whereas in the real at-mosphere, there might be an offset between functionalization (decreased volatility) and fragmentation (increased volatility) effects, especially for biogenic SOA (Donahue et al., 2011, 2012; Murphy et al., 2012). However, the 1-D-VBS approach still shows a better
10
performance than a functionalization and fragmentation scheme (Murphy et al., 2012) which requires too many parameterizations (e.g. functionalization kernel and function-alization/fragmentation branching ratio) that are poorly constrained (Jo et al., 2013).
The chemistry component of WRF-Chem adopts the radiative transfer TUV (Madronich, 1992). The dry deposition of gas-phase species is parameterized
ac-15
cording to Erisman et al. (1994) based on the resistance concept of Wesely (1989). For OCVs, the dry deposition velocity is assumed to be proportional to the deposi-tion velocity of nitric acid (HNO3) that is a very soluble gas (effective Henry’s law: H∗
=2.69×10¹³M atm−1). The ratio between dry deposition velocities of OCVs and dry
deposition of HNO3is determined through a factor (denoted by Ahmadov et al., 2012 as
20
“depo_fact”), which is set to 0.25 due to the lack of observations available to constraint it. For aerosol particle species, dry deposition is calculated according to the Wesely approach (Wesely and Hicks, 2000).
2.3 Emissions
Anthropogenic emissions are taken from the MACCity inventory (MACC/CityZEN EU
25
ACPD
15, 13395–13455, 2015Modeling organic aerosol composition
at the puy de Dôme mountain
C. Barbet et al.
Title Page
Abstract Introduction
Conclusions References
Tables Figures
◭ ◮
◭ ◮
Back Close
Full Screen / Esc
Printer-friendly Version Interactive Discussion
Discussion
P
a
per
|
Discussion
P
a
per
|
Discussion
P
a
per
|
Discussion
P
a
per
a monthly temporal resolution from 1990 to 2010, which allows the seasonal variations of gaseous species and aerosols emissions to be taken into account. MACCity provides emission fluxes for carbon monoxide (CO), sulfur dioxide (SO2), ammoniac (NH3), ni-trogen oxide (NOx), Volatile Organic Compounds (VOCs), organic carbon (OC) and elemental carbon (EC).
5
Contrary to others European inventories such as EMEP (Vestreng et al., 2007) or TNO-MACC (Denier Van der Gon et al., 2011), MACCity better discriminates VOCs compounds and provides the emission rates of several VOCs like ethane, propane, and ethene. This facilitates the distribution of the 19 chemical species present in the emis-sion inventory into the chemical species considered in the chemical mechanism RACM
10
(Geiger et al., 2003; Stockwell et al., 1997). More precisely, some emitted species like CO, SO2or NH3are directly linked to the chemical species considered in the chemical mechanism. As it is assumed that the majority of NOxis primarily emitted in the form of NO, NOxemissions are assigned to NO. For emitted VOCs, they are not all in direct cor-respondence with those of the chemical mechanism. In this particular case, the VOCs
15
emissions are disaggregated into model species following the aggregation procedure proposed by Middleton et al. (1990). This procedure is done in two steps. First, the emitted species are divided into 32 emission categories according to their reactivity to-wards the HO•radical, the magnitude of their emission rates and the similarities in their functional chemical groups. Second, these emission categories are further condensed
20
into a smaller set of VOCs classes that directly correspond to those in a particular mechanism (here RACM). The partitioning ratios that redistribute emitted species into emission categories and aggregation factors used in this study are listed in Table S1.
For aerosol species, the emissions of organic carbon (OC) are converted into par-ticulate organic matter (POA) multiplying the value by a conversion factor of 1.6 as
25
ACPD
15, 13395–13455, 2015Modeling organic aerosol composition
at the puy de Dôme mountain
C. Barbet et al.
Title Page
Abstract Introduction
Conclusions References
Tables Figures
◭ ◮
◭ ◮
Back Close
Full Screen / Esc
Printer-friendly Version Interactive Discussion
Discussion
P
a
per
|
Discussion
P
a
per
|
Discussion
P
a
per
|
Discussion
P
a
per
|
Biogenic emissions are calculated online using MEGAN (Model of Emissions of Gases and Aerosols from Nature; Guenther et al., 2006) that uses a 1 km×1 km reso-lution. Since isoprene emissions account for more than 50 % of VOCs emissions from vegetation (Wiedinmyer et al., 2004), MEGAN quantifies the net biogenic emissions of isoprene. It also estimates emissions of monoterpenes (myrcene, sabinene, limonene,
5
α-pinene,β-pinene, etc.), oxygenated compounds (methanol, acetone, acetaldehyde, ethanol, formic acid, etc.), sesquiterpenes (α-farnescene,β-caryophyllene), and nitro-gen oxide.
Biomass burning emissions are derived from the Fire Inventory from NCAR ver-sion 1.0 (FINNv1). As described by Wiedinmyer et al. (2011), global estimates of gas
10
(CO2, CO, CH4, non-methane hydrocarbons NMHC, non-methane organic compounds NMOC, H2, NOx, NH3, SO2) and particle (OC, BC, PM2.5 and PM10) emissions from open burning of biomass (wildfire, agricultural fires and prescribed burning) are pro-vided with a daily temporal resolution and a spatial resolution close to 1 km.
2.4 Description of the sampling site and measurements
15
Measurements were conducted at the PUY research station located in the middle of France (45.46◦N, 2.57◦E) at 1465 m a.s.l. This station is located either in the bound-ary layer or above depending on the time of the day and the season (Venzac et al., 2009). The station is equipped with a range of instruments measuring meteorological parameters, gas-phase species concentrations and aerosol physico-chemical
proper-20
ties. These instruments are regularly calibrated as part of the international networks to which the station belongs: the ACTRIS (Aerosols, Clouds, and Trace gases Research InfraStructure network) and GAW (Global Atmosphere Watch) networks. It also hosts intensive measurement campaigns such as the EMEP campaigns. During these cam-paigns supplementary instruments are deployed at the station. In particular, an
Aero-25
ACPD
15, 13395–13455, 2015Modeling organic aerosol composition
at the puy de Dôme mountain
C. Barbet et al.
Title Page
Abstract Introduction
Conclusions References
Tables Figures
◭ ◮
◭ ◮
Back Close
Full Screen / Esc
Printer-friendly Version Interactive Discussion
Discussion
P
a
per
|
Discussion
P
a
per
|
Discussion
P
a
per
|
Discussion
P
a
per
(NR-PM1), including sulphate, ammonium, nitrate, chloride and organic mass concen-trations. The organic aerosol mass spectra were separated into different organic groups using Positive Matrix Factorisation (PMF) analysis using the procedures outlined in Ul-brich et al. (2009). Details of this analysis is provided in Freney et al. (2011) for the EMEP campaigns from 2008 to 2010. To access the black carbon mass concentration,
5
measurements are also performed using a Multi Angle Absorption Photometer (MAAP 5012). Aerosol measurements were performed behind a Whole Air Inlet (WAI) which upper 50 % size-cut is 30 µm allowing to sample aerosols both under clear sky and cloudy conditions. Under cloudy conditions, cloud droplets are evaporated in the WAI so that the residual aerosols pass into the sampling probes. The cToF-AMS was not
10
connected to the WAI, and all cloudy periods were hence filtered out from the data set. In addition, VOCs species are measured at the PUY station since 2010 through active sampling on sorbent cartridges. Gaseous compounds are sampled through a Teflon sampling line on cartridge containing a mixture of Tenax TA 60–80 mesh (250 mg) and carbosievesIII (150 mg) at 100 mL min−1 during 3 h. This type of car-15
tridges allows C4-C14 aromatic compounds, n-alkanes, monoterpenes and halo-genated compounds to be sampled. The VOCs trapped by the cartridges are then analysed by a gas chromatograph–mass spectrometer system (GC/MS, Perkin Elmer) connected to an automatic thermal desorption. The cartridge is desorbed at 270◦C dur-ing 25 min at a flow rate of 40 mL min−1and reconcentrated in a second trap, at
−10◦C
20
containing a mixture of Tenax TA and Carbosieve SIII. After the cryofocussing, the trap is rapidly heated to 300◦C and the target compounds are flushed into the GC. The separating column is a 60 m×0.25 mm×0.25 µm Elite-5MS (5 % phényl – 95 % PDMS)
capillary column (Perkin Elmer).
Detailed investigations of the chemical and microphysical properties of atmospheric
25
ACPD
15, 13395–13455, 2015Modeling organic aerosol composition
at the puy de Dôme mountain
C. Barbet et al.
Title Page
Abstract Introduction
Conclusions References
Tables Figures
◭ ◮
◭ ◮
Back Close
Full Screen / Esc
Printer-friendly Version Interactive Discussion
Discussion
P
a
per
|
Discussion
P
a
per
|
Discussion
P
a
per
|
Discussion
P
a
per
|
top of the PUY: continental vs. Mediterranean air masses (i.e. polluted vs. remote air masses), for two seasons. Also, the case study period was chosen over days without any changes in the air mass origins so to be able to study the evolution of aerosol chemical composition within the same air mass. This was the case in autumn 2008 (from the 14 to the 18 September 2008) and in summer 2010 (from the 23 to the 26
5
June 2010).
3 Results
As discussed before, two air mass origins are studied with contrasting chemical com-position between autumn 2008 and summer 2010. Prior to looking at organic aerosol evolution, it is important to verify that the WRF-Chem model correctly reproduces both
10
the origin of air masses and the meteorological conditions. For these two situations, this is important to determine if the measurements at the PUY station are located in the boundary layer or are free from direct surface influences. Then, some OA gas phase precursor measurements were available, solely during 2010, and will be com-pared to WRF-Chem outputs. Finally, aerosol chemical composition observed at PUY
15
will be simulated with the model.
3.1 Backward trajectories
In order to determine the origin of the air masses arriving at the top of the PUY, 48 h backward trajectories were computed using WRF-Chem every 6 h for the two episodes. Trajectories were classified according to their predominant transport direction prior to
20
arriving at the PUY site following Freney et al. (2011) as either “Continental” (C), “Ma-rine” (M), “Marine modified” (Mod), and “Mediterranean” (Med) (Fig. S2). For the sum-mer case, as the air masses are all coming from the North sector and are classified as “Continental”. For the autumn case, the backward trajectories exhibit two transport pathways over the whole period of time. On the 14 September 2008, air masses arriving
ACPD
15, 13395–13455, 2015Modeling organic aerosol composition
at the puy de Dôme mountain
C. Barbet et al.
Title Page
Abstract Introduction
Conclusions References
Tables Figures
◭ ◮
◭ ◮
Back Close
Full Screen / Esc
Printer-friendly Version Interactive Discussion
Discussion
P
a
per
|
Discussion
P
a
per
|
Discussion
P
a
per
|
Discussion
P
a
per
at the PUY are crossing the north-east of the France and Germany, and are charac-terized as “Continental”. On the 18 September, the backward trajectories change to a southerly direction where they pass over the Mediterranean Sea and Spain. They are then described as “Mediterranean”. These classifications are in agreement with those made by Freney et al. (2011) with the lagrangian model HYSPLIT widely used
5
for atmospheric dispersion.
3.2 Boundary layer height
The puy de Dôme mountain can be either in the boundary layer (BL) or in the free tro-posphere/residual nocturnal layer. A recent study, based upon LIDAR measurements follows the seasonal variations of the boundary layer height (BLH) at the PUY station
10
(Hervo et al., 2014). This study shows that the summit is mainly located in the free troposphere during winter and at night-time while in daytime summer it is merged into the BL. Further comparisons between the BLH retrieved from LIDAR profiles and the time series of BL tracers were conducted in Rose et al. (2014), indicating that there were little forced convection effects from the PUY on the BL dynamics, likely due to
15
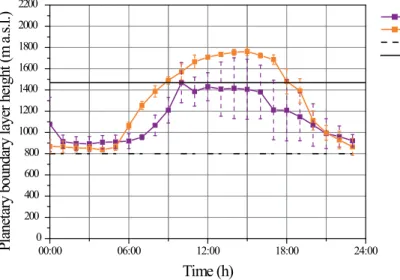
its relatively isolated pic topographic configuration. WRF-Chem model is able to repro-duce the general diurnal evolution of the BLH observed by Hervo et al. (2014) as well as the seasonal variations between autumn and summer (Fig. 1). However, the very complex topography of the area around the puy de Dôme would require in WRF-Chem the use of a very fine vertical resolution (less than 1 m which is not practised in current
20
transport-chemistry models). The height of the puy de Dôme summit is underestimated by the model since the surface elevation calculated by the model is 799 m (dotted black line) instead of 1465 m the real altitude of the puy de Dôme (full black line in Fig. 1). For this reason, according to the model, the summit would be always located in the BL independent of the season. Consequently, in the rest of the paper, results will be
25
ACPD
15, 13395–13455, 2015Modeling organic aerosol composition
at the puy de Dôme mountain
C. Barbet et al.
Title Page
Abstract Introduction
Conclusions References
Tables Figures
◭ ◮
◭ ◮
Back Close
Full Screen / Esc
Printer-friendly Version Interactive Discussion
Discussion
P
a
per
|
Discussion
P
a
per
|
Discussion
P
a
per
|
Discussion
P
a
per
|
3.3 Model statistical evaluation performance
In order to evaluate the WRF-Chem model performance, the simulation results for me-teorological parameters (temperature, relative humidity and pressure) are compared with observations performed at the PUY station using several statistical performance measures recommended by Chang and Hanna (2004), which include the fractional bias
5
(FB), the geometric mean bias (MG), the normalized mean square error (NMSE), the geometric variance (VG), and the fraction of predictions within a factor of two of obser-vations (FAC2). Those statistical calculations are reported in the Supplement for more details. Computed statistics for meteorological parameters for autumn 2008 and sum-mer 2010 are presented in Table S2. For the autumn case, pressure measurements
10
were not available. The statistics for all meteorological parameters for both situations are well within the acceptable range.
Statistical analyses have also been performed for trace gases concentrations (i.e. ozone (O3) and carbon monoxide (CO)) and are presented in Table S3. For O3 and CO concentrations, in September 2008 as well as in June 2010, the model respects
15
all criteria of acceptance. Since the O3concentrations, as well as those of CO are well captured by the model, we can conclude that the WRF-Chem model is able to correctly simulate both the chemical reactivity and the transport.
3.4 Volatile organic compounds
A small number of biogenic (BVOCs) and anthropogenic (AVOCs) VOC species was
20
measured during the 2010 experiment, at the PUY station. For the BVOCs, three monoterpene species are available:α-pinene,β-pinene and limonene. These species represent from 10 up to 50 % of the VOCs emissions from the vegetation (Guenther et al., 2000). They are taken into account in the model: API species in the model in-cludes α-pinene, β-pinene and other cyclic terpenes with one double bond and LIM
25
species in the model groups together with d-limonene and other cyclic diene-terpenes. Their oxidation by the hydroxyl radical HO•, ozone O
ACPD
15, 13395–13455, 2015Modeling organic aerosol composition
at the puy de Dôme mountain
C. Barbet et al.
Title Page
Abstract Introduction
Conclusions References
Tables Figures
◭ ◮
◭ ◮
Back Close
Full Screen / Esc
Printer-friendly Version Interactive Discussion
Discussion
P
a
per
|
Discussion
P
a
per
|
Discussion
P
a
per
|
Discussion
P
a
per
to the formation of SOA (von Hessberg et al., 2009; Kristensen et al., 2014). The SOA yield of these VOC species is variable depending on their initial concentrations, the NOx concentrations, the type of oxidants, the temperature, the relative humidity and the radiation (Lee et al., 2006). Typically, the SOA yields of these species are below 20 % but may reach 60 % for high concentrations of VOCs (Lane et al., 2008).
5
Measured AVOCs species included n-octane and n-nonane, benzene, toluene and ethylbenzene and o-; m-; p-xylenes, 2-; 3-; 4-ethyltoluene and 1,2,4-; 1,2,3- and 1,3,5-trimethylbenzene. Those species are emitted by industrial activity and traffic, and unfor-tunately are not represented in the model as individual species. Thereby,n-octane and
n-nonane are included in the HC8 model species (alkanes, alcohols, ester and alkynes
10
with HO• greater than 6.8
×10−12cm3molecule−1s−1 at 298 K and 1 atm); benzene,
toluene and ethylbenzene are included in the TOL model species (toluene and less re-active aromatics) and finally o-; m-; p-xylenes, 2-; 3-; 4-ethyltoluene and 1,2,4-; 1,2,3-and 1,3,5-trimethylbenzene are included in the XYL model species (xylene 1,2,3-and more reactive aromatics).
15
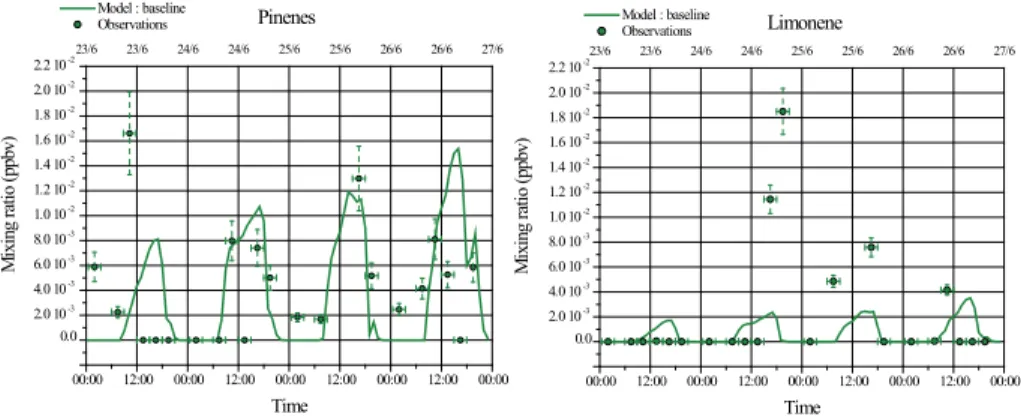
The temporal evolutions of pinenes and limonene concentrations simulated and ob-served are presented in Fig. 2. These comparisons show that the diurnal variation of these two species, with higher concentration levels during daytime than during night-time, is well captured by the model. However, their concentration levels are underes-timated by the model in average: by factors 2 and 10 respectively for pinenes and
20
limonene.
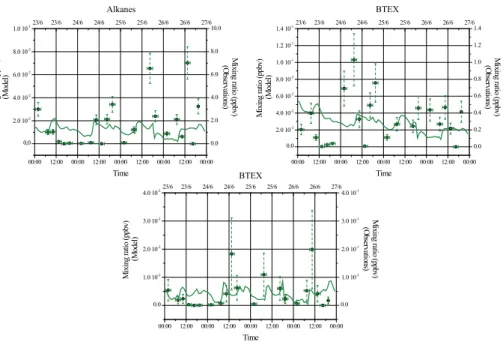
The time evolutions of the AVOCs (alkanes, xylene and toluene) simulated and ob-served (Fig. 3) highlight a strongest underestimation of the concentration levels by the model compared to biogenic gaseous precursors of SOA. This underestimation of VOCs by the model is probably due to missing organic species in the emission
inven-25
ACPD
15, 13395–13455, 2015Modeling organic aerosol composition
at the puy de Dôme mountain
C. Barbet et al.
Title Page
Abstract Introduction
Conclusions References
Tables Figures
◭ ◮
◭ ◮
Back Close
Full Screen / Esc
Printer-friendly Version Interactive Discussion
Discussion
P
a
per
|
Discussion
P
a
per
|
Discussion
P
a
per
|
Discussion
P
a
per
|
3.5 Simulating aerosol particles
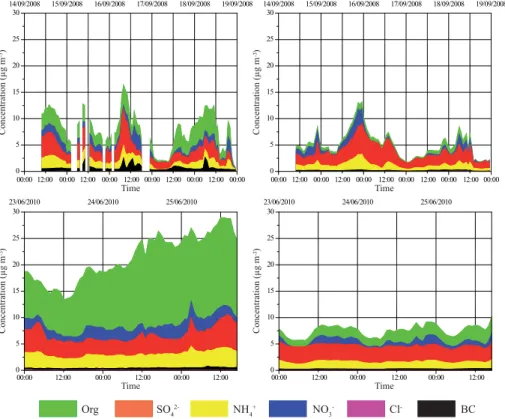
WRF-Chem model outputs are compared with in situ cToF-AMS aerosol measure-ments made at the PUY site for autumn 2008 (from the 14 to the 18 September) and summer 2010 (from the 23 to the 26 June 2010) (Freney et al., 2011).
Figure 4 shows the temporal evolution of sulphate (SO2−
4 ), nitrate (NO −
3), ammo-5
nium (NH+4), chloride (Cl−), black carbon (BC) and organics mass concentrations mea-sured at the PUY station and simulated by the WRF-Chem model. The average mass concentration observed for the summer case (21.3 µg m−3) is significantly higher
com-pared to autumn (7.2 µg m−3). Similar tendencies appear in simulations results but the model strongly underestimates the average total aerosol mass concentration (7.5 and
10
5.1 µg m−3respectively for summer and autumn situations).
Based on the average aerosol mass concentrations for the two campaigns (au-tumn 2008 and summer 2010 respectively), organic species measured at the PUY station represent 2.7 and 12.5 µg m−3, sulphates 2.4 and 3.7 µg m−3, ammonium 1.3
and 2.7 µg m−3, nitrates 1.0 and 2 µg m−3 and black carbon 0.6 and 0.4 µg m−3 of the
15
total particle mass concentration. The lowest mass concentrations are observed for non-refractive chloride particles: less than 0.01 and 0.1 µg m−3respectively for autumn
2008 and summer 2010.
The average concentration levels of inorganic species modeled for the two cam-paigns (autumn 2008 and summer 2010, respectively) are fairly close to those
ob-20
served: sulphates represent on average 2.6 and 3.0 µg m−3, ammonium 1.1 and 1.4 µg m−3, nitrates 0.6 and 0.8 µg m−3and black carbon 0.2 and 0.2 µg m−3of the total modeled particle mass concentration. For each inorganic aerosol species, mass con-centrations and results of the statistical analyses are presented in Table S4. The agree-ment between modeled and measured concentrations is not as good as the agreeagree-ment
25
ACPD
15, 13395–13455, 2015Modeling organic aerosol composition
at the puy de Dôme mountain
C. Barbet et al.
Title Page
Abstract Introduction
Conclusions References
Tables Figures
◭ ◮
◭ ◮
Back Close
Full Screen / Esc
Printer-friendly Version Interactive Discussion
Discussion
P
a
per
|
Discussion
P
a
per
|
Discussion
P
a
per
|
Discussion
P
a
per
For the autumn case, the WRF-Chem model overestimates the sulphate particles average mass concentrations observed at the PUY station over the whole period by 10 % whereas ammonium, nitrate, and black carbon average mass concentrations are underestimated by 20, 40, and 120 %. More precisely, the model does not respect any criteria except the random scatter acceptance (NMSE<1.5) for nitrate mass
concen-5
tration. It is even worse for the black carbon concentration, for which the model does not respect any criteria.
For the summer case, the WRF-Chem model underestimates all aerosol species mass concentrations observed at the PUY station. Statistics for sulphate, ammonium and black carbon mass concentrations show smaller errors than for nitrate mass
con-10
centrations. Comparison between statistical results and acceptance criteria show that the model respects all criteria only for the sulphate mass concentration. For the autumn case, the model correctly reproduces the sulphate mass concentration observed at the PUY station; ammonium, nitrate and black carbon mass concentrations are quite well captured by the model. Statistical results are not shown for chloride, since
concentra-15
tion levels are too small.
For ammonium and nitrate, the model underestimation is probably due to some resid-ual sources caused by agricultural activities that are not well considered in the model. The underestimation of the black carbon mass concentration is probably due to the anthropogenic emission inventory used in this study which is too coarse to correctly
20
represent the local emissions of black carbon which is a primary particle, directly emit-ted into the atmosphere from fossil fuel and biomass combustion. The mass concen-trations of organic aerosol mass are poorly reproduced by the model, especially for the 2010 situation, where the modeled organic aerosol mass concentration was 6 times lower than the measured values.
25
ACPD
15, 13395–13455, 2015Modeling organic aerosol composition
at the puy de Dôme mountain
C. Barbet et al.
Title Page
Abstract Introduction
Conclusions References
Tables Figures
◭ ◮
◭ ◮
Back Close
Full Screen / Esc
Printer-friendly Version Interactive Discussion
Discussion
P
a
per
|
Discussion
P
a
per
|
Discussion
P
a
per
|
Discussion
P
a
per
|
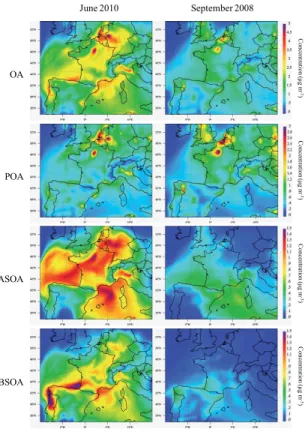
26 June 2010 and from the 14 to the 18 September 2008). POA is the main OA com-ponent during both seasons since it contributes respectively 34 and 62 % to the total OA. The dominant secondary component of OA is ASOA for both cases, with a contri-bution of 57 % during June 2010 and 70 % during September 2008. During June 2010, highest OA concentrations are simulated over a large area covering the northern part
5
of France (over Paris agglomeration), Benelux and Northwestern Germany, while in southern Europe, and more particularly over Spain, lower concentrations are simulated (≈1.5 µg m−3). During this period, a continental flux has been identified by air mass
backward trajectory calculations: polluted air masses are transported from northern to southern Europe. POA and ASOA are important in northern part of Europe. BSOA is
10
predominantly produced in the north of Spain and in Portugal. Zhang et al. (2013) stud-ied the formation of organic aerosols in the Paris region during the summer campaign of MEGAPOLI using the CHIMERE model and the VBS approach, and reported similar patterns over Europe when northeasterly winds result in the advection of pollution from Benelux and Rhine-Ruhr region.
15
OA concentration levels simulated over Europe during autumn are lower compared to those simulated during summer. However, the peaks of OA mass concentrations calculated for 2010 over Paris and the Benelux area still remain in 2008 simulation but are mainly due to POA emissions.
For September 2008, ASOA mass concentrations are highest in the southwestern of
20
France, eastern Spain and over the Mediterranean Sea. Backward trajectory calcula-tions show that from 14 to 17 September a continental air mass crossed over Europe. On the 18 September 2008, the transport pathway of the air mass deviates from conti-nental to Mediterranean origin. ASOA is produced from AVOCs emissions in the north of Europe and is rapidly transported towards the south during the days characterized
25
emis-ACPD
15, 13395–13455, 2015Modeling organic aerosol composition
at the puy de Dôme mountain
C. Barbet et al.
Title Page
Abstract Introduction
Conclusions References
Tables Figures
◭ ◮
◭ ◮
Back Close
Full Screen / Esc
Printer-friendly Version Interactive Discussion
Discussion
P
a
per
|
Discussion
P
a
per
|
Discussion
P
a
per
|
Discussion
P
a
per
sions of BVOCs from nearby Landes forest and Pyrenees mountains but also from the northern Portugal characterized by broadleaf trees.
The seasonal global patterns obtained with WRF-Chem for summer 2010 and au-tumn 2008 situations are consistent with those drawn by Fountnoukis et al. (2014). At the PUY station (Fig. 4), the largest seasonal contrast observed appears for organic
5
species with concentration levels clearly higher in summer than in autumn. The model underestimates the organic species mass concentrations as they are only 0.6 µg m−3 (13 % of the total aerosol mass concentration) and 2.0 µg m−3(27 % of the total aerosol
mass concentration) in the autumn and in the summer case respectively.
The underestimation of the organic aerosol concentrations is observed in most
10
modeling studies (de Gouw, 2005; Heald et al., 2005; Hodzic et al., 2010; Jimenez et al., 2009). In particular, such discrepancies were already mentioned by Langmann et al. (2014) who have also used the measurements performed at the PUY site dur-ing the same 2010 period with the 3-D model REMOTE (Regional Model with Tracer Extension; Langmann, 2000; Langmann et al., 2008). In Langmann et al. (2013), SOA
15
formation is represented by a new parameterization derived from the two-product ap-proach (Odum et al., 1996). Langmann et al. (2014) found that the OA mass concen-trations are in the range of the measurements by increasing the BVOCs emissions by a factor of 5 and considering that 10 % of the secondary organic compounds reach a saturation vapour pressure low enough to move into the next lower volatility category.
20
In connection to the underestimation of the organic aerosol concentration, the model underestimates VOC concentrations for both anthropogenic and biogenic contributions in 2010 (Sect. 3.4). In the following section, those discrepancies are analysed using the available measurements, and the uncertainties remaining in the SOA formation processes in the WRF-Chem model are discussed.
ACPD
15, 13395–13455, 2015Modeling organic aerosol composition
at the puy de Dôme mountain
C. Barbet et al.
Title Page
Abstract Introduction
Conclusions References
Tables Figures
◭ ◮
◭ ◮
Back Close
Full Screen / Esc
Printer-friendly Version Interactive Discussion
Discussion
P
a
per
|
Discussion
P
a
per
|
Discussion
P
a
per
|
Discussion
P
a
per
|
4 Discussion
4.1 Uncertainties in OA formation
Some of these uncertainties were studied by Murphy and Pandis (2010) and Farina et al. (2010) by varying several parameters and processes that drive the atmospheric SOA formation. In our study, we concentrate on SOA formation since SOA contribute
5
mainly to OA concentration measured at the PUY site. Indeed, the results of uncon-strained PMF analysis on the total OA mass spectra measured during June 2010 at the PUY station identified two predominant factors (LV-OOA: 66±13 % and SV-OOA:
34±13 %), typical for background rural sites (Freney et al., 2011). No primary HOA
factor was identified. OOA (the sum of LV-OOA and SV-OOA) and HOA components
10
are respectively considered as surrogates for SOA and POA (Ng et al., 2010a). Crippa et al. (2014) recently used a constrained PMF algorithm, ME-2, to re-analyse a num-ber of datasets in which OA data from the PUY was included (autumn 2008 and spring 2009). After the reanalysis of the OA mass spectra and constraining a HOA factor, an LV-OOA (35±4 %) and SV-OOA (55±18 %) were identified as with the unconstrained
15
PMF. However, in addition to these species, two less aged species, HOA and BBOA, contributing 3.5±2.5 % and 14±4 % respectively, were also identified. Although the
constrained ME-2 analysis was not applied to the June 2010 dataset, it is likely that HOA would contribute<10 % to the total organic aerosol.
Emission inventories for both biogenic and anthropogenic are uncertain. For
in-20
stance, the estimation of isoprene biogenic emissions over Europe varies from a fac-tor 3 up to a facfac-tor of 10 (Guenther et al., 2006; Smiatek and Bogacki, 2005). Zare et al. (2012) show that the annual emissions of isoprene over the Northern Hemi-sphere estimated by the MEGAN model for the year 2006 are 526 Tg yr−1, 21 % higher than those provided by the GEIA model (Global Emissions Inventory Activity;
Guen-25
ACPD
15, 13395–13455, 2015Modeling organic aerosol composition
at the puy de Dôme mountain
C. Barbet et al.
Title Page
Abstract Introduction
Conclusions References
Tables Figures
◭ ◮
◭ ◮
Back Close
Full Screen / Esc
Printer-friendly Version Interactive Discussion
Discussion
P
a
per
|
Discussion
P
a
per
|
Discussion
P
a
per
|
Discussion
P
a
per
rates than isoprene or monoterpenes, they may contribute significantly to SOA forma-tion because they are very reactive and have high aerosol yields (Lane et al., 2008). Light and temperature are known to be the most important environmental factors con-trolling BVOCs emissions from plants, but little is known about their interdependen-cies especially for BVOCs other than isoprene that are very numerous. For example,
5
monoterpene and sesquiterpene emissions fromQuercuscoccifera exhibit interacting responses to light and temperature (Staudt and Lhoutellier, 2011). Regarding anthro-pogenic emissions, several studies mention that the inventories traditionally used in the models are too static, e.g. with low time and space resolution (Menut et al., 2012; Mues et al., 2012; Skjøth et al., 2011). Generally the emissions are redistributed over
10
the model grid. Then, temporal profiles defined per activity sector are applied on each grid point of the model domain in order to determine the emission rate value. However, emission intensity varies according to the activity type, the area, the emitted species and their emission processes but as well as by the meteorological conditions (e.g. temperature and relative humidity) (Mues et al., 2014). De Meij et al. (2006) showed
15
that emissions with a seasonal temporal resolution are sufficient to correctly simulate the particulate organic matter and the black-carbon whereas emissions with weekly or daily temporal resolution are required to accurately represent NOx, NH3, and partic-ulate nitrate. Moreover, some anthropogenic emission sources such as the emissions linked to the cooking activity are not taken into account in the European emission
in-20
ventories even if they are recognized as an important organic aerosol source in North America (Ham and Kleeman, 2011; Schauer et al., 2002) and in Europe (Mohr et al., 2012; von der Weiden-Reinmüller et al., 2014; Zhang et al., 2013). Likewise, emis-sions of primary biological aerosol particles are not often considered in the inventories whereas they contribute to the particulate organic matter (Heald and Spracklen, 2009;
25
Winiwarter et al., 2009).
(Athana-ACPD
15, 13395–13455, 2015Modeling organic aerosol composition
at the puy de Dôme mountain
C. Barbet et al.
Title Page
Abstract Introduction
Conclusions References
Tables Figures
◭ ◮
◭ ◮
Back Close
Full Screen / Esc
Printer-friendly Version Interactive Discussion
Discussion
P
a
per
|
Discussion
P
a
per
|
Discussion
P
a
per
|
Discussion
P
a
per
|
sopoulou et al., 2013). Simulation of OA concentrations have been based on the gas-particle partitioning of semi-volatile organics (Pankow, 1994) using three types of ap-proach: two oxidation products (called the two-product approach) developed by Odum et al. (1996), the molecular approach (Couvidat et al., 2012; Pun et al., 2002), and the volatility basis set (VBS) approach (Donahue et al., 2006; Jimenez et al., 2009; Kroll
5
and Seinfeld, 2008). The first method is derived from chamber observations (Chung and Seinfeld, 2002; Griffin et al., 1999) and largely underestimates ambient SOA since it does not account for chemical aging reactions. These reactions are important in the atmosphere because they can reduce volatility of organic compounds and increase SOA mass yields (Donahue et al., 2006; Jimenez et al., 2009; Kroll and Seinfeld, 2008).
10
VBS has been developed to mitigate this lack of aging in the two-product approach. Several recent regional modeling studies are accounting for the semi-volatile nature and chemical aging of organic compounds both in the gas phase (OCVs) and/or in the aerosol phase demonstrating improvements in reproducing the organic aerosol bud-get and its chemical resolution (Ahmadov et al., 2012; Athanasopoulou et al., 2013;
15
Bergström et al., 2012; Fountoukis et al., 2011, 2014; Hodzic et al., 2010; Murphy and Pandis, 2009; Shrivastava et al., 2011; Tsimpidi et al., 2010; Zhang et al., 2013). In VBS, the oxidation products are sorted into logarithmically spaced volatility bins that allow representing a wider range of organic compounds in the atmosphere. However, all these studies using recent OA parameterizations lack one or more potentially
im-20
portant processes such as the aging reactions, the semi volatile character of POA or the potential source of SOA from aqueous phase processes (Ervens et al., 2011).
In the SOA formation parameterizations, SOA yields are based on experiments con-ducted in atmospheric simulation chambers where several single VOCs are oxidized under specific conditions (temperature, relative humidity, NOxconcentrations, . . . ). The
25
ACPD
15, 13395–13455, 2015Modeling organic aerosol composition
at the puy de Dôme mountain
C. Barbet et al.
Title Page
Abstract Introduction
Conclusions References
Tables Figures
◭ ◮
◭ ◮
Back Close
Full Screen / Esc
Printer-friendly Version Interactive Discussion
Discussion
P
a
per
|
Discussion
P
a
per
|
Discussion
P
a
per
|
Discussion
P
a
per
chamber-derived SOA yields to atmospheric conditions is an important source of error (Hao et al., 2011).
For the simulation of SOA aging processes using the VBS approach, it is generally assumed that OCVs react with HO•. Bergström et al. (2012) used the VBS framework in the EMEP model to study SOA formation over Europe. They found that the model
5
results were in better agreement with all observations relative to the simulations without aging processes. They showed that the aging constant plays an important role because a high value leads to high mass concentrations of SOA, and vice versa. The aging constant of OCVs results in large differences in model results and can range from 2.5×10⁻¹² to 4.0×10⁻¹¹cm3molecule−1s−1 (Farina et al., 2010; Fountoukis et al.,
10
2014; Lane et al., 2008; Murphy and Pandis, 2009, 2010).
To a lesser extent, in current chemistry-transport models, SOA concentrations are sensitive to the assumptions made on dry deposition of gas-phase SVOCs (Ahmadov et al., 2012) that are competing with uptake of gases to the organic particle phase. The effect of dry deposition of gas-phase OCVs on SOA concentrations is largely
uncon-15
strained since in many cases the deposition velocity of OCVs is proportional to the one of nitric acid (HNO3), which is very soluble. Bessagnet et al. (2010) found that neglect-ing dry deposition of semi-volatile organic compounds may lead to overestimations of SOA concentrations by as much as 50 %. However, in their estimations they assign a solubility parameter to lumped oxidation products of aromatics and biogenic
pre-20
cursors, and are neglecting other important molecular properties (Hodzic et al., 2014; Lane et al., 2008; Robinson et al., 2007). Pye and Seinfeld (2010) distinguished be-tween freshly emitted OCVs with a very low Henry’s law constant (<10 M atm−1) and
oxidation products that are treated using a Henry’s law constant of 105M atm−1. They
found that a considerable fraction is removed through the gas-phase. In a sensitivity
25
ACPD
15, 13395–13455, 2015Modeling organic aerosol composition
at the puy de Dôme mountain
C. Barbet et al.
Title Page
Abstract Introduction
Conclusions References
Tables Figures
◭ ◮
◭ ◮
Back Close
Full Screen / Esc
Printer-friendly Version Interactive Discussion
Discussion
P
a
per
|
Discussion
P
a
per
|
Discussion
P
a
per
|
Discussion
P
a
per
|
All the uncertainties just mentioned above are critical to accurately simulate SOA formation. We use the summer 2010 experiment, where high-time resolution measure-ments were available for both aerosol and gas-phase species in order to evaluate a se-ries of sensitivity tests to improve the modeled OA concentrations.
4.2 Sensitivity tests
5
To attempt to explain the observed discrepancies between measured and modeled or-ganic aerosol mass concentrations, a series of sensitivity tests have been pursued. A number of parameters identified as sources of uncertainties are modified. Emissions and dry deposition of gas phase precursors of SOA have been tested together with parameters controlling the SOA formation (yields and oxidation rates of OCVs).
Sen-10
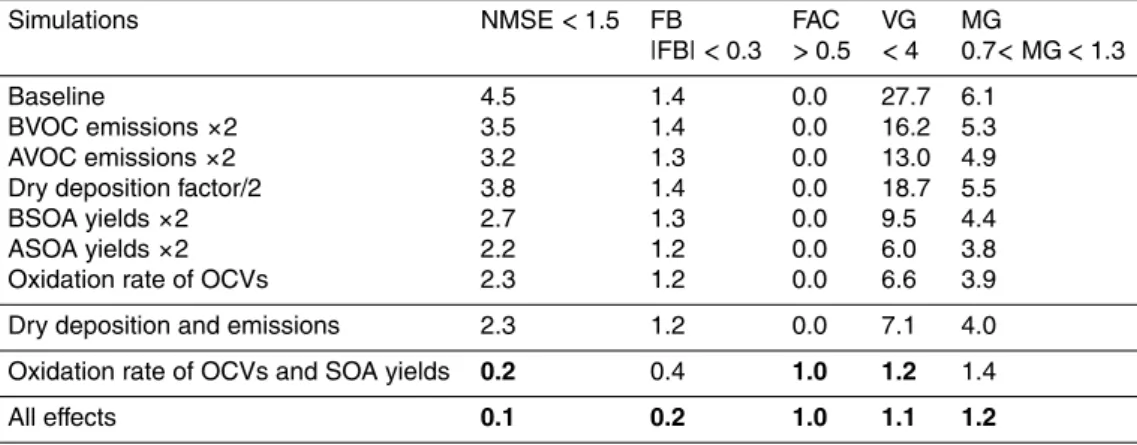
sitivity studies are performed for each parameter individually, then by all parameters combined (emissions/dry deposition and SOA formation parameters), and finally by integrating all changes, allowing a synergy to develop among them. Table 2 presents the statistical parameters computed for the baseline simulation, for all these individual sensitivity tests and for the combined ones.
15
4.2.1 Individual tests on emissions, dry deposition and SOA formation
parameters
As shown before in Sect. 3.4, in summer 2010, BVOCs concentrations are underesti-mated by the WRF-Chem model (API, LIM) compared to the VOCs measured at the PUY by at least a factor 2. The first test performed with the model is then to double the
20
BVOCs emissions.
For the baseline simulation, the WRF-Chem model strongly underestimates the av-erage OA mass concentration observed at the PUY station with a fractional bias of 1.4; the random errors (NMSE, VG) are out of the acceptance range recommended by Chang and Hanna (2004) and no value is within a factor of 2 of observations
(Ta-25
ACPD
15, 13395–13455, 2015Modeling organic aerosol composition
at the puy de Dôme mountain
C. Barbet et al.
Title Page
Abstract Introduction
Conclusions References
Tables Figures
◭ ◮
◭ ◮
Back Close
Full Screen / Esc
Printer-friendly Version Interactive Discussion
Discussion
P
a
per
|
Discussion
P
a
per
|
Discussion
P
a
per
|
Discussion
P
a
per
concentration simulated. Although none of the acceptance criteria are reached by the model, both the median geometric mean (MG) and the random errors (NMSE, VG) are reduced in comparison with the baseline simulation (Table 2).
The comparisons between available measurements of VOCs from anthropogenic sources and simulation results have shown that the HC8, TOL, and XYL species are
5
strongly underestimated by the model (Fig. 3). As observations are not available for the others AVOCs, it is difficult to determinate an accurate correction factor. So, it has been decided to increase the emissions of the AVOCs by a factor of 2, as has been done for the BVOCs emissions. This allows us to compare the contribution of anthropogenic vs. biogenic emissions to SOA formation.
10
Doubling the amount of AVOCs emissions leads to a slight increase in the average OA mass concentrations since the fractional bias is reduced from 1.4 to 1.3 (−10 %)
with smaller systematic (FB, MG) and non-systematic errors (NMSE, VG) (Table 2). However, still 0 % of values are within a factor of two of the observations. So, for this situation, increasing the anthropogenic emissions results in an equivalent impact on
15
OA formation than increasing the biogenic ones.
The next test performed with WRF-Chem consists in decreasing the deposition ve-locity of the OCVs since this parameter is very susceptible to the solubility of OCVs. Underestimation of organic aerosol mass with the model could also be attributed to too high dry deposition velocities of OCVs. Even if OCVs are known to be highly
wa-20
ter soluble, not much is known about their effective Henry’s law constants (H∗) varying
between 105 and 1010M atm−1 as estimated by structure-activity relationships (SAR) of Raventos-Duran et al. (2010). Recently, based on this SAR, Knote et al. (2015) pro-vided new deposition rates for each biogenic and anthropogenic volatility bins of OCVs that are more realistic but need further experimental validation. In the WRF-Chem
25