Submitted2 April 2014 Accepted 16 June 2014 Published3 July 2014 Corresponding author
Heather Paxton, hpaxton@rvc.ac.uk
Academic editor
Xiang-Jiao Yang
Additional Information and Declarations can be found on page 18
DOI10.7717/peerj.473 Copyright
2014 Paxton et al.
Distributed under
Creative Commons CC-BY 4.0 OPEN ACCESS
Anatomical and biomechanical traits of
broiler chickens across ontogeny. Part II.
Body segment inertial properties and
muscle architecture of the pelvic limb
Heather Paxton1, Peter G. Tickle2, Jeffery W. Rankin1, Jonathan R. Codd2and John R. Hutchinson1
1Structure & Motion Laboratory, Department of Comparative Biomedical Sciences,
The Royal Veterinary College, University of London, Hatfield, Hertfordshire, UK
2Faculty of Life Sciences, University of Manchester, Manchester, UK
ABSTRACT
In broiler chickens, genetic success for desired production traits is often shadowed by welfare concerns related to musculoskeletal health. Whilst these concerns are clear, a viable solution is still elusive. Part of the solution lies in knowing how anatomical
changes in afflicted body systems that occur across ontogeny influence standing and
moving. Here, to demonstrate these changes we quantify the segment inertial prop-erties of the whole body, trunk (legs removed) and the right pelvic limb segments of five broilers at three different age groups across development. We also consider how muscle architecture (mass, fascicle length and other properties related to mechanics) changes for selected muscles of the pelvic limb. All broilers used had no observed lameness, but we document the limb pathologies identified post mortem, since these two factors do not always correlate, as shown here. The most common leg disorders, including bacterial chondronecrosis with osteomyelitis and rotational and angular deformities of the lower limb, were observed in chickens at all developmental stages. Whole limb morphology is not uniform relative to body size, with broilers obtaining large thighs and feet between four and six weeks of age. This implies that the energetic cost of swinging the limbs is markedly increased across this growth period, perhaps contributing to reduced activity levels. Hindlimb bone length does not change during this period, which may be advantageous for increased stability despite the increased energetic costs. Increased pectoral muscle growth appears to move the centre of mass cranio-dorsally in the last two weeks of growth. This has direct consequences for locomotion (potentially greater limb muscle stresses during standing and moving). Our study is the first to measure these changes in the musculoskeletal system across growth in chickens, and reveals how artificially selected changes of the morphology of the pectoral apparatus may cause deficits in locomotion.
Subjects Agricultural Science, Developmental Biology, Evolutionary Studies, Zoology, Anatomy and Physiology
INTRODUCTION
The poultry industry is a rapidly expanding enterprise (over 870 million broilers slaughtered in the UK; DEFRA 2013 statistics), in which production continues to increase globally by over 130% in some countries (Scanes, 2007). In addition to increased production, the broiler chicken has gained an unusual repertoire of anatomical traits, which are repeatedly emphasized in scientific studies and highlight what has developed into a successful breeding programme for obtaining desired production characteristics (e.g.,Havenstein, Ferket & Qureshi, 2003;Paxton et al., 2010;Paxton et al., 2013). However,
a crossroads has been reached where efficient broiler production is haunted by welfare
concerns (Julian, 1998;Mench, 2004;Knowles et al., 2008). Broilers may suffer from heart
failure and sudden death syndrome (Julian, 1998;Maxwell & Robertson, 1998;Olkowski,
2007), reduced adaptive immune function (Cheema, Qureshi & Havenstein, 2003), leg
weakness (see review;Bradshaw, Kirkden & Broom, 2002), poor reproductive performance
(Siegel & Dunnington, 1987;Hocking, 1993) and appear to be susceptible to suboptimal
management of nutrition and their environment (e.g.,Vestergaard & Sanotra, 1999;Kestin et al., 2001;Scott, 2002;Brickett et al., 2007;Buijs et al., 2009). Unfortunately, whilst the welfare and economic concerns associated with these issues are clear, there is no optimal evidence-based solution that resolves all concerns surrounding broiler chicken production.
To move toward such a solution, a deeper understanding of how broiler body shape and musculoskeletal function develops during growth and how these changes may influence locomotion is required. Part 1 of this series (Tickle et al., 2014) characterized how broiler organ and pectoral muscle growth varies with increasing body mass, with a focus on respiratory system development and changes in organ size, highlighting important repercussions to breathing/cardiorespiratory performance. Here, we delve deeper into
how these and other anatomical changes have affected the overall size and shape of the
broiler and investigate how relevant traits have likely influenced their locomotor abilities. To help achieve our aim, we detail the muscle architectural properties of the major pelvic limb muscles (identified previously byPaxton et al., 2010as the hip, knee and ankle extensors in broilers) and document how these scale with body size. Skeletal muscle is one of the organs that is most adaptable to environmental change (Lieber, 1986), and an integral component of locomotion (supporting and powering the movement). Muscle mechanical performance is mostly dependent on a few key architectural properties; namely mass, fascicle length and pennation angle. These parameters are typically used to calculate physiological cross-sectional area (PCSA) and thereby estimate muscular capacity for force-generation (PCSA) versus length change (fascicle length) (Powell et al., 1984;Burkholder et al., 1994;Lieber & Friden, 2000). For broilers, muscle architecture data on the broiler currently exist for animals at six weeks of age (seePaxton et al., 2010), but how these properties change across growth in the broiler is unknown. This study therefore focuses on the scaling (i.e., size related, isometric or allometric;Biewener, 1989; Alexander et al., 1981;Alexander & Ker, 1990) relationships of select pelvic limb muscles to reveal changes in individual muscle characteristics of individual muscles from hatching to
and tarsometatarsus) scale with body size in the broiler chicken, as effective scaling of the hindlimb bones can reduce the rate at which stress increases with body mass (McMahon, 1973;McMahon, 1975;Garcia & da Silva, 2004).
In addition, differences in limb orientation and motion, and overall gait dynamics,
among avian taxa can be partially attributed to variation in body centre of mass (CoM)
position (Gatesy & Biewener, 1991; Abourachid, 1993;Hutchinson, 2004).Manion
(1984)estimated CoM position for chickens across ontogeny (5–19 days) and noted a cranioventral shift and a subsequent change in limb orientation during standing and walking (more flexed during standing, but more extended during walking). The broiler
CoM position has been addressed in preliminary computational analyses byAllen, Paxton
& Hutchinson (2009)and was found to shift caudodorsally. Other previous research suggests that broilers have a more cranially positioned CoM induced by a large pectoral
muscle mass (Abourachid, 1993;Corr et al., 2003a). To better understand the influence of
CoM on locomotor ability in broilers, we therefore quantify the variation in CoM position (3D) across ontogeny and relate this variation to anatomical changes documented here and in Part I of this study (Tickle et al., 2014).
All broilers used here are considered ‘normal’—i.e., no observed lameness, but we document the limb pathologies (identified post mortem) within our study populations. This is essential because the pathological changes in affected birds do not often relate to walking ability (assessed using gait score and force plate measurements) (Sandilands et al., 2011). We quantify the inertial properties (mass, centre of mass and radius of gyration)
of each limb and major body segment (Fig. 1), because these help reveal basic locomotor
habits (e.g. limb tapering—i.e., a proximal to distal reduction in muscle mass reflects a specialization for power versus force development;Alexander et al., 1981;Pasi & Carrier, 2003;Hutchinson, 2004;Payne et al., 2005;Smith et al., 2006). Both centre of mass position and radius of gyration are also good descriptors of body area distribution and resistance to rotational movements (Kilbourne, 2013). Importantly, inertial properties in chickens and more specifically broilers are almost completely unstudied. Only a few studies have
documented the inertial properties of other ground running birds (e.g., emus,Goetz et
al., 2008; guinea fowl,Daley, Felix & Biewener, 2007;Rubenson & Marsh, 2009; quail, Andrada et al., 2013; lapwing,Nyakatura et al., 2012). This study not only provides a novel insight into characteristics that influence broiler locomotor function, but also provides the inertial properties necessary to develop models for dynamic analyses of movement, which have been highly successful in improving our understanding of human pathological gait (e.g.,Steel, Van der Krogt & Delp, 2012;Fey, Klute & Neptune, 2013;Allen, Kautz & Neptune, 2013).
MATERIALS AND METHODS
BirdsFresh male cadavers of a commercial broiler strain at different ages (days 1, 13, 29, 32
and 40;Table 1) were used for the hind limb muscle analysis and then a further five
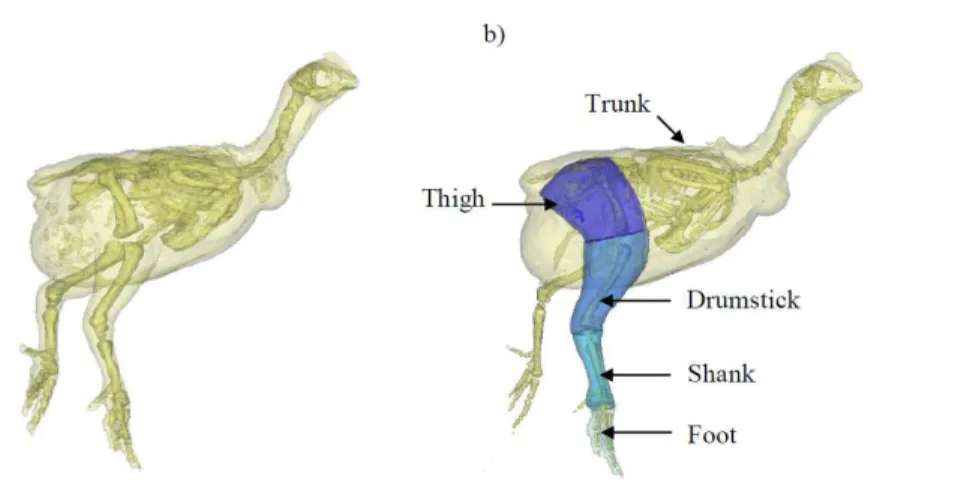
Figure 1 A 3D model representation of the broiler showing the body and pelvic limb segments.A 3D model representation of the broiler’s body and its corresponding segments created within MIMICS software. Each chicken was placed in the same upright position with their left side resting on a radiolucent cushion during scanning. (A) shows the whole body and skeleton produced within this software and (B) shows the trunk (leg flesh removed) and pelvic limb segments. The translucent outline represents the ‘virtual flesh’ of the models used to estimate the inertial properties (mass, centre of mass and radius of gyration) of each segment.
Table 1 Subject data.Data represented here are for the broiler chickens used only for muscle architecture and are means±standard deviation. These data form part of the mean data presented inTable 2, Part I of this study.
Age (days)
Sample size (n)
Body mass (kg)
1 10 0.044±0.01
13 10 0.431±0.08
29 5 1.542±0.05
32 5 1.738±0.08
40 7 2.452±0.09
and 6 weeks old) were used to calculate the centre of mass (CoM) of the whole body,
trunk and the pelvic limb segments—i.e., the thigh, drumstick, shank and foot (Fig. 1).
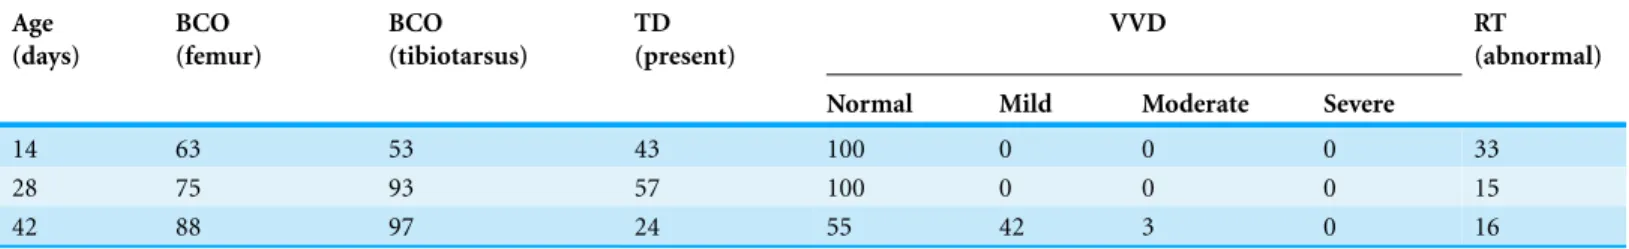
Table 2 Incidence of pathology across growth in broiler chickens.Data are presented as percentage of total study population. Bacterial chon-dronecrosis (BCO) and tibial dyschondroplasia (TD) were marked as present or absent. The severity of these abnormalities was not considered. Where present, valgus/varus deformities (VVD) were classified as mild (10–25◦), moderate (25–45◦) or severe (>45◦) following the methods described byLeterrier & Nys (1992). Tibial rotation (RT) above 20◦was considered abnormal. Pathologies may have been recorded in one pelvic limb or both pelvic limbs of the individual birds; this is not distinguished here.
Age (days)
BCO (femur)
BCO (tibiotarsus)
TD (present)
VVD RT
(abnormal)
Normal Mild Moderate Severe
14 63 53 43 100 0 0 0 33
28 75 93 57 100 0 0 0 15
42 88 97 24 55 42 3 0 16
setting. Full ethical approval for this experiment was granted by the RVC Ethics Committee
(approval URN No. 2008-0001) under a Home Office license.
Pathology
All birds were macroscopically evaluated to establish the incidence of leg pathologies
(marked as present/absent unless otherwise stated;Table 2). Each chicken was examined
for bacterial chondronecrosis with osteomyelitis (BCO) in the femur and tibiotarsus, tibial dyschondroplasia (TD), tibial rotation (RT) and valgus/varus deformities (VVD). Tibial
rotation above 20◦was considered abnormal. Similar to other studies (e.g.,Shim et al.,
2012) VVD was classified as mild, moderate or severe following the methods described by Leterrier & Nys (1992).
Muscle architecture
The left pelvic limb from each individual (refer toTable 1) was dissected, with fourteen
specific muscle–tendon units (seeTable 3for muscle names and abbreviations) being
identified and systematically removed. Muscles identified included the main hip, knee and ankle extensors, which are involved in limb support during the stance phase and have been shown to have either massive, short-fibred muscles favouring greater force-generating capacity or have long parallel-fibred muscles for fast contraction (Paxton et al., 2010), as in many other terrestrial species. Architectural measurements taken included muscle mass
(Mm; tendon removed), which was measured on an electronic balance (±0.001 g), muscle
fascicle length (Lf;±1 mm), and fibre pennation angle(θ ), where appropriate (±1◦).
In order to account for variation of fascicle length and pennation angle within a muscle,
Lfandθ were calculated as the mean of five measurements made across each muscle.
Physiological cross-sectional area (PCSA) was calculated for each muscle (Eq. (1);Sacks & Roy, 1982) from these measurements according to the equation:
PCSA=Mmcosθ (ρLf)−1. (1)
Muscle tissue density (ρ) was assumed to be 1.06 g cm−3, the standard value for
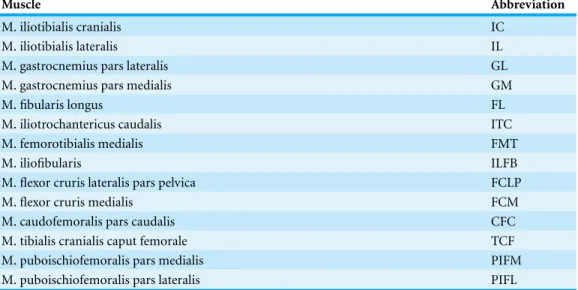
Table 3 The major muscles of the chicken pelvic limb.
Muscle Abbreviation
M. iliotibialis cranialis IC
M. iliotibialis lateralis IL
M. gastrocnemius pars lateralis GL
M. gastrocnemius pars medialis GM
M. fibularis longus FL
M. iliotrochantericus caudalis ITC
M. femorotibialis medialis FMT
M. iliofibularis ILFB
M. flexor cruris lateralis pars pelvica FCLP
M. flexor cruris medialis FCM
M. caudofemoralis pars caudalis CFC
M. tibialis cranialis caput femorale TCF M. puboischiofemoralis pars medialis PIFM M. puboischiofemoralis pars lateralis PIFL
Centre of mass and inertial properties
Computed tomography (CT) scans were acquired of five male bird cadavers from each group. The cadavers were scanned with a GE Lightspeed 8-detector scanner at 100 mA and 120 kVp X-ray beam intensity using a 1 mm CT slice thickness. In order to minimise postural effects on CoM estimates, the birds were placed in the same upright position with their left side resting on a radiolucent cushion for scanning and limbs posed as similarly
as possible (Fig. 1A). Mimics 14.12 imaging software (Materialise; Leuven, Belgium) was
then used to segment the resulting DICOM image files, creating a 3D representation of the skeleton, body and the pelvic limb segments (trunk, thigh, drumstick, shank
and the foot;Fig. 1B). We used predefined thresholds set for bone and flesh, with some
manual adjustment from those baseline values as appropriate to ensure smooth, plausible
rendering. Custom software (Hutchinson, Ng-Thow-Hing & Anderson, 2007;Allen, Paxton
& Hutchinson, 2009) was then used to estimate the whole body/segment CoM. This method allows accurate specification of the CoM relative to any user defined point on the body or segment. These points are easily identified using bony landmarks visible on the CT images and are essential for putting CoM position in the context of gross morphology, which is necessary for biomechanical analyses. Using the 3D model representations of the skeleton, whole body CoM position was quantified relative to the right hip, trunk CoM was taken relative to the pelvis (centre point between the hips on the pelvis), and for the remaining segments, CoM position was expressed relative to the proximal end of the
bone (Fig. 2). Three-dimensional coordinates (x[craniocaudal],y[dorsoventral] andz
[mediolateral]) for the CoM were then recorded. Whole body CoM position was expressed as a percentage of femur length (seeAllen, Paxton & Hutchinson, 2009).
Segment anatomical properties that we measured and present here include segment
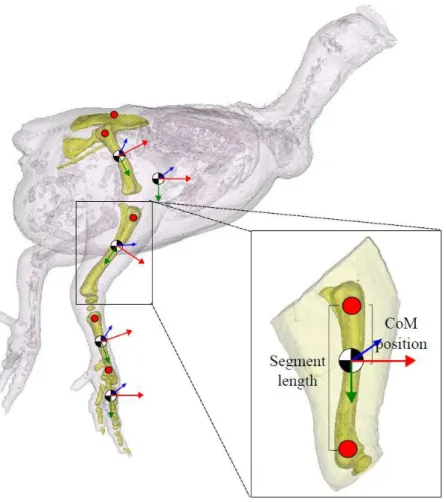
Figure 2 Segment inertial properties.The pelvis, femur, tibiotarsus, tarsometatarsus and the bones of the foot are highlighted in this 3D model. Centre of mass (CoM) position is shown (black/white circle; approximate position given). Trunk CoM was taken relative to the pelvis (centre point between the hips on the pelvis), and for the remaining segments, CoM positionwas expressed relative to the proximal end of the bone (red markers shown). The local anatomical coordinate system for each segment is given (x
(red),y(green) andz(blue)). Segment length (excluding the pelvis) is defined as the distance between the proximal and distal marker on the segment, as shown.
length), and radius of gyration (r; as % segment length), which are essential information
required to calculate the moments of inertia (kg m2;Eq. (3)) and subsequently complete
the set of inertial properties required for biomechanical analyses:
R=(Im−1)0.5. (2)
The radius of gyration (% segment length;Eq. (2)) was calculated using the principal
moment of inertia (I) and mass of the segment, both estimated using the custom software.
The mean difference between the dissected segment mass recorded and that estimated were
small (<5%). These data also provide further information on muscle mass distribution
within the limb.
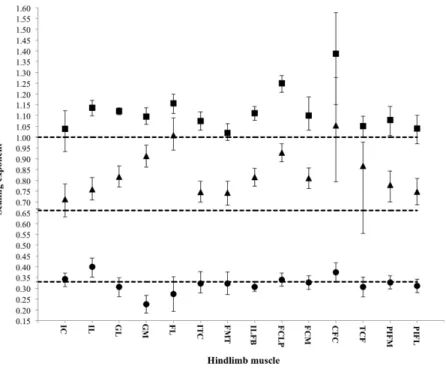
Figure 3 Scaling exponents of pelvic limb muscle properties as a function of increasing body mass.Symbols indicate the regression slope for muscle mass (squares), physiological cross-sectional area (PCSA; triangles) and muscle fascicle length (circles). Error bars represent upper and lower 95% confidence intervals. Dashed lines represent, expected values for isometric (directly proportional) scaling of muscle properties with body mass (y=1.0: muscle mass,y=0.67: PCSA,y=0.33: muscle fascicle length).
Bone scaling dataset
Data from Part I of this study were also used for this analysis. The individual bone lengths of the left pelvic limb were recorded (±1 mm) for each of four age groups: day 1(n=10), ∼14 days(n=20),∼28 days(n=19),∼42 days(n=19). Total leg length was defined as
the sum of the individual pelvic limb bone lengths. Limb bone proportions were calculated as a percentage of total leg length.
Statistical analysis
All of our analyses take into account differences in body size across age groups. To analyse the muscle architecture data, the linear relationship between log-transformed body mass and muscle mass, fascicle length and PCSA were examined using the reduced major-axis regression (RMA) function in the statistical program PAST (Hammer, Harper & Ryan, 2001). RMA regression was appropriate for analysis of these morphological characters because error in bothxandyvariables is considered (Rayner, 1985;Sokal & Rohlf, 1995).
Upper and lower 95% confidence intervals (CIs) and theR2value for each regression line
were calculated to quantify the variation around the mean (Fig. 3,Table 4). Isometric
scaling was assumed when the scaling exponent±95% CIs overlapped the expected value.
Reduced major-axis regression was also used to examine the linear relationship between log-transformed body mass and bone length. This was done using custom Matlab (The
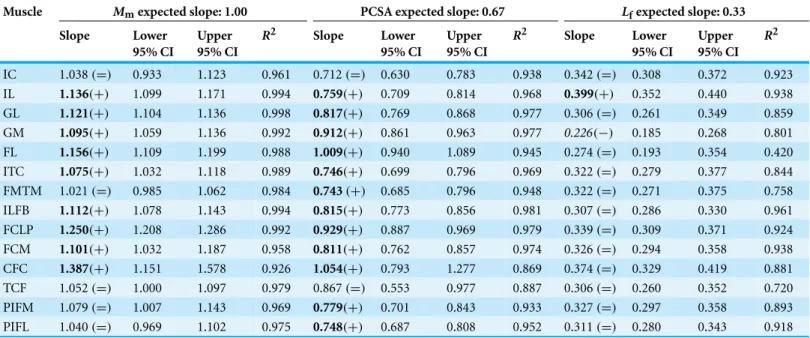
Table 4 RMA regression analyses.Data here are the RMA regression analyses that were used to determine the linear relationships between pelvic limb muscle architecture and body mass. Expected regression slopes for isometric growth are given for each parameter. Symbols next to each calculated regression slope indicate isometric growth(=), positive allometry (+; emphasized in bold) or negative allometry (−; emphasized in italics). All regressions were significant(p<0.05).
Muscle Mmexpected slope: 1.00 PCSA expected slope: 0.67 Lfexpected slope: 0.33
Slope Lower
95% CI
Upper 95% CI
R2 Slope Lower
95% CI
Upper 95% CI
R2 Slope Lower
95% CI
Upper 95% CI
R2
IC 1.038(=) 0.933 1.123 0.961 0.712(=) 0.630 0.783 0.938 0.342(=) 0.308 0.372 0.923
IL 1.136(+) 1.099 1.171 0.994 0.759(+) 0.709 0.814 0.968 0.399(+) 0.352 0.440 0.938
GL 1.121(+) 1.104 1.136 0.998 0.817(+) 0.769 0.868 0.977 0.306(=) 0.261 0.349 0.859
GM 1.095(+) 1.059 1.136 0.992 0.912(+) 0.861 0.963 0.977 0.226(−) 0.185 0.268 0.801
FL 1.156(+) 1.109 1.199 0.988 1.009(+) 0.940 1.089 0.945 0.274(=) 0.193 0.354 0.420
ITC 1.075(+) 1.032 1.118 0.989 0.746(+) 0.699 0.796 0.969 0.322(=) 0.279 0.377 0.844
FMTM 1.021(=) 0.985 1.062 0.984 0.743(+) 0.685 0.796 0.948 0.322(=) 0.271 0.375 0.758
ILFB 1.112(+) 1.078 1.143 0.994 0.815(+) 0.773 0.856 0.981 0.307(=) 0.286 0.330 0.961
FCLP 1.250(+) 1.208 1.286 0.992 0.929(+) 0.887 0.969 0.979 0.339(=) 0.309 0.371 0.924
FCM 1.101(+) 1.032 1.187 0.958 0.811(+) 0.762 0.857 0.974 0.326(=) 0.294 0.358 0.938
CFC 1.387(+) 1.151 1.578 0.926 1.054(+) 0.793 1.277 0.869 0.374(=) 0.329 0.419 0.881
TCF 1.052(=) 1.000 1.097 0.979 0.867(=) 0.553 0.977 0.887 0.306(=) 0.260 0.352 0.720 PIFM 1.079(=) 1.007 1.143 0.969 0.779(+) 0.701 0.843 0.933 0.327(=) 0.297 0.358 0.893 PIFL 1.040(=) 0.969 1.102 0.975 0.748(+) 0.687 0.808 0.952 0.311(=) 0.280 0.343 0.918
regression line were also calculated (Fig. 4). Similar to the statistical analysis used for the
muscle architecture data, isometric scaling was assumed when the scaling exponent±95%
CIs overlapped the expected value.
For CoM values and segment anatomical properties, the statistics used followed those set out in Part I of this study. In brief, a Shapiro–Wilk normality test, in combination with considering subsequent PP and QQ plots of the data, and Levene’s test for equal variances were used to test the assumptions of a one-way analysis of variance (ANOVA). An ANOVA test was then conducted with a subsequent Bonferroni post-hoc test to check
for differences among the three age groups. If equal variances were violated, the Welch
statistics are reported in conjunction with the results of a subsequent Games-Howell post-hoc test (Table 8).
RESULTS
PathologyThere were a number of pathological changes in the study population at all stages of
development (seeTable 2). Bacterial chondronecrosis with osteomyelitis (BCO) was
present in all populations both in the femur and proximal tibia. There was an increased incidence of BCO in the femur as the broilers aged, with 88% of the six week old chickens affected. Tibial dyschondroplasia was present in all populations with no apparent correlation with age (average 41%). Rotated tibia was more prevalent in the younger birds
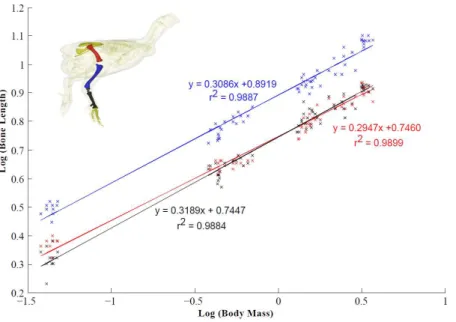
Figure 4 Scaling relationship of the pelvic limb bones (femur, tibiotarsus and tarsometatarsus).95% confidence intervals (CIs) for the femur, tibiotarsus and tarsometatarsus are 0.2947±0.0104, 0.3086±
0.0114 and 0.3189±0.0120 respectively (scaling exponent±CI). Isometric scaling of the tibiotarsus and tarsometatarsus is concluded because the 95% CIs overlapped the expected value (0.33). The femur scaled with slight negative allometry.
the six-week old chickens, with approximately 45% of these chickens affected. No varus
deformities were observed.
Muscle architecture
Across ontogeny, the masses of the major hip, knee and ankle extensor muscles generally scale with positive allometry, increasing in relative size as broilers grew (Table 4). The exceptions were the FMTM (M. femorotibialis medialis), TCF (M. tibialis cranialis caput femorale), PIF (M. puboischiofemoralis) and IC (M. iliotibialis cranialis), which did not change significantly with body mass. Interestingly, fascicle length, in general, did not change with body mass, but scaled isometrically. However, the IL (M. iliotibialis lateralis) muscle showed an increase in fascicle length, whereas the GM (M. gastrocnemius medialis) showed a decrease in fascicle length. Despite these changes in fascicle length, PCSA appeared to increase allometrically across ontogeny in the majority of the pelvic limb muscles. The IC and TCF, however, scaled more in accordance with isometry.
Whole body centre of mass
Whole body CoM moved caudodorsally until 28 days of age. By 42 days of age there was a
significant cranial shift in CoM position, moving∼10% cranially and∼30% more dorsally
in the last two weeks approaching slaughter age (Table 5).
Segment properties
There was a 50-fold range in body mass of our sample of broiler chickens (Table 1), ranging
Table 5 Whole body centre of mass position.Data represented are means±standard deviation. Centre of mass (CoM) position is calculated as a percentage of femur length and is expressed relative to the right hip joint of the chicken. Craniocaudal and dorsoventral positions are shown. Data with no common superscript differ significantly at the 0.05 level.
Age group CoM Position (% femur length)
Craniocaudal Dorsoventral
14 days 90.6±10.71 89.8±131
28 days 68.3±5.01,2 55.4±17.72 42 days 76.6±12.22 28.2±19.52
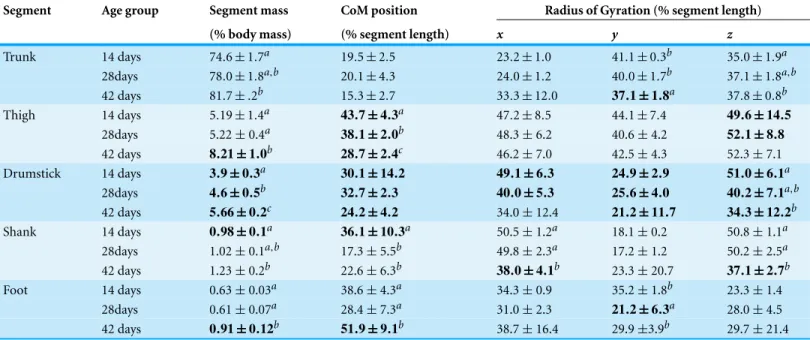
Table 6 Pelvic limb segment inertial properties.Data represented are means±standard deviation. Centre of mass position (CoM) is located relative to the proximal end of the segment (trunk CoM is relative to the centre line between the hips), and is shown along the craniocaudal (for trunk) or proximodistal (for limbs) axis (Fig. 2). Data in a column with no common superscript differ significantly at the 0.05 level.
Segment Age group Segment mass CoM position Radius of Gyration (% segment length)
(% body mass) (% segment length) x y z
Trunk 14 days 74.6±1.7a 19.5±2.5 23.2±1.0 41.1±0.3b 35.0±1.9a 28days 78.0±1.8a,b 20.1±4.3 24.0±1.2 40.0±1.7b 37.1±1.8a,b
42 days 81.7±.2b 15.3±2.7 33.3±12.0 37.1±1.8a 37.8±0.8b
Thigh 14 days 5.19±1.4a 43.7±4.3a 47.2±8.5 44.1±7.4 49.6±14.5
28days 5.22±0.4a 38.1±2.0b 48.3±6.2 40.6±4.2 52.1±8.8
42 days 8.21±1.0b 28.7±2.4c 46.2±7.0 42.5±4.3 52.3±7.1
Drumstick 14 days 3.9±0.3a 30.1±14.2 49.1±6.3 24.9±2.9 51.0±6.1a
28days 4.6±0.5b 32.7±2.3 40.0±5.3 25.6±4.0 40.2±7.1a ,b
42 days 5.66±0.2c 24.2±4.2 34.0±12.4 21.2±11.7 34.3±12.2b
Shank 14 days 0.98±0.1a 36.1±10.3a 50.5±1.2a 18.1±0.2 50.8±1.1a
28days 1.02±0.1a,b 17.3±5.5b 49.8±2.3a 17.2±1.2 50.2±2.5a 42 days 1.23±0.2b 22.6±6.3b 38.0±4.1b 23.3±20.7 37.1±2.7b
Foot 14 days 0.63±0.03a 38.6±4.3a 34.3±0.9 35.2±1.8b 23.3±1.4 28days 0.61±0.07a 28.4±7.3a 31.0±2.3 21.2±6.3a 28.0±4.5
42 days 0.91±0.12b 51.9±9.1b 38.7±16.4 29.9±3.9b 29.7±21.4
whole body mass increased across ontogeny and was∼5% larger at 42 days of age relative
to the youngest group. Similarly, a significantly larger relative thigh muscle mass was found
in older birds (by∼3% body mass) compared to the younger broilers. Drumstick mass
increased significantly with age whereas shank mass remained unchanged. Between 28 and 42 days, the chickens’ foot mass also increased significantly by∼30% (seeTable 6).
Trunk CoM moved caudally between 28 and 42 days, and the thigh, drumstick and
shank CoM moved to more proximal positions (Table 5). In contrast, the foot’s CoM
moved more distally at 42 days of age.
The radii of gyration about the axes of long-axis rotation (Table 6) experienced an
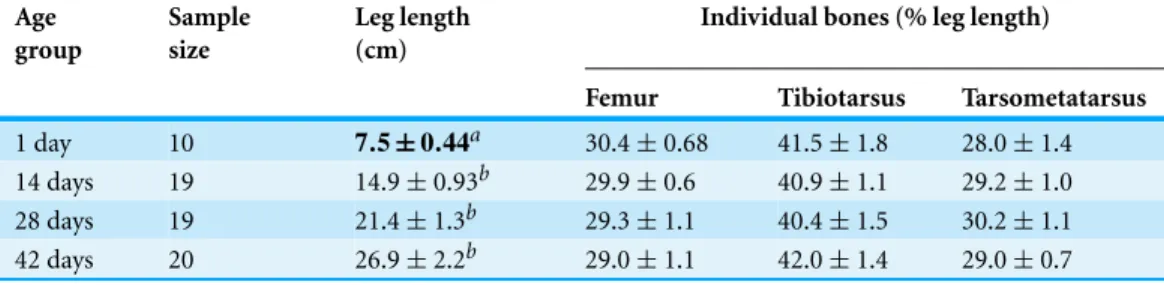
Table 7 Pelvic limb bone segment dimensions.Data presented here are for the left pelvic limb only, and are means±standard deviation. Total leg length is the sum of the individual pelvic limb bones.
Absolute values for leg length are presented here, but normalized values (divided by body mass1/3) were used for the statistical analysis to compare how leg length changed across ontogeny (seeFig. 4for scaling relationship). Data in a column with no common superscript differ significantly at the 0.05 level.
Age group
Sample size
Leg length (cm)
Individual bones (% leg length)
Femur Tibiotarsus Tarsometatarsus
1 day 10 7.5±0.44a 30.4±0.68 41.5±1.8 28.0±1.4
14 days 19 14.9±0.93b 29.9±0.6 40.9±1.1 29.2±1.0 28 days 19 21.4±1.3b 29.3±1.1 40.4±1.5 30.2±1.1 42 days 20 26.9±2.2b 29.0±1.1 42.0±1.4 29.0±0.7
showed a decrease for long-axis rotation—i.e., a lower resistance to yaw. The radii of gyration in the parasagittal plane, decreased in the drumstick and shank across broiler ontogeny, but progressively increased in the foot. There was also a relative reduction ofr% about the axis of abduction/adduction rotation. Radii of gyration for the thigh remained unchanged.
Bone scaling
Tibiotarsus and tarsometatarsus length scaled isometrically with body mass, whereas femur length scaled with slight negative allometry (Fig. 4). As a result, there was a relative increase in total leg length from 14 days to 28 days. Limb length remained unchanged
between four and six weeks (Table 7). The femur accounts for∼30% of total leg length and
the tibiotarsus accounts for∼41% of leg length. The tarsometatarsus is relatively shorter
than the other pelvic limb bones accounting for∼29% of total leg length.
DISCUSSION
The genetic success of the modern broiler and the subsequent changes to the morphology of broiler chickens have been well documented, in order to determine the lines’ commercial
performance (e.g.,Gous et al., 1999) and compare both growth responses and physiological
adaptations resulting from distinctive selection pressures (e.g.,Havenstein, Ferket & Qureshi, 2003;Reddish & Lilburn, 2004;Schmidt et al., 2009). A marked change in total pectoral muscle mass of the commercial broiler is a common finding of all these prior
studies. Similarly, we found this mass to represent∼20% of total body mass in slaughter
age chickens (see Part I;Tickle et al., 2014). Part I revealed how enlarged pectoral muscle
mass, among other anatomical changes, may compromise the efficacy of the respiratory
apparatus. Here we show how these changes influence the locomotor ability of the broiler.
Pathology
Leg weakness in broilers comprises not only nonspecific gait problems and lower activity levels, but also a wide range of disorders that are generally classified as infectious,
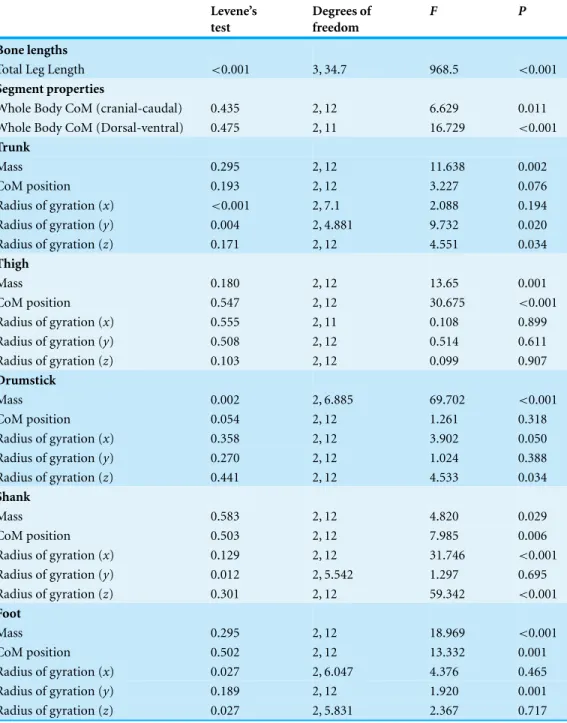
Table 8 Levene’s test and ANOVA results.Degrees of freedom=(dfbetween,dfwithin). Where the assump-tion of equal variances cannot be met (significant Levene’s test result), the Welch statistics are reported.
Levene’s test
Degrees of freedom
F P
Bone lengths
Total Leg Length <0.001 3, 34.7 968.5 <0.001
Segment properties
Whole Body CoM (cranial-caudal) 0.435 2, 12 6.629 0.011 Whole Body CoM (Dorsal-ventral) 0.475 2, 11 16.729 <0.001
Trunk
Mass 0.295 2, 12 11.638 0.002
CoM position 0.193 2, 12 3.227 0.076
Radius of gyration (x) <0.001 2, 7.1 2.088 0.194 Radius of gyration (y) 0.004 2, 4.881 9.732 0.020 Radius of gyration (z) 0.171 2, 12 4.551 0.034
Thigh
Mass 0.180 2, 12 13.65 0.001
CoM position 0.547 2, 12 30.675 <0.001 Radius of gyration (x) 0.555 2, 11 0.108 0.899 Radius of gyration (y) 0.508 2, 12 0.514 0.611 Radius of gyration (z) 0.103 2, 12 0.099 0.907
Drumstick
Mass 0.002 2, 6.885 69.702 <0.001
CoM position 0.054 2, 12 1.261 0.318
Radius of gyration (x) 0.358 2, 12 3.902 0.050 Radius of gyration (y) 0.270 2, 12 1.024 0.388 Radius of gyration (z) 0.441 2, 12 4.533 0.034
Shank
Mass 0.583 2, 12 4.820 0.029
CoM position 0.503 2, 12 7.985 0.006
Radius of gyration (x) 0.129 2, 12 31.746 <0.001 Radius of gyration (y) 0.012 2, 5.542 1.297 0.695 Radius of gyration (z) 0.301 2, 12 59.342 <0.001
Foot
Mass 0.295 2, 12 18.969 <0.001
CoM position 0.502 2, 12 13.332 0.001
Radius of gyration (x) 0.027 2, 6.047 4.376 0.465 Radius of gyration (y) 0.189 2, 12 1.920 0.001 Radius of gyration (z) 0.027 2, 5.831 2.367 0.717
(approximately 0.5%McNamee et al., 1998). Incidence of BCO in the femur peaked at 88% of 42-day-old birds. This variation is likely due to differences in how these estimates of infection were determined. Femoral head separation (FHS; epiphyseolysis) dominated in our study’s birds, which we concur should be attributed to underlying traumatic (osteochondrosis) or infectious (osteomyelitis) femoral head pathology (following Wideman et al., 2013). FHS is often shown separately in studies to show the progression of the disease (e.g.,Wideman et al., 2012;Wideman & Pevzner, 2012;Wideman et al., 2013), but here we are purely interested in the presence or absence of the condition. Furthermore, the high percentage of birds we found to have BCO may reflect a predisposition to the
condition or differences in husbandry practices (McNamee & Smyth, 2000). Increasing
occurrence of BCO over development is consistent with previous results that identified peak incidence at around five weeks of age (McNamee et al., 1999). Increasing incidence over development may reflect increased stresses acting on the bone, which are thought to contribute to BCO (Wideman et al., 2013). Similarly, BCO in the tibiotarsus was
widespread and increased with age, showing a peak at 42 days (Table 2). BCO causes lesions
in the load-bearing growth plates of the femur and tibiotarsus, so rapid growth and weight gain may be an aggravating factor when bacterial infection is present. Considering the widespread incidence of BCO in birds that were otherwise deemed healthy, bone lesions are a significant problem affecting welfare standards in broiler chickens.
TD commonly leads to growth plate abnormalities, infections and tibial deformation (Lynch, Thorp & Whitehead, 1992) but, similar to BCO, TD does not necessarily induce lameness of sufficient severity to impair walking ability (Pattison, 1992). TD has been found to occur between 2 and 8 weeks of age (Lynch, Thorp & Whitehead, 1992) and our findings are consistent with this observation (Table 2). However, considerable variation exists in the reported prevalence of TD, ranging in 42 day old birds from approximately 2% (Shim et al., 2012;Siller, 1970) to 50% (Prasad, Hairr & Dallas, 1972;Sauveur & Mongin, 1978;Vaiano, Azuolas & Parkinson, 1994) of total flock population. Incidence of TD in this study was relatively high and occurred in all age groups, peaking at 28 days (57%).
However, determining why the incidence of TD is high in this study is difficult because
the condition reflects a complicated interaction of contributing factors, including dietary deficiencies, toxins, genetic predisposition and rapid growth rate (Julian, 1998;Orth & Cook, 1994;Shim et al., 2012).
Valgus-varus deformities (VVD) were observed in 42-day-old birds, but was not
present in younger broilers (Table 2). Comparable reports indicate that VVD occurs with
(Julian, 1998;Julian, 2005;Randall & Mills, 1981), although the timing of onset is known to vary (Randall & Mills, 1981).
Rotated Tibia (RT) occurred in birds at all developmental stages at a higher than
expected rate (i.e., value) compared to previous work (0.2%,Bradshaw, Kirkden & Broom,
2002). However, Bradshaw et al., reported a reduced proportion of RT in older broilers,
which perhaps indicates that affected birds were culled because the condition becomes
clearly obvious around 21 days of age (Riddell & Springer, 1985). The exact aetiology of RT is unknown; however TD and VVD may exacerbate the incidence of RT (Bradshaw, Kirkden & Broom, 2002), thereby contributing to the relatively high proportion of birds with an outward torsion of the tibial shaft.
Overall, there is a clear need to monitor the leg health of flocks, not only to aid breeders to make adjustments to management practices or genetics when necessary, but also to quickly identify lame birds for euthanasia on welfare grounds. The high incidence of leg pathologies highlights the problem of maintaining high growth rates and breast muscle
mass(Mb)at the expense of broiler anatomy and physiology. In addition, lameness
represents a significant economic cost to the industry as birds with leg weakness are
prematurely culled or have an increased incidence of mortality (Mench, 2004). Efforts
to improve the health of growing broilers will have the twin benefit of improving both welfare standards and productivity.
Muscle architecture
Architectural properties used to calculate the effective physiological cross-sectional area (PCSA) (Gans & Bock, 1965) of muscle take into account the effect of pennate fascicles on maximizing force per unit area. PCSA is thus greater in pennate muscles and is directly proportional to its force generation capacity (Burkholder et al., 1994;Lieber & Friden, 2000). In broilers, the PCSA of the major hip, knee and ankle extensors (essential for
supporting body mass and maintaining an upright standing posture;Gatesy, 1999;Reilly,
2000;Hutchinson, 2004), scale with positive allometry — i.e., these muscles have a greater force-generating capacity (reflected in their relatively larger PCSAs) as the broiler develops (Table 4,Fig. 3). As a result, muscular force production capacity in broiler chickens should increase with age, likely as a direct consequence of weight vs. force scaling constraints imposed by resisting gravity and inertia (e.g.,Corr et al., 2003a). However, these muscles still have smaller force-generating capabilities and shorter, presumably slower-contracting muscles than their wild counterpart, the Giant Junglefowl (Paxton et al., 2010). Broiler chickens appear to generally increase the PCSA of their pelvic limb muscles by increasing muscle mass, rather than by increasing fascicle length, which scaled isometrically (Table 4,
Roberts, Chen & Taylor, 1998). Thus, the isometric scaling of fascicle length we observed in this study avoids such added costs.
Interestingly, the PCSAs of the M. iliotibialis cranialis (IC) and M. tibialis cranialis caput femorale (TCF) scale more in accordance with isometry. The relative force-generating capacity of these muscles therefore remains unchanged throughout the growth of the broiler. The TCF is a knee extensor and ankle flexor and is assisted by other muscles that also serve as knee extensors and ankle flexors (e.g., M. femorotibialis and M. extensor digitorum longus). Similarly, the IC is also a knee extensor, but additionally acts as a hip flexor, supported by the M. iliotrochantericus caudalis (ITC; known to be significantly
larger in the broilerPaxton et al., 2010) to flex and medially rotate the femur. The
additional support of these muscles may help to explain why the IC and TCF scale in unusually isometric ways. The IC and TCF may be redundant, especially when limb motion in these broilers is likely to be (1) knee-driven (e.g.,Gatesy, 1999;Reilly, 2000; Hutchinson & Allen, 2008), requiring action of the major knee flexors (M. iliofibularis, M. flexor cruris lateralis), and (2) three-dimensional, demanding large supportive forces at the hip for the considerable mediolateral forces they experience when they walk (Paxton et al., 2013). However, biomechanical analyses ofin vivofunction are needed to test how much their function alters with growth in broilers.
Centre of mass and inertial properties
At the youngest age (14 days old) studied here, chickens’ trunk mass accounted for∼75%
of total body mass. At slaughter weight (around 42 days of age), total trunk mass had
increased to∼80% total body mass. The∼5% increase in trunk mass is largely attributable
to pectoral muscle growth, which occurred at a relatively faster rate than body mass (see Part I,Tickle et al., 2014).
Interestingly, relative hind limb segment mass (summed segment masses; muscle and
bone mass combined) did not decrease during growth, accounting for∼15% of total body
mass at slaughter age and thus representing a total 5% body mass increase across ontogeny. The proportion of bone mass contributing to total segment mass is likely small because the muscle to bone ratio is known to be high in commercial broilers (Ganabadi et al., 2009). The increase in leg mass was instead incurred by increases in drumstick and thigh muscle mass. Drumstick segment mass increased across ontogeny, becoming relatively larger at each age category, whereas thigh segment mass only had substantial changes during the
last two weeks of growth (from 28 to 42 days old). Thigh muscle mass increased by∼3%
of total body mass during this period. Changes in thigh and drumstick segment mass are expected, as these segments yield the most meat and are the most consumed portions (alongside breast meat) on the market (Broadbent, Wilson & Fisher, 1981). However, the increase in hind limb segment mass is striking and comparable to a progenitor
population (total limb muscle mass∼16%) at the same approximate physiological mass
and indeed larger than its wild counterpart at the same age by∼4% body mass (seePaxton
et al., 2010). Previous studies typically show an ontogenetic reduction in the investment
Schmidt et al., 2009) and the main drivers of selection in broiler chickens are still a greater yield of breast muscle mass and a faster post-hatch growth rate (Arthur & Alburs, 2003). Thus, changes in leg muscle mass may not reflect a direct difference in selection pressures. However, a relative increase in hind limb muscle mass may reflect a functional demand for
larger hip and knee extensors to support their increasing body mass.Corr et al. (2003a)
studied two strains of birds (relaxed and selected) raised on two different feeding regimes and suggested that the large pectoral muscle mass of the broiler has displaced their CoM cranially. Similarly,Abourachid (1993)suggested that increased stresses on the pelvic limbs of heavier broad-breasted turkeys were induced by a more cranially positioned CoM. We found that broilers show a change in whole body CoM position consistent with these previous findings, shifting from a caudodorsal to a craniodorsal location between 28 and 42 days of age, which would increase demand for muscular force production to balance it. Interestingly, the centre of mass of the Giant Junglefowl (a representative progenitor population) has been shown to move caudodorsally, not craniodorsally, across ontogeny. This cranial shift in broilers may therefore be the direct result of increased pectoral muscle mass growth between four and six weeks of age.
In all cases, the craniocaudal CoM location in broilers was far more cranial than
previous estimates.Allen, Paxton & Hutchinson (2009)estimated CoM cranial position
to be∼38% of femur length, compared to the 70–90% femur length estimated in this
study. On the other hand, dorsoventral estimates broadly corresponded to literature values (Allen, Paxton & Hutchinson, 2009). The difference in craniocaudal CoM position likely relates directly to pectoral muscle growth. The pectoral muscle mass of the broilers used
in this study yielded an additional∼4% of total body mass in comparison to the broilers
used byAllen, Paxton & Hutchinson (2009). One limitation of our study is that whole
body CoM was normalized by femur length, which did scale with slight negative allometry (see discussion below). Using femur length may introduce a slight bias to our results, but normalization by other factors including total limb length have been shown to yield the same result (Allen, Paxton & Hutchinson, 2009).
There are also substantial changes in the distal segment of the pelvic limb between 28
and 42 days. Foot mass increases by∼30% and foot CoM moves distally. Large feet may
serve to improve the apparent stability reported in the broiler (e.g.,Corr et al., 2003b) during the stance phase of gait. However, larger feet will influence the broiler’s ability to
accelerate and decelerate the limb during swing, which in turn can affect the metabolic
about the axes of long-axis rotation increased in the foot segments of the∼42 day old
broiler. Thus, increased radii of gyration in the foot segment of the broiler contribute significantly to the limb’s moment of inertia.
We found that broilers’ whole pelvic limb morphology changed across ontogeny, with the main changes in the thigh and foot segments. These segments had increased muscle mass and a more distal mass distribution (rather than having relatively longer limbs; see bone scaling discussion), resulting in relatively larger moments of inertia. The changes in limb morphology are likely to assist in supporting the increased supportive forces required by a more cranially positioned CoM and to help improve stability during locomotion. However, these changes also likely exact a relatively higher metabolic cost to locomotion.
Bone scaling
We have shown that femur length scaled with slight negative allometry, whereas the lengths of the tibiotarsus and tarsometatarsus scale with isometry across broiler ontogeny (Fig. 4). Regardless, total relative limb length remained unchanged from four to six weeks in growing broilers may be an adaptation related to their apparent instability (Paxton et al., 2013). Maintaining shorter limbs may act to moderate the lateral motion of the CoM and aid balance (Bauby & Kuo, 2000). However, short limbs also likely lead to an increased energetic cost (Steudel-Numbers & Tilken, 2004).
Here we have considered how pelvic limb morphology changes during broiler ontogeny, in coordination with other changes such as pectoral muscle mass. Together, these changes have influenced broiler morphology across ontogeny, which may have influenced locomotor ability as well. The relative force-generating capacity of the hind limb muscles is greater in older broilers, and is primarily achieved through increasing muscle mass but maintaining a constant fascicle length. Increases in thigh segment mass and a relative increase in the moment of inertia of the distal limb (due mainly to increased foot size) may reflect adaptations to cope with the apparent instability and a more cranially positioned CoM as broilers grow. Although the architectural changes we have observed have obvious advantages for maintaining an upright posture and forward progression of broiler chickens, these morphological changes likely have a negative impact on locomotion, exacting relatively higher metabolic costs during growth, which may have knock-on consequences for activity levels and even overall health.
ACKNOWLEDGEMENTS
We would like to thank Cobb-Vantress, Inc., especially Kate Barger and Antony Taylor for providing the chickens used in this study.
ADDITIONAL INFORMATION AND DECLARATIONS
Funding
Grant Disclosures
The following grant information was disclosed by the authors: BBSRC: BB/I021116/1.
Competing Interests
John Hutchinson is an Academic Editor for PeerJ. The authors declare there are no competing interests.
Author Contributions
• Heather Paxton and Peter G. Tickle conceived and designed the experiments, performed
the experiments, analyzed the data, contributed reagents/materials/analysis tools, wrote the paper, prepared figures and/or tables, reviewed drafts of the paper.
• Jeffery W. Rankin conceived and designed the experiments, performed the experiments,
contributed reagents/materials/analysis tools, reviewed drafts of the paper.
• Jonathan R. Codd and John R. Hutchinson conceived and designed the experiments,
contributed reagents/materials/analysis tools, reviewed drafts of the paper.
Animal Ethics
The following information was supplied relating to ethical approvals (i.e., approving body and any reference numbers):
Full ethical approval for this experiment was granted by the RVC Ethics Committee
(approval URN No. 2008-0001) under a Home Office License.
Supplemental Information
Supplemental information for this article can be found online athttp://dx.doi.org/
10.7717/peerj.473.
REFERENCES
Aberle ED, Stewart TS. 1983.Growth of fiber types and apparent fiber number in skeletal muscle of broiler-type and layer-type chickens.Growth47:135–144.
Abourachid A. 1993.Mechanics of standing in birds: functional explanation of lameness problems in giant turkeys.British Poultry Science34:887–898DOI 10.1080/00071669308417649.
Alexander RM, Jayes AS, Maloiy GMO, Wathuta EM. 1981.Allometry of the leg muscles of mammals.Journal of Zoology194:539–552DOI 10.1111/j.1469-7998.1981.tb04600.x. Alexander R, Ker R. 1990.The architecture of leg muscles. In: Winters J, Woo S, eds.Multiple
muscle systems: biomechanics and movement organization. Berlin: Springer, 568–577. Allen JL, Kautz SA, Neptune RR. 2013.The influence of merged muscle excitation modules
on post-stroke hemiparetic walking performance.Clinical Biomechanics28(6):697–704 DOI 10.1016/j.clinbiomech.2013.06.003.
Allen V, Paxton H, Hutchinson JR. 2009.Variation in center of mass estimates for extant sauropsids, and its importance for reconstructing inertial properties of extinct archosaurs.
Anatomical Record292:1442–1461DOI 10.1002/ar.20973.
Andrada E, Nyakatura JA, Bergmann F, Blickhan R. 2013.Adjustments of global and hindlimb local properties during the terrestrial locomotion of the common quail (Coturnix coturnix).
Arthur JA, Alburs GAA. 2003.Industrial perspective on problems and issues associated with poultry breeding. In: Muir WM, Aggrey SE, eds.Poultry genetics, breeding and biotechnology. Wallingford: CABI Publishing Co, 1–12.
Bauby CE, Kuo AD. 2000. Active control of lateral balance in human walking.Journal of Biomechanics33:1433–1440DOI 10.1016/S0021-9290(00)00101-9.
Berri C, Bihan-Duval EL, Debut M, Sante-Lhoutellier V, Baeza E, Gigaud V, Jego Y, Duclos MJ. 2007.Consequence of muscle hypertrophy on characteristics of pectoralis major muscle and breast meat quality of broiler chickens. Journal of Animal Science85:2005–2011 DOI 10.2527/jas.2006-398.
Biewener AA. 1989.Mammalian terrestrial locomotion and size: mechanical design principles define limits.Bioscience39:776–783DOI 10.2307/1311183.
Bradshaw RH, Kirkden RD, Broom DM. 2002.A review of the aetiology and pathology of leg weakness in broilers in relation to their welfare.Avian and Poultry Biology Reviews13:45–103 DOI 10.3184/147020602783698421.
Brickett KE, Dahiya JP, Classen HL, Gomis S. 2007.Influence of dietary nutrient density, feed form, and lighting on growth and meat yield of broiler chickens.Poultry Science86:2172–2181 DOI 10.1093/ps/86.10.2172.
Broadbent LA, Wilson BJ, Fisher C. 1981.The composition of the broiler chicken at 56 days of age: output, components and chemical composition.British Poultry Science22:385–390 DOI 10.1080/00071688108447898.
Buijs S, Keeling L, Rettenbacher S, Van Pouke E, Tuyttens FAM. 2009.Stocking density effects on broiler welfare: identifying sensitive ranges for different indicators.Poultry Science88:1536–1543 DOI 10.3382/ps.2009-00007.
Burkholder TJ, Fingado B, Baron S, Lieber RL. 1994.Relationship between muscle fiber types and sizes and muscle architectural properties in the mouse hindlimb.Journal of Morphology
221:177–190DOI 10.1002/jmor.1052210207.
Cheema MA, Qureshi MA, Havenstein GB. 2003.A comparison of the immune response of a 2001 commercial broiler with a 1957 random bred broiler strain when fed representative 1957 and 2001 broiler diets.Poultry Science82:1519–1529DOI 10.1093/ps/82.10.1519.
Corr SA, Gentle MJ, McCorquodale CC, Bennett D. 2003a.The effect of morphology on the musculoskeletal system of the modern broiler.Animal Welfare12:145–157.
Corr SA, Gentle MJ, McCorquodale CC, Bennett D. 2003b.The effect of morphology on walking ability in the modern broiler: a gait analysis study.Animal Welfare12:159–171.
Daley MA, Felix G, Biewener AA. 2007.Running stability is enhanced by a proximo-distal gradient in joint neurmechanical control.Journal of Experimental Biology210:383–394 DOI 10.1242/jeb.02668.
Fey NP, Klute GK, Neptune RR. 2013.Altering prosthetic foot stiffness influences foot and muscle function during below-knee amputee walking: a modeling and simulation analysis.Journal of Biomechanics46(4):637–644DOI 10.1016/j.jbiomech.2012.11.051.
Ganabadi S, Mutuviren S, Hilmi MA, Babjee SMA, Yaakub H, Fakurazi S. 2009. Carcass composition of jungle fowl in comparison with broilers and indigenous chicken.Asian Journal of Animal Sciences3:13–17DOI 10.3923/ajas.2009.13.17.
Gans C, Bock WJ. 1965.The functional significance of muscle architecture — a theoretical analysis.Ergeb Anat Entwicklungsgesch38:115–142.
Gatesy SM. 1999.Guineafowl hind limb function I: cineradiographic analysis and speed effects.
Journal of Morphology240:127–142
DOI 10.1002/(SICI)1097-4687(199905)240:2<127::AID-JMOR4>3.0.CO;2-Q.
Gatesy SM, Biewener AA. 1991.Bipedal locomotion: effects of speed, size and limb posture in birds and humans.Journal of Zoology224:127–147DOI 10.1111/j.1469-7998.1991.tb04794.x. Goetz JE, Derrick TR, Pedersen DR, Robinson DA, Conzemius MG, Baer TE, Brown TD. 2008. Hip joint contact force in the emu (Dromaius novaehollandiae) during normal level walking.
Journal of Biomechanics41:770–778DOI 10.1016/j.jbiomech.2007.11.022.
Goldspink G, Yang SY. 1999.Muscle structure, development and growth. In: Richardson RI, Mead GC, eds.Poultry meat science,Poultry science symposium series.Oxon: CAB International, 3–18.
Gous RM, Moran ET, Stilborn HR, Bradford GD, Emmans GC. 1999.Evaluation of the parameters needed to describe the overall growth, the chemical growth, and the growth of feathers and breast muscles of broilers.Poultry Science78:812–821DOI 10.1093/ps/78.6.812. Hammer Ø, Harper DAT, Ryan PD. 2001.PAST: paleontological statistics software package for
education and data analysis.Paleontological Electronica4(1): Article 4:9pp.
Havenstein GB, Ferket PR, Qureshi MA. 2003.Growth, livability and feed conversion of 1957 versus 2001 broilers when fed representative 1957 and 2001 broiler diets.Poultry Science
82:1500–1508DOI 10.1093/ps/82.10.1500.
Hocking PM. 1993.Effects of body-weight at sexual maturity and the degree and age of restriction during rearing on the ovarian follicular hierarchy of broiler breeder females.British Poultry Science34:777–784DOI 10.1080/00071669308417636.
Hutchinson JR. 2004.Biomechanical modeling and sensitivity analysis of bipedal running ability I. extant taxa.Journal of Morphology262:421–440DOI 10.1002/jmor.10241.
Hutchinson JR, Allen V. 2008.The evolutionary continuum of limb function from early theropods to birds.Naturwissenschaften96:423–448DOI 10.1007/s00114-008-0488-3.
Hutchinson JR, Ng-Thow-Hing V, Anderson FC. 2007.A 3D interactive method for estimating body segmental parameters in animals: application to the turning and running performance of Tyrannosaurus rex.Journal of Theoretical Biology46:660–680DOI 10.1016/j.jtbi.2007.01.023. Julian RJ. 1984.Valgus-varus deformity of the intertarsal joint in broiler chickens.The Canadian
Veterinary Journal25:254–258.
Julian RJ. 1998.Rapid growth problems: ascites and skeletal deformities in broilers.Poultry Science
77:1773–1780DOI 10.1093/ps/77.12.1773.
Julian RJ. 2005.Production and growth related disorders and other metabolic diseases of poultry — a review.The Veterinary Journal169:350–369DOI 10.1016/j.tvjl.2004.04.015.
Kestin SC, Gordon S, Su G, Sorenson P. 2001.Relationships in broiler chickens between lameness, liveweight, growth rate and age.Veterinary Record148:195–197DOI 10.1136/vr.148.7.195. Kilbourne BM. 2013.On birds: scale effects in the neognath hindlimb and differences in the
gross morphology of wings and hindlimbs.Biological Journal of the Linnean Society110:14–31 DOI 10.1111/bij.12110.
Kilbourne BM, Hoffman LC. 2013.Scale effects between body size and limb design in quadrupedal animals.PLoS ONE8:e78392DOI 10.1371/journal.pone.0078392.
Kram R, Taylor CR. 1990.Energetics of running: a new perspective.Nature346:265–266 DOI 10.1038/346265a0.
Leterrier C, Nys Y. 1992.Clinical and anatomical differences in varus and valgus deformities of chick limbs suggest different aetio-pathogenesis. Avian Pathology 21:429–442
DOI 10.1080/03079459208418861.
Lieber RL. 1986.Skeletal muscle adaptability — review of basic properties.Developmental Medicine and Child Neurology28:390–397DOI 10.1111/j.1469-8749.1986.tb03890.x. Lieber RL, Friden J. 2000.Functional and clinical significance of skeletal muscle architecture.
Muscle and Nerve23:1647–1666
DOI 10.1002/1097-4598(200011)23:11<1647::AID-MUS1>3.0.CO;2-M.
Lynch M, Thorp BM, Whitehead CC. 1992.Avian tibial dyschondroplasia as a cause of bone deformity.Avian Pathology21:275–285DOI 10.1080/03079459208418842.
Manion BL. 1984.The effects of size and growth on hindlimb locomotion in the chicken. PhD thesis, Univ. Illinois.
Maxwell MH, Robertson GW. 1998.UK survey of broiler ascites and sudden death syndromes in 1993.British Poultry Science39:203–215DOI 10.1080/00071669889132.
McMahon T. 1973.Size and shape in biology.Science179:1201–1204 DOI 10.1126/science.179.4079.1201.
McMahon TA. 1975.Using body size to understand the structural design of animals: quadrupedal locomotion.Journal of Applied Physiology39:619–627.
McNamee PT, McCullagh JJ, O’Hagan J, Spratt-Davidson S, Mulholland EJ, Ball HJ, Smyth JA. 1999.A longitudinal study of leg weakness in five commercial broiler flocks. In:Proceedings of the 48th western poultry disease conference. Canada, 124–126.
McNamee PT, McCullagh JJ, Thorp BH, Ball HJ, Graham D, McCullough SJ, McConaghy D, Smyth JA. 1998.Study of leg weakness in two commercial broiler flocks.Veterinary Record
143:131–135DOI 10.1136/vr.143.5.131.
McNamee PT, Smyth JA. 2000.Bacterial chondronecrosis with osteomyelitis (‘femoral head necrosis’) of broiler chickens: a review. Avian Pathology 29:253–270 DOI 10.1080/03079450050118386.
Mench JA. 2004.Lameness. In: Weeks CA, Butterworth A, eds.Measuring and auditing broiler welfare. Wallingford: CABI, 3–17.
Mendez J, Keys A. 1960.Density and composition of mammalian muscle.Metabolism: Clinical and Experimental9:184–188.
Nyakatura JA, Andrada E, Grimm N, Weise H, Fischer MS. 2012.Kinematics and center of mass mechanics during terrestrial locomotion in northern lapwings (Vanellus vanellus, Charadriiformes).Journal of Experimental Zoology Part A: Ecological Genetics and Physiology
317:580–594DOI 10.1002/jez.1750.
Olkowski AA. 2007.Pathophysiology of heart failure in broiler chickens: structural, biochemical, and molecular characteristics.Poultry Science86:999–1005DOI 10.1093/ps/86.5.999.
Orth MW, Cook ME. 1994.Avian tibial dyschondroplasia: a morphological and biochemical review of the growth plate lesion and its causes.Veterinary Pathology 31:403–404 DOI 10.1177/030098589403100401.
Pasi BM, Carrier DR. 2003.Functional trade-offs in the limb muscles of dogs selected for running vs. fighting.Journal of Evolutionary Biology16:324–332DOI 10.1046/j.1420-9101.2003.00512.x. Pattison M. 1992.Impacts of bone problems on the poultry meat industry. In:Bone biology and
Paxton H, Anthony NB, Corr SA, Hutchinson JR. 2010.The effects of selective breeding on the architectural properties of the pelvic limb in broiler chickens: a comparative study across modern and ancestral populations. Journal of Anatomy 217:153–166 DOI 10.1111/j.1469-7580.2010.01251.x.
Paxton H, Daley MA, Corr SA, Hutchinson JR. 2013.The gait dynamics of the modern broiler chicken: a cautionary tale of selective breeding.Journal of Experimental Biology216:3237–3248 DOI 10.1242/jeb.080309.
Payne RC, Hutchinson JR, Robilliard JJ, Wilson AM. 2005.Functional specialisation of the equine pelvic limb.Journal of Anatomy206:557–574DOI 10.1111/j.1469-7580.2005.00420.x.
Powell PL, Roy RR, Kanim P, Bello MA, Edgerton VR. 1984.Predictability of skeletal muscle tension from architectural determinations in guinea pig hindlimbs.Journal of Applied Physiology
57:1715–1721.
Prasad S, Hairr WT, Dallas JT. 1972.Observations of abnormal cartilage formation associated with leg weakness in commercial broilers.Avian Diseases16:457–461DOI 10.2307/1588813. Randall CJ, Mills CPJ. 1981.Observations on leg deformity in broilers with particular reference to
the intertarsal joint.Avian Pathology10:407–431DOI 10.1080/03079458108418492.
Rayner JMV. 1985.Linear relationships in biomechanics: the statistics of scaling functions.Journal of Zoology Series A206:415–439DOI 10.1111/j.1469-7998.1985.tb05668.x.
Reddish JM, Lilburn MS. 2004. A comparison of growth and development patterns in diverse genotypes of broilers. 1. Male broiler growth.Poultry Science83:1067–1071 DOI 10.1093/ps/83.7.1067.
Reilly SM. 2000.Locomotion in the quail (Coturnix japonica): the kinematics of walking and increasing speed.Journal of Morphology243:173–185
DOI 10.1002/(SICI)1097-4687(200002)243:2<173::AID-JMOR6>3.0.CO;2-E.
Remignon H, Lefaucheur L, Blum JC, Ricard FH. 1994.Effects of divergent selection for body weight on three skeletal muscles characteristics in the chicken.British Poultry Science35:65–76 DOI 10.1080/00071669408417671.
Riddell C, Springer R. 1985.An epizootiological study of acute death syndrome and leg weakness in broiler chickens in western Canada.Avian Diseases29:90–102DOI 10.2307/1590697. Roberts TJ, Chen MS, Taylor CR. 1998.Energetics in bipedal running. II. Limb design in running
mechanics.Journal of Experimental Biology201:2753–2762.
Rubenson J, Marsh RL. 2009. Mechanical efficiency of limb swing during walking and running in guinea fowl (Numida meleagris).Journal of Applied Physiology106:1618–1630 DOI 10.1152/japplphysiol.91115.2008.
Sacks RD, Roy RR. 1982.Architecture of the hindlimb muscles of cats: functional significance.
Journal of Morphology173:185–195DOI 10.1002/jmor.1051730206.
Sandilands V, Brocklehurst S, Sparks N, Baker L, McGovern R, Thorp B, Pearson D. 2011. Assessing leg health in chickens using a force plate and gait scoring: how many birds is enough?Veterinary Record168:77DOI 10.1136/vr.c5978.
Sauveur B, Mongin P. 1978.Tibial dyschondroplasia, a cartilage abnormality in poultry.Annales de Biologie Animale Biochimie Biophysique18:87–98DOI 10.1051/rnd:19780111.
Scanes CG. 2007. The global importance of poultry. Poultry Science 86:1057–1058 DOI 10.1093/ps/86.6.1057.
Scott TA. 2002.Evaluation of lighting programs, diet density, and short-term use of mash as compared to crumbled starter to reduce incidence of sudden death syndrome in broiler chicks to 35 days of age.Canadian Journal of Animal Science82:375–383DOI 10.4141/A01-067. Shim MY, Karnuah AB, Mitchell AD, Anthony NB, Pesti GM, Aggrey SE. 2012.The effects of
growth rate on leg morphology and tibia breaking strength, mineral density, mineral content, and bone ash in broilers.Poultry Science91:1790–1795DOI 10.3382/ps.2011-01968.
Siegel PB, Dunnington EA. 1987.Selection for growth in chickens.Critical Reviews in Poultry Biology1:1–24.
Siller WG. 1970. Tibial dyschondroplasia in the fowl.Journal of Pathology 101:39–46 DOI 10.1002/path.1711010105.
Smith NC, Wilson AM, Jespers KJ, Payne RC. 2006.Muscle architecture and functional anatomy of the pelvic limb of the Ostrich (Struthio camelus).Journal of Anatomy 209(6):765–779 DOI 10.1111/j.1469-7580.2006.00658.x.
Soike D, Bergmann V. 1998.Comparisons of skeletal muscle characteristics in chicken bred for meat or egg production 1. Histopathological and electron microscopic examination.Journal of Veterinary Medicine45:161–167DOI 10.1111/j.1439-0442.1998.tb00812.x.
Sokal RR, Rohlf FJ. 1995.Biometry: the principles and practice of statistics in biological research, 3rd edition. W.H. Freeman.
Steel KM, Van der Krogt MM, Schwartz MH, Delp SL. 2012. How much muscle strength is required to walkin in a crouch gait? Journal of Biomechanics45(15):2564–2569 DOI 10.1016/j.jbiomech.2012.07.028.
Steudel K. 1990.The work and energetic cost of locomotion. II. Partitioning the cost of internal and external work within a species.Journal of Experimental Biology154:287–303.
Steudel-Numbers KL, Tilken MJ. 2004.The effect of lower limb length on the energetic cost of locomotion: implications for fossil hominins.Journal of Human Evolution47(1-2):95–109 DOI 10.1016/j.jhevol.2004.06.002.
Tickle PG, Paxton H, Rankin JW, Hutchinson JR, Codd JR. 2014.Anatomical and biomechanical traits of broiler chickens across ontogeny. Part I. Anatomy of the musculoskeletal respiratory apparatus and changes in organ size.PeerJ2:e432DOI 10.7717/peerj.432.
Vaiano SA, Azuolas JK, Parkinson GB. 1994. Serum total calcium, phosphorus, 1,25
Dihydroxycholecalciferol, and endochondral ossification defects in comercial broiler chickens.
Poultry Science73:1296–1305DOI 10.3382/ps.0731296.
Vestergaard KS, Sanotra GS. 1999.Relationships between leg disorders and changes in the behaviour of broiler chickens.Veterinary Record144:205–209DOI 10.1136/vr.144.8.205. Wickler SJ, Hoyt DF, Clayton HM, Mullineaux DR, Cogger EA, Sandoval E, McGuire R,
Lopez C. 2004.Energetic and kinematic consequences of weighting the distal limb.Equine Veterinary Journal36:772–777DOI 10.2746/0425164044848046.
Wideman Jr RF, Al-Rubaye A, Gilley A, Reynolds D, Lester H, Yoho D, Hughes JM, Pevzner I. 2013.Susceptibility of 4 commercial broiler crosses to lameness attributable to bacterial chondronecrosis with osteomyelitis.Poultry Science92:2311–2325DOI 10.3382/ps.2013-03150. Wideman Jr RF, Hamal KR, Stark JM, Blankenship J, Lester H, Mitchell KN. 2012. A
wire-flooring model for inducing lameness in broilers: evaluation of probiotics as a prophylactic treatment.Poultry Science91:870–883DOI 10.3382/ps.2011-01907.