NHESSD
3, 6431–6457, 2015Maximum wind radius estimated by
the 50 kt radius
H. Takagi and W. Wu
Title Page
Abstract Introduction
Conclusions References
Tables Figures
◭ ◮
◭ ◮
Back Close
Full Screen / Esc
Printer-friendly Version Interactive Discussion
Discussion
P
a
per
|
Discussion
P
a
per
|
Discussion
P
a
per
|
Discussion
P
a
per
Nat. Hazards Earth Syst. Sci. Discuss., 3, 6431–6457, 2015 www.nat-hazards-earth-syst-sci-discuss.net/3/6431/2015/ doi:10.5194/nhessd-3-6431-2015
© Author(s) 2015. CC Attribution 3.0 License.
This discussion paper is/has been under review for the journal Natural Hazards and Earth System Sciences (NHESS). Please refer to the corresponding final paper in NHESS if available.
Maximum wind radius estimated by the
50 kt radius: improvement of storm surge
forecasting over the Western North Pacific
H. Takagi and W. Wu
Tokyo Institute of Technology, Graduate School of Science and Engineering, 2-12-1 Ookayama, Meguro-ku, Tokyo, 152-8550, Japan
Received: 8 September 2015 – Accepted: 2 October 2015 – Published: 27 October 2015
Correspondence to: H. Takagi ([email protected]) and W. Wu ([email protected])
NHESSD
3, 6431–6457, 2015Maximum wind radius estimated by
the 50 kt radius
H. Takagi and W. Wu
Title Page
Abstract Introduction
Conclusions References
Tables Figures
◭ ◮
◭ ◮
Back Close
Full Screen / Esc
Printer-friendly Version Interactive Discussion
Discussion
P
a
per
|
Discussion
P
a
per
|
Discussion
P
a
per
|
Discussion
P
a
per
|
Abstract
Even though the maximum wind radius (Rmax) is an important parameter in
determin-ing the intensity and size of tropical cyclones, it has been overlooked in previous storm surge studies. This research reviewed the existing estimation methods ofRmax based
on the central pressure or maximum wind speed. These over or underestimatedRmax
5
because of the substantial variety of the data, though an average radius could be mod-erately estimated. Alternatively, we proposed anRmaxestimation method based on the
radius of the 50 knot wind (R50). The data obtained during the passage of strong
ty-phoons by a meteorological station network in the Japanese archipelago enabled us to derive the following formula, Rmax=0.23R50. Although this new method
substan-10
tially improved the estimation ofRmaxcompared to the existing models, an estimation
error was unavoidable because of fundamental uncertainties regarding the typhoon’s structure or insufficient number of available typhoon data. In fact, a numerical simu-lation from 2013 Typhoon Haiyan demonstrated a substantial difference in the storm surge height for different Rmax. Therefore, the variability of Rmax should be taken into
15
account in storm surge simulations, independently of the model used, to minimize the risk of over or underestimation of storm surges. The proposed method is expected to increase the reliability of storm surge prediction and contribute to disaster risk man-agement, particularly in the Western North Pacific, including countries such as Japan, China, Taiwan, Philippines, and Vietnam.
20
1 Introduction
The maximum wind radius (Rmax) is one of the predominant parameters for the
esti-mation of storm surges and is defined as the distance from the storm center to the region of maximum wind speed. The storm eye usually decreases in size as it deep-ens, with the minimum value occurring near the lowest pressure (Jordan, 1961), so
25
NHESSD
3, 6431–6457, 2015Maximum wind radius estimated by
the 50 kt radius
H. Takagi and W. Wu
Title Page
Abstract Introduction
Conclusions References
Tables Figures
◭ ◮
◭ ◮
Back Close
Full Screen / Esc
Printer-friendly Version Interactive Discussion
Discussion
P
a
per
|
Discussion
P
a
per
|
Discussion
P
a
per
|
Discussion
P
a
per
Loder et al. (2009) examined the peak surge elevation for various physical factors for an idealized marsh and demonstrated that a difference in Rmax of 3.7 times caused
a difference of 40 % in the simulated surge height. Jelesnianski (1972) also demon-strated that surge heights tend to increase asRmaxincreases over a basin of standard
bathymetry, while Jelesnianski and Taylor (1973) showed that a surge would become
5
largest for a certainRmax, decreasing for anRmaxabove or below the peakRmax.
How-ever, prior to Hurricane Katrina, little attention was given to the role of the hurricane size in surge generation (Irish et al., 2008).
Several storm surges have recently occurred, causing catastrophic damage to coastal areas. Examples are the associated with Hurricane Katrina (US, 2005,
ap-10
proximately 2000 casualties and missing people), Cyclone Nargis (Myanmar, 2008, over 138 000 casualties), Tropical Storm Ketsana (Ondoy in the Philippines, 2009, 500 casualties), and Typhoon Haiyan (Yolanda in the Philippines, 2013, nearly 7000 casu-alties and missing people) (Esteban et al., 2015).
Numerical simulations have often predicted the extent of inundation due to these
15
catastrophic storm surges. For example, in the storm surge model from the Japan Me-teorological Agency (JMA), two kinds of meMe-teorological forcing fields are used: a simple parametric model of the tropical cyclone (TC) structure and a prediction of the op-erational non-hydrostatic mesoscale model (JMA, 2009). Although TC forecasts with a mesoscale model have gradually improved, their mean position error remains around
20
100 km for 24 h forecasts (JMA, 2009). Furthermore, high spatial resolution is needed to resolve the pressure gradients near the radius of maximum winds, thus, forecasted “low-resolution” storms tend to be weaker than they can be (Persing and Montgomery, 2005). The relationship between TCs and climate can be subtle, while differences in the spatial and temporal scales are large (Elsner and Jagger, 2013). In addition, it was
25
NHESSD
3, 6431–6457, 2015Maximum wind radius estimated by
the 50 kt radius
H. Takagi and W. Wu
Title Page
Abstract Introduction
Conclusions References
Tables Figures
◭ ◮
◭ ◮
Back Close
Full Screen / Esc
Printer-friendly Version Interactive Discussion
Discussion
P
a
per
|
Discussion
P
a
per
|
Discussion
P
a
per
|
Discussion
P
a
per
|
to account for the errors in the TC track forecasts and their influence on storm surge prediction (JMA, 2009).
In a parametric model, TCs are defined by a few parameters (e.g. wind speed, central pressure,Rmax, etc.). Such reconstructions are frequently used to force storm surge
and wave models or models of wind damage applied to an urban area, and are thus
5
useful from operational forecasting and warning to climatological risk assessment and engineering design (Kepert, 2010). However, it has been commonly recognized that the results drawn from individual storms may not necessarily be representative for the majority of storms (Shea and Gray, 1973).
For hurricanes with central pressures of 909–993 hPa, in 1893–1979, the meanRmax
10
was 47 km (Hsu and Yan, 1998). Fujii (1998) investigated typhoons with central pres-sures ≤980 hPa that hit the Japanese main islands and found an average Rmax of
84–98 km, depending on the track.
However, theRmax should be selected depending on the characteristics of each
ty-phoon. Therefore, several estimation models for Rmax have been proposed. Kossin
15
et al. (2007) correlated the Rmax with the TC eye size (km), when a clear symmetric
eye was identifiable, obtainingRmax=2.8068+0.8361Reye, whereReyeis the
infrared-measured eye size (km). Although this method demonstrated good accuracy, it has not yet been employed for the Western North Pacific (WNP).
Quiring et al. (2011) used the maximum wind velocity (Vmax) to estimate Rmax for
20
the entire Atlantic basin:Rmax=49.67−0.24Vmax, withRmaxandVmaxin nautical miles
(nmi, 1 nm=1.85 km) and knots (kts, 1 kt=0.52 m s−1), respectively. TheVmaxis a
rel-atively easily available parameter typically included in a TC warning. However, it must be noted that the maximum wind velocities are differently defined, depending on the oceanic basin through which the TC transits. For instance, the JMA classifies the
ty-25
ap-NHESSD
3, 6431–6457, 2015Maximum wind radius estimated by
the 50 kt radius
H. Takagi and W. Wu
Title Page
Abstract Introduction
Conclusions References
Tables Figures
◭ ◮
◭ ◮
Back Close
Full Screen / Esc
Printer-friendly Version Interactive Discussion
Discussion
P
a
per
|
Discussion
P
a
per
|
Discussion
P
a
per
|
Discussion
P
a
per
plicable to TCs in other basins, though an empirical relationship between 1 and 10 min mean wind speeds could be applied for their conversion (Sampson et al., 1995).
The empirical formula developed by the National Institute for Land and Infrastructure Management (NILIM) (Kato, 2005) has been often used to estimate theRmaxfor storm
surge simulations, particularly among Japanese coastal engineers (e.g. Takagi et al.,
5
2012; Nakajo et al., 2014), primarily because its estimation based on the TC’s central pressure (Pc), Rmax=80−0.769 (950−Pc) (P c <950), with Rmax and Pc in km and
hPa, respectively, is convenient. The Port and Airport Research Institute (PARI) and the Japan Weather Association (JWA) have also proposed exponential formulas of Rmax(km) using the central pressure (hPa):Rmax=94.89exp
(Pc−967)/61.5
(Kawai et al.,
10
2005) andRmax=52.15exp
(Pc−952.7)/44.09
(Kitano al., 2002), respectively. An alternative Rmax estimation based on the latitude, ψ, in addition to the pressure deficit, ∆p, has
been proposed by Vickery and Wadhera (2008) for TCs with a central pressure below 980 hPa traveling over the Atlantic and the Gulf of Mexico: ln(Rmax)=3.015−6.291×
10−5∆p2+0.0337ψ, withRmax,∆pandψ in km, hPa, and degree, respectively.
15
The purpose of this paper is to examine the existing models forRmaxestimation and
propose a new formula to minimize the estimation errors that result in an over or un-derestimation of the storm surge height. The meteorological data for the development of a reliable model for typhoon and storm surge simulation were obtained from 10 stations, from Japan’s southern small islands. Our new methodology is expected to
im-20
prove storm surge prediction particularly for the WNP including Japan, China, Taiwan, Philippines, and Vietnam.
2 Methodology
In this section, the data for the TC analysis, using only typhoons crossing the Japanese archipelago, is clarified. A brief description of the storm surge model is also presented.
NHESSD
3, 6431–6457, 2015Maximum wind radius estimated by
the 50 kt radius
H. Takagi and W. Wu
Title Page
Abstract Introduction
Conclusions References
Tables Figures
◭ ◮
◭ ◮
Back Close
Full Screen / Esc
Printer-friendly Version Interactive Discussion
Discussion
P
a
per
|
Discussion
P
a
per
|
Discussion
P
a
per
|
Discussion
P
a
per
|
2.1 Collection, selection, and processing of TC data
The major problems in obtaining TC maximum wind observations result from the sparseness of oceanic stations (Akinson et al., 1977). However, the good density of meteorological stations along the Japanese archipelago has a great potential for col-lecting data during TC passages. Figure 1 indicates the 10 meteorological stations in
5
Japan’s southern islands operated by the JMA. Using data from these stations, it was possible to analyze typhoons traveling within about 800 km between Naze and Yona-gunijima (Fig. 1).
As a TC approaches the Japanese main islands, its track, shape, and intensity are altered due to topographical disturbance (Fujii, 2006). Therefore, the use of data from
10
these remote inlands avoids the substantial changes in the TC structure induced by land topography.
The sampling of data in the selected stations was restricted to when the station experienced low pressures (Pc<935 hPa) during the typhoon passage. The distance
between the TC center and each meteorological station was calculated. The TCs
tran-15
siting within about 100 km from one or more stations were selected, while the vast majority of the TCs that traveled far from the stations were neglected, as they seemed to be less influential.
Recent major TCs, such as 2004 Hurricane Katrina (National Hurricane Center, 2005), 2008 Cyclone Nargis (Joint Typhoon Warning Center, 2012), 2012 Hurricane
20
Sandy (National Hurricane Center, 2012), and 2013 Typhoon Haiyan (Takagi et al., 2015a) had very low central pressures (895–940 hPa) and caused severe storm surges. Eighty percent of all hurricane damage is caused by less than 20 % of the worst events (Jagger et al., 2008). Therefore, only TCs with pressures below 935 hPa and likely to cause significant storm surges were included in our study.
25
NHESSD
3, 6431–6457, 2015Maximum wind radius estimated by
the 50 kt radius
H. Takagi and W. Wu
Title Page
Abstract Introduction
Conclusions References
Tables Figures
◭ ◮
◭ ◮
Back Close
Full Screen / Esc
Printer-friendly Version Interactive Discussion
Discussion
P
a
per
|
Discussion
P
a
per
|
Discussion
P
a
per
|
Discussion
P
a
per
A TC track analysis in the WNP was carried out using the best track data from the JMA, which consisted in the time, geographical position, sea level pressure at the storm center, maximum sustained wind speed, and auxiliary information for every 3 or 6 h.
Only 17 out of the 621 TCs from 1990 to 2013 met the criteria and were used in our study. Their characteristics and tracks are presented in Table 1 and Fig. 2, respectively.
5
2.2 Storm surge model
The development of a new formula mainly aimed to improve the estimation of storm surges. Therefore, its effectiveness should be assessed through storm surge simula-tions. Takagi et al. (2015a) reproduced the storm surge from 2013 Typhoon Haiyan for various parts of the Philippines, including Leyte, Samar, and Cebu. We extended this
10
simulation by incorporating the newRmaxestimation, to see if the simulation reasonably
estimated the observed surge heights.
We applied a parametric typhoon model based on the Myers formula (Takagi et al., 2012) coupled with the fluid dynamics model Delft3D-FLOW to estimate the extent of the storm surge in the Philippines during Typhoon Haiyan. This parametric typhoon
15
model calculated both pressure and wind fields using the parameters from the typhoon track dataset of the JMA (i.e. central positions and pressures). The Delft3D-FLOW model was applied to the simulation of a storm surge traveling from the deep sea to shallow waters and eventually running over Tacloban’s downtown. Although this model is applicable to a 3-D domain, the present study used a 2-D horizontal grid, making the
20
code equivalent to a non-linear long wave model, the most commonly used for storm surge simulations.
The atmospheric pressure inside a TC is generally expressed by an empirical for-mula. For our model, the Myers formula was adopted to calculate the pressure at a dis-tancer from the TC centerP(r) (Myers, 1954):
25
P(r)=P0+ ∆P ·exp
−Rmax
r
NHESSD
3, 6431–6457, 2015Maximum wind radius estimated by
the 50 kt radius
H. Takagi and W. Wu
Title Page
Abstract Introduction
Conclusions References
Tables Figures
◭ ◮
◭ ◮
Back Close
Full Screen / Esc
Printer-friendly Version Interactive Discussion
Discussion
P
a
per
|
Discussion
P
a
per
|
Discussion
P
a
per
|
Discussion
P
a
per
|
wherer denotes the distance from the center of the typhoon, P0, the pressure at the
typhoon center,∆P, the drop in pressure, andRmax, the radius of the maximum wind.
For the estimation of Rmax, since the geographic locations (latitude and longitude)
of the TC center from the best track were recorded every 3 or 6 h, the points were spatially converted to the Universal Transverse Mercator (UTM) coordinate system and
5
then temporally interpolated to hourly data. Then, the distance between the TC center and each station was calculated. The pressure at the closest station was estimated by Eq. (1) for differentRmaxand compared with the observed pressure at the station. The
radius that provided the best estimation was considered the optimumRmax.
To assess which areas of the country were affected, the simulation was initially
car-10
ried out for a wide area encompassing most of the Philippines. Then, a more detailed simulation was performed for San Pedro Bay in the Leyte Gulf, an area where the mas-sive storm surge engulfed and claimed thousands of lives. The numerical simulation for these two domains had already been implemented in previous work from the authors (Takagi et al., 2015a).
15
3 Results and discussion
In this section, the estimations of Rmax based on the existing models are reviewed,
and subsequently a new method is proposed to overcome significant estimation errors. Furthermore, a storm surge model is performed to investigate the sensitivity of the storm surge height to changes inRmax.
20
3.1 Rmax estimation based on the central pressure
Figure 3 contains the scatter plot between thePc and the estimated Rmax along with
the regression curves from the NILIM, PARI, and JWA models, and the linear regres-sion line for the present 17 TCs (Rmax=0.676Pc−578, with Rmax and Pc in km and
hPa). Particularly, the PARI model described well the average Rmax. The NILIM and
NHESSD
3, 6431–6457, 2015Maximum wind radius estimated by
the 50 kt radius
H. Takagi and W. Wu
Title Page
Abstract Introduction
Conclusions References
Tables Figures
◭ ◮
◭ ◮
Back Close
Full Screen / Esc
Printer-friendly Version Interactive Discussion
Discussion
P
a
per
|
Discussion
P
a
per
|
Discussion
P
a
per
|
Discussion
P
a
per
JWA models slightly over or underestimated the radius, though the lines were present within the entire plots. TheRmaxderived for 11 strong cyclones with central pressures of 920–944 hPa is also indicated (Hsu and Yan, 1998) and was similar to the present regression line at around 925 hPa. The model from Vickery and Wadhera (2008), as-suming a latitude of 27◦N as a central value for the meteorological station distribution
5
(Fig. 1), slightly underestimated the plots.
However, individual points greatly scattered around the regression lines. In fact, the coefficient of determination R2, which indicates how well a statistical model fits the data, was 0.058, confirming a weak correlation.
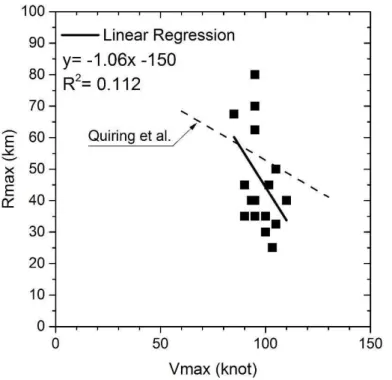
3.2 Rmax estimation based on the maximum wind speed
10
The Vmax is negatively related to the Rmax (Shea and Gray, 1973), suggesting that
years with more intense TCs tend to have smaller than average Rmax (Quiring et al., 2011). Figure 4, derived from the 17 studied typhoons, confirmed the same trend. However, the correlation betweenVmaxandRmaxwas weak, as confirmed by theR
2
of 0.112. In addition, the fact thatRmaxis highly sensitive to slight changes inVmaxbrings
15
more difficulties in determining the optimum Rmax. Shea and Gray (1973) confirmed
that a significant variation in the relationship between these two parameters exists, particularly for lower tropospheric data, obtained through aircraft reconnaissance by the National Hurricane Research Laboratory. Therefore, the validity of the estimation ofRmaxbased onVmaxis questionable at least for the WNP.
20
3.3 NewRmax estimation based on the 50 kt wind radius
The relative inadequacy of the Pc and Vmax as predictors of the Rmax motivated the
authors to investigate another methodology to minimize the estimation error. The Re-gional Specialized Meteorological Center (RSMC) Tokyo led by the JMA is responsible for issuing TC track and intensity forecasts over the WNP. The JMA produces forecasts
25
NHESSD
3, 6431–6457, 2015Maximum wind radius estimated by
the 50 kt radius
H. Takagi and W. Wu
Title Page
Abstract Introduction
Conclusions References
Tables Figures
◭ ◮
◭ ◮
Back Close
Full Screen / Esc
Printer-friendly Version Interactive Discussion
Discussion
P
a
per
|
Discussion
P
a
per
|
Discussion
P
a
per
|
Discussion
P
a
per
|
(Knaff, 2010), among other information (Fig. 5). We considered that the radius of the 50 kt winds around the typhoon (R50) could be alternatively used for the estimation of
Rmax, since both the Rmax and R50 are spatial parameters that directly represent TC
sizes. TheR50 is defined as the maximum radial extent of the winds reaching 50 kt in
nautical miles.
5
TheRmaxproportionally increased with the increase inR50(Fig. 6), according to the
following average linear relationship:
Rmax=0.23R50. (2)
For asymmetries in theR50, an average value between the longest and shortest radii
could be used. TheR2 was 0.57, demonstrating a relatively high correlation. The plot
10
scatter tended to decrease with decreasingR50, implying that the reliability of theRmax
estimation would improve for stronger TCs, since they generally intensify with decreas-ingRmax.
Although this new method was expected to improve the estimation of Rmax, an
es-timation error was unavoidable because of the fundamental uncertainty regarding the
15
TC structure. Therefore, to minimize the risk of over or underestimation of storm surges, the surge simulations should be repeated for different estimation lines covering a cer-tain percentage of the data (e.g. a 95 % prediction interval), such asRmax=0.15R50
to 0.35R50.
Figure 6 also indicates the estimatedRmaxfor the Atlantic from Kimball et al. (2004),
20
after converting the wind speed from a 1 to a 10 min mean and an interpolation to match theR50.
3.4 Storm surge simulation based on the newRmaxmodel
The Haiyan caused the worst storm surge disaster in the recorded history of the Philip-pines, striking Leyte Island in November 2013 and causing inundations of up to 7 m
25
NHESSD
3, 6431–6457, 2015Maximum wind radius estimated by
the 50 kt radius
H. Takagi and W. Wu
Title Page
Abstract Introduction
Conclusions References
Tables Figures
◭ ◮
◭ ◮
Back Close
Full Screen / Esc
Printer-friendly Version Interactive Discussion
Discussion
P
a
per
|
Discussion
P
a
per
|
Discussion
P
a
per
|
Discussion
P
a
per
the Pacific Ocean in the deep Philippine Trench. The Haiyan generated the strongest winds among over 400 past storms, being 16 % stronger than the second strongest recorded typhoon. The Haiyan forward speed nearly doubled the average speed of these weather systems, potentially making it the fastest recorded typhoon (Takagi et al., 2015b). A numerical simulation indicated inundation above 3 m along the entire bay and
5
up to 6 m in the inner bay (Fig. 7, Takagi et al., 2015a). The maximum hindcast signif-icant wave heights caused by the extremely strong winds reached 19 m off Eastern Samar (Bricker et al., 2014; Tajima et al., 2014; Roeber et al., 2015).
Figure 8 presents the estimated maximum storm surge heights for six locations around San Pedro Bay (Fig. 7). The simulation was implemented for two different radii
10
covering the 95 % prediction interval, namelyRmax=0.15 R50 and 0.35 R50, to
exam-ine the sensitivity of the results to Rmax. Except for Basey and Basiao, the observed
heights were mostly within the two estimated values, implying that an estimation for different radii is effective to mitigate the estimation errors. In other words, storm surge simulations must take into account theRmax uncertainty rather than using a singular
15
value, to avoid significant errors.
Although previous research (e.g. Jelesnianski, 1972; Loder et al., 2009) suggested that peak surge elevation would increase for a largeRmax, this is not always true as the
surge increased even for smallerRmaxin some locations (Fig. 8). It is interesting to note
that the simulation based on the small radius (=0.15R50) exhibited a far larger surge
20
height than the ones based on the large radius (=0.35R50), particularly for Tanauan. In
contrast, the surge increased with the typhoon radius for Airport, Anibong, and Bridge. Since Tanauan was located nearby the TC’s center (Fig. 9), the storm surge height was more susceptible toRmaxchanges there than at distant locations.
3.5 Applicability and limitations of the new model
25
The Rmax was significantly scattered when derived from the Pc or Vmax (Figs. 3 and
NHESSD
3, 6431–6457, 2015Maximum wind radius estimated by
the 50 kt radius
H. Takagi and W. Wu
Title Page
Abstract Introduction
Conclusions References
Tables Figures
◭ ◮
◭ ◮
Back Close
Full Screen / Esc
Printer-friendly Version Interactive Discussion
Discussion
P
a
per
|
Discussion
P
a
per
|
Discussion
P
a
per
|
Discussion
P
a
per
|
where the Rmax was estimated based on the R50 by Eq. (2). The relatively high R 2
demonstrated that the new method effectively reduced the estimation error ofRmax.
As theR50is easily obtained, the method can be applied to any TC transiting over an
ocean basin, for whichR50 values are available from a reliable meteorological agency.
The RSMC Tokyo, a regional specialized meteorological center under the World
Mete-5
orological Organization (WMO), covers a vast area of the WNP including Japan, China, Taiwan, Philippines, and Vietnam and issues TC information (Fig. 5) and warnings to the neighboring agencies, when a typhoon arises. To mitigate typhoon-related disas-ters, the authorities could instantaneously predict storm surge using a simple paramet-ric typhoon model, incorporating the R50 or other parameters estimated by a precise
10
model from a neighboring meteorological agency. This method should particularly fa-cilitate a prompt early warning by local authorities who cannot operate complex non-hydrostatic mesoscale models, but have sufficient precise local data (e.g. topography, bathymetry, infrastructure conditions, and household information) to greatly improve the prediction of the local amplification of the storm surge.
15
However, some estimation errors (Fig. 6) were unavoidable because of fundamental uncertainties in the TC structure and insufficient number of available TCs to derive the relationship from Eq. (2). For example, a challenge in theRmax estimation is
associ-ated with the occurrence of “flat” tangential wind profiles, i.e. when the wind decays very slowly with the radius (Kossin et al., 2007). These errors resulted in over or
under-20
estimations of the TCs and their subsequent storm surges, whose heights substantially varied withRmaxchanges (Fig. 8). Figure 6 also presents a remarkable discrepancy in
theRmaxestimated by the present method for the WNP and the Atlantic, meaning that
our method may underestimate theRmaxin other basins. This gap may be associated
with the difference in TC sizes between different basins, as Kimball et al. (2004)
sug-25
gested that the TC eyes are relatively smaller in the WNP than in the Atlantic, potentially resulting in smallerRmaxin the former.
It should also be noted that variousRmax have been assumed in the studies of
NHESSD
3, 6431–6457, 2015Maximum wind radius estimated by
the 50 kt radius
H. Takagi and W. Wu
Title Page
Abstract Introduction
Conclusions References
Tables Figures
◭ ◮
◭ ◮
Back Close
Full Screen / Esc
Printer-friendly Version Interactive Discussion
Discussion
P
a
per
|
Discussion
P
a
per
|
Discussion
P
a
per
|
Discussion
P
a
per
estimatingRmax in 15–25 km based on the empirical judgment that the heaviest
rain-fall in intense tropical cyclones occurs near the radius of maximum wind (Muramatsu, 1985) (Fig. 9). However, using Eq. (2), theRmaxwhen the typhoon struck Leyte Island
was estimated in 34 km, with an R50 of 80 nmi (=148 km). Although the reason for
this discrepancy is not clear, it can be partly explained by the fact that the inner radar
5
eye radius (IRR) occurs at radii of 5–6 nmi inside the Rmax (Shea and Gray, 1973).
Mori et al. (2014) estimated theRmax that best described the storm in 50–60 km using
numerical weather prediction and a storm surge model, while Kim (2015) assumed it as 30.2 km for the Leyte Gulf landfall for Holland’s wind model (Holland, 1980). These substantial differences in radius imply fundamental difficulties in a precise estimation
10
ofRmax, even using the best knowledge and current technology.
The consideration of these uncertainties in storm surge simulation is also relevant regarding the uncertainty in the TC information issued by the agencies. An examination of our 17 selected TCs indicated that temporal changes inRmaxaveraged 0.75 % h−1 and reached up to 8.3 % h−1. For the RSMC Tokyo, the wind radii estimates are part
15
of the 3 h advisories and warnings from the JMA. Therefore, theRmaxmay change up
to 24.9 % until the next information is available. These temporal changes in Rmax are
another source of error that must be considered.
Therefore, the variability ofRmaxshould be taken into account in storm surge
simula-tions, regardless of the model used, to minimize estimation errors that may compromise
20
an early evacuation of the population.
4 Conclusions
Using observations from many Japanese islands and best track data, 17 typhoons with central pressures below 935 hPa that passed near meteorological stations were se-lected to examine existing and a new method to calculateRmax. The existing methods
25
NHESSD
3, 6431–6457, 2015Maximum wind radius estimated by
the 50 kt radius
H. Takagi and W. Wu
Title Page
Abstract Introduction
Conclusions References
Tables Figures
◭ ◮
◭ ◮
Back Close
Full Screen / Esc
Printer-friendly Version Interactive Discussion
Discussion
P
a
per
|
Discussion
P
a
per
|
Discussion
P
a
per
|
Discussion
P
a
per
|
the radius of the 50 kt wind (R50). Although it was expected to substantially improve
the estimation of Rmax, an estimation error was unavoidable and resulted in an over
or underestimation of storm surges. In fact, the simulations of the storm surge from 2013 Typhoon Haiyan demonstrated that the estimated storm surge heights substan-tially varied with changes in Rmax, highlighting a fundamental difficulty in estimating
5
surge heights based on only one predetermined radius. Therefore, to minimize the risk of storm surge over or underestimation, the variability ofRmaxshould be taken into ac-count in the simulations, regardless of the model used. The proposedRmaxestimation
method is expected to increase the reliability of storm surge predictions and contribute to disaster risk management of tropical cyclones and storm surges.
10
Acknowledgements. The present research was funded by the JSPS KAKENHI Grant Num-ber 26702009 and the Environment Research and Technology Development Fund (S-14) of the Ministry of the Environment, Japan. The JMA typhoon best track data is available at http://www.jma.go.jp/jma/jma-eng/jma-center/rsmc-hp-pub-eg/besttrack.html, while the JMA meteorological station network data for the Japanese archipelago can be found at http:
15
//www.data.jma.go.jp/obd/stats/etrn/index.php.
References
Akinson, G. D. and Holliday, C. R.: Tropical cyclone minimum sea level pressure/maximum sustained wind relationship for the Western North Pacific, Mon. Weather Rev., 105, 421– 427, 1977.
20
Bricker, J. D., Takagi, H., Mas, E., Kure, S., Adriano, B., Yi, C., and Roeber, V.: Spatial Variation of Damage due to Storm Surge and Waves during Typhoon Haiyan in the Philippines, J. Jpn. Soc. Civ. Eng., 70, 231–235, 2014.
Elsner, J. B. and Jagger, T. H.: Hurricane Climatology: a Modern Statistical Guide Using R, Oxford University Press, New York, p. 373, 2013.
25
Esteban, M., Takagi, H., and Shibayama, T.: Handbook of Coastal Disaster Mitigation for Engi-neers and Planners, 1st Edn., Elsevier, USA, 2015.
NHESSD
3, 6431–6457, 2015Maximum wind radius estimated by
the 50 kt radius
H. Takagi and W. Wu
Title Page
Abstract Introduction
Conclusions References
Tables Figures
◭ ◮
◭ ◮
Back Close
Full Screen / Esc
Printer-friendly Version Interactive Discussion
Discussion
P
a
per
|
Discussion
P
a
per
|
Discussion
P
a
per
|
Discussion
P
a
per
Fujii, T.: On a pressure distribution of typhoons having made landfall on the Japanese main islands in 2004, J. Nat. Disaster Sci., 25, 317–328, 2006.
Heming, J. and Goerss, J.: Track and structure forecasts of tropical cyclones, in: Global Per-spectives on Tropical Cyclones, edited by: Johnny, C. L. C. and Jeffrey, D. K., World Scientific, Singapore, 287–323, 2010.
5
Holland, G.: An analytic model of the wind and pressure profiles in hurricanes, Mon. Weather Rev., 108, 1212–1218, 1980.
Hsu, S. A. and Yan, Z.: A note on the radius of maximum wind for hurricanes, J. Coastal Res., 14, 667–668, 1998.
Irish, J. L., Resio, D. T., and Ratcliff, J. J.: The influence of storm size on hurricane surge, J.
10
Phys. Oceanogr., 38, 2003–2013, doi:10.1175/2008JPO3727.1, 2008.
Jagger, T. H., Elsner, J. B., and Saunders, M. A.: Forecasting US insured hurricane losses, in: Climate Extremes and Society, Chap. 10, edited by: Murnane, R. J., Madigan, D., and Diaz, H. F., Cambridge University Press, Cambridge, UK, 2008.
Japan Meteorological Agency: Outline of the Storm Surge Prediction Model at the Japan
15
Meteorological Agency, Technical Review No. 11, available at: http://www.jma.go.jp/ jma/jma-eng/jma-center/rsmc-hp-pub-eg/techrev/abs11.htm#11-3 (last access: 15 Febru-ary 2015), 2009.
Jelesnianski, C. P.: SPLASH (Special Program to List Amplitudes of Surges From Hurricanes) I. Landfall Storms, NOAA Technical Memorandum NWS TDL-46, National Weather Service
20
Systems Development Office, Silver Spring, Maryland, 56 pp., 1972.
Jelesnianski, C. P. and Taylor, A. D.: A Preliminary View of Storm Surges Before and After Storm Modifications, NOAA Technical Memorandum ERL WMPO-3, NOAA, USA, 33 pp., 1973. Joint Typhoon Warning Center: Northern Indian Ocean Best Track Data, available at: http:
//www.usno.navy.mil/NOOC/nmfc-ph/RSS/jtwc/best_tracks/ (last access: 8 February 2015),
25
2012.
Jordan, C. L.: Marked changes in the characteristics of the eye of intense typhoons between the deepening and filling stages, J. Meteorol., 18, 779–789, 1961.
Kato, F.: Study on Risk Assessment of Storm Surge Flood, Technical note No. 275, National Institute for Land and Infrastructure Management of Japan, Tsukuba, Japan, 2005.
30
NHESSD
3, 6431–6457, 2015Maximum wind radius estimated by
the 50 kt radius
H. Takagi and W. Wu
Title Page
Abstract Introduction
Conclusions References
Tables Figures
◭ ◮
◭ ◮
Back Close
Full Screen / Esc
Printer-friendly Version Interactive Discussion
Discussion
P
a
per
|
Discussion
P
a
per
|
Discussion
P
a
per
|
Discussion
P
a
per
|
Kepert, J. D.: Tropical cyclone structure and dynamics, in: Global Perspectives on Tropical Cyclones, edited by: Johnny, C. L. C. and Jeffrey, D. K., World Scientific, Singapore, 3–54, 2010.
Kim, K. O.: Typhoon storm surge simulation for Typhoon Haiyan, J. Int. Devel. Coop. Hiroshima Univers., 21, 17–25, 2015.
5
Kimball, S. K. and Mulekar, M.: A 15-year climatology of North Atlantic tropical cyclones. Part I: Size parameters, J. Climate, 17, 3555–3575, 2004.
Kitano, M., Arimitsu, T., and Takayama, T.: Generation of Swell and Its simplified Predic-tion Method for Coastal Disaster PrevenPredic-tion, Proceedings of Coastal Engineering, Kushiro, Japan, JSCE, vol. 49, 1431–1435, 2002.
10
Knaff, J. A.: Tropical cyclone surface wind structure and wind pressure relationships, Seventh International Workshop on Tropical Cyclones, WMO, La Réunion, France, 2010.
Kossin, J. P., Knaff, J. A., Berger, H. I. Herndon, D. C., Cram, T. A., Velden, C. S., Murnane, R. J., and Hawkins, J. D.: Estimating hurricane wind structure in the absence of aircraft reconnais-sance, Weather Forecast., 22, 89–101, doi:10.1175/WAF985.1, 2007.
15
Loder, N. M., Cialone, M. A., Irish, J. L., and Wamsley, T. V.: Idealized Marsh Simulations: Sen-sitivity of Storm Surge Elevation to Seabed Elevation. Coastal and Hydraulics Engineering Technical Note ERDC/CHL CHETN-I-78, US Army Engineer Research and Development Center, Vicksburg, MS, 2009.
Muramatsu, T.: The Study on the Changes of the Three-dimensional Structure and the
Move-20
ment Speed of the Typhoon through its Life Time. Tech. Rep. Number 14, Meteorol. Res. Inst. Japan, Tokyo, Japan, p. 117, 1985.
Myers, V. A.: Characteristics of United States hurricanes pertinent to levee design for lake Okeechobee, Florida, Hydrometeorological Report No. 32, US Weather Bureau, USA, 1954. Nakajo, S., Mori, N., Kim, S. Y., Yasauda, T., Yamada, F., and Mase, H.: Basic study on
estima-25
tion method of return period and variation range of severe storm surge event, Coast. Eng., 256–260, 2014,
National Hurricane Center: Hurricane Katrina Intermediate Advisory No. 23a, 1.00 p.m. CDT, available at: http://www.nhc.noaa.gov/archive/2005/pub/al122005.public_a.023.shtml (last access: 23 October 2015), 2005.
30
NHESSD
3, 6431–6457, 2015Maximum wind radius estimated by
the 50 kt radius
H. Takagi and W. Wu
Title Page
Abstract Introduction
Conclusions References
Tables Figures
◭ ◮
◭ ◮
Back Close
Full Screen / Esc
Printer-friendly Version Interactive Discussion
Discussion
P
a
per
|
Discussion
P
a
per
|
Discussion
P
a
per
|
Discussion
P
a
per
Persing, J. and Montgomery, M. T.: Is environmental CAPE important in the determination of maximum possible hurricane intensity?, J. Atmos. Sci., 62, 542–550, 2005.
Quiring, S., Schumacher, A., Labosier, C., and Zhu, L.: Variations in mean annual tropical cyclone size in the Atlantic, J. Geophys. Res., 116, D09114, doi:10.1029/2010JD015011, 2011.
5
Roeber, V. and Bricker, J. D.: Destructive tsunami-like wave generated by surf beat over a coral reef during Typhoon Haiyan, Nat. Commun., 6, 7854 doi:10.1038/ncomms8854, 2015. Sampson, C. R., Jeffries, L. R., Chu, J. H., and Neumann, C. J.: Tropical Cyclone
Forecast-ers Reference Guide 6, Tropical Cyclone Intensity, NRL/PU/7541-95-001, Naval Research Laboratory, USA, 1995.
10
Shea, D. J. and Gray, W. M.: The hurricane’s inner core region. I. Symmetric and asymmetric structure, J. Atmos. Sci., 30, 1544–1564, 1973.
Tajima, Y., Yasuda, T., Pacheco, B., Cruz, E., Kawasaki, K., Nobuoka, H., Miyamato, M. Asano, Y., Arikawa, T., Origas, N. M., Aquino, R., Mata, W., Valdez, J., and Briones, F.: Initial report of JSCE-PICE joint survey on the storm surge disaster caused by Typhoon Haiyan,
15
Coastal Eng. J., 56, 1450006, doi:10.1142/S0578563414500065, 2014.
Takagi, H., Kashihara, H., Esteban, M., and Shibayama, T.: Assessment of fu-ture stability of breakwaters under climate change, Coast. Eng. J., 53, 21–39, doi:10.1142/S0578563411002264, 2011.
Takagi, H., Nguyen, D. T., Esteban, M., Tam, T. T., Knaepen, H. L., and Mikami, T.:
Vulnera-20
bility of coastal areas in Southern Vietnam against tropical cyclones and storm surges, the 4th International Conference on Estuaries and Coasts (ICEC2012), Hanoi, Vietnam, p. 8, 2012.
Takagi, H., Esteban, M., Shibayama, T., Mikami, T., Matsumaru, R., Nguyen, D. T., Oyama, T., and Nakamura, R.: Track analysis, simulation and field survey of the 2013 Typhoon Haiyan
25
Storm Surge, J. Flood Risk Manage., doi:10.1111/jfr3.12136, in press, 2015a.
Takagi, H. and Esteban, M.: Statistics of Tropical Cyclone Landfalls in the Philippines – Unusual Characteristics of 2013 Typhoon Haiyan, Nat. Hazards, doi:10.1007/s11069-015-1965-6, in press, 2015b.
Vickery, P. and Wadhera, D.: Statistical models of Holland pressure profile parameter and
ra-30
NHESSD
3, 6431–6457, 2015Maximum wind radius estimated by
the 50 kt radius
H. Takagi and W. Wu
Title Page
Abstract Introduction
Conclusions References
Tables Figures
◭ ◮
◭ ◮
Back Close
Full Screen / Esc
Printer-friendly Version Interactive Discussion
Discussion
P
a
per
|
Discussion
P
a
per
|
Discussion
P
a
per
|
Discussion
P
a
per
|
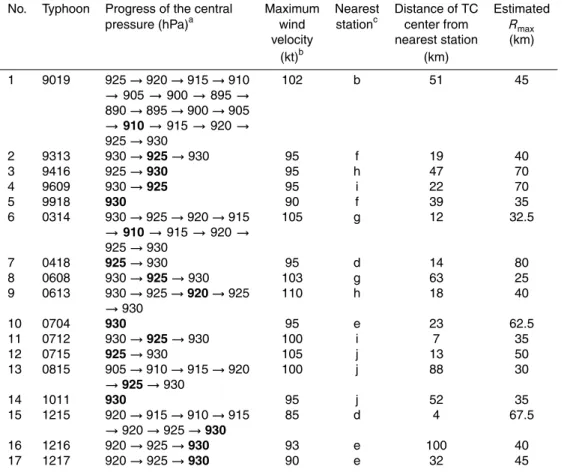
Table 1.Characteristics of the 17 typhoons selected for this study.
No. Typhoon Progress of the central Maximum Nearest Distance of TC Estimated pressure (hPa)a wind stationc center from Rmax
velocity nearest station (km)
(kt)b (km)
1 9019 925→920→915→910
→905→900→895→
890→895→900→905
→910→915→920→
925→930
102 b 51 45
2 9313 930→925→930 95 f 19 40
3 9416 925→930 95 h 47 70
4 9609 930→925 95 i 22 70
5 9918 930 90 f 39 35
6 0314 930→925→920→915
→910→915→920→
925→930
105 g 12 32.5
7 0418 925→930 95 d 14 80
8 0608 930→925→930 103 g 63 25
9 0613 930→925→920→925
→930
110 h 18 40
10 0704 930 95 e 23 62.5
11 0712 930→925→930 100 i 7 35
12 0715 925→930 105 j 13 50
13 0815 905→910→915→920
→925→930
100 j 88 30
14 1011 930 95 j 52 35
15 1215 920→915→910→915
→920→925→930
85 d 4 67.5
16 1216 920→925→930 93 e 100 40
17 1217 920→925→930 90 e 32 45
a
The numbers in bold indicate the pressure of the typhoon, when it passed the station. b
The maximum wind velocities (Vmax) presented are from when the typhoon passed near a station. c
NHESSD
3, 6431–6457, 2015Maximum wind radius estimated by
the 50 kt radius
H. Takagi and W. Wu
Title Page
Abstract Introduction
Conclusions References
Tables Figures
◭ ◮
◭ ◮
Back Close
Full Screen / Esc
Printer-friendly Version Interactive Discussion
Discussion
P
a
per
|
Discussion
P
a
per
|
Discussion
P
a
per
|
Discussion
P
a
per
Figure 1.Ten meteorological stations along the Japanese archipelago operated by the Japan Meteorological Agency (JMA): Minamidaitoujima (a), Naze (b), Okinoerabu (c), Nago (d), Naha(e), Kumejima (f), Miyakojima (g), Ishigakijima (h), Iriomotejima (i), and Yonagunijima
NHESSD
3, 6431–6457, 2015Maximum wind radius estimated by
the 50 kt radius
H. Takagi and W. Wu
Title Page
Abstract Introduction
Conclusions References
Tables Figures
◭ ◮
◭ ◮
Back Close
Full Screen / Esc
Printer-friendly Version Interactive Discussion
Discussion
P
a
per
|
Discussion
P
a
per
|
Discussion
P
a
per
|
Discussion
P
a
per
|
NHESSD
3, 6431–6457, 2015Maximum wind radius estimated by
the 50 kt radius
H. Takagi and W. Wu
Title Page
Abstract Introduction
Conclusions References
Tables Figures
◭ ◮
◭ ◮
Back Close
Full Screen / Esc
Printer-friendly Version Interactive Discussion
Discussion
P
a
per
|
Discussion
P
a
per
|
Discussion
P
a
per
|
Discussion
P
a
per
|
NHESSD
3, 6431–6457, 2015Maximum wind radius estimated by
the 50 kt radius
H. Takagi and W. Wu
Title Page
Abstract Introduction
Conclusions References
Tables Figures
◭ ◮
◭ ◮
Back Close
Full Screen / Esc
Printer-friendly Version Interactive Discussion
Discussion
P
a
per
|
Discussion
P
a
per
|
Discussion
P
a
per
|
Discussion
P
a
per
|
NHESSD
3, 6431–6457, 2015Maximum wind radius estimated by
the 50 kt radius
H. Takagi and W. Wu
Title Page
Abstract Introduction
Conclusions References
Tables Figures
◭ ◮
◭ ◮
Back Close
Full Screen / Esc
Printer-friendly Version Interactive Discussion
Discussion
P
a
per
|
Discussion
P
a
per
|
Discussion
P
a
per
|
Discussion
P
a
per
|
NHESSD
3, 6431–6457, 2015Maximum wind radius estimated by
the 50 kt radius
H. Takagi and W. Wu
Title Page
Abstract Introduction
Conclusions References
Tables Figures
◭ ◮
◭ ◮
Back Close
Full Screen / Esc
Printer-friendly Version Interactive Discussion
Discussion
P
a
per
|
Discussion
P
a
per
|
Discussion
P
a
per
|
Discussion
P
a
per