Crop Breeding and Applied Biotechnology 7: 360-366, 2007
Brazilian Society of Plant Breeding. Printed in Brazil
Received 28 June 2007
Accepted 26 August 2007
ABSTRACT - The objective of this study was to estimate parameters related to the ability of competing or tolerating competition. The experiments were conducted in three seasons, using eight common bean lines with carioca type grains from different origins. Competition at the plant level was evaluated based on the number of pods, number of grains and grain weight (g plant-1). The following competition-related parameters were estimated with the mean data, using a model similar to the diallel: general competing ability (ci), competition tolerance (tj), specific competing ability (sij) and performance per se of every line (aj). The average performance of lines in self-competition was similar to non-self-competition. None of the lines coupled low competing ability (ci high) with high competition tolerance. Highest estimates of aj and ci were observed in line OPNS 331.
Key words: common bean, non-self-competition, self competition.
Estimation of competition parameters in common bean
Estimation of competition parameters in common bean
Estimation of competition parameters in common bean
Estimation of competition parameters in common bean
Estimation of competition parameters in common bean
plants
plants
plants
plants
plants
Vanessa Maria Pereira e Silva1, Magno Antonio Patto Ramalho1*, Ângela de Fátima Barbosa Abreu2, andFlávia Barbosa Silva1
1 Departamento de Biologia, Universidade Federal de Lavras (UFLA), C.P. 3037, 37.200-000, Lavras, MG, Brasil. *E-mail: [email protected] 2 Embrapa Arroz e Feijão, UFLA
INTRODUCTION
Most subsistence farmers in Brazil do not purchase seed regularly but use grain harvested in previous growing seasons. It has been stated that their “cultivars” are actually mixtures of different lines. These mixtures, so it seems, allow for some advantages, such as greater stability (Becker and Léon 1988, Bruzi et al. 2006).
Another advantage ascribed to the blends would be higher yields, owing to the better performance of plants in non-self-competition, i.e., in competition with plants of other genotypes, than in self-competition (Donald 1963). This comparison was subject of several studies for several decades (Bisognin 1995, Mastrantonio 2004). The advantages of the blends were confirmed in some situations, as for example in common
bean (Federer et al. 1982), soybean (Gizlice et al. 1989) and oat (Helland and Holland 2001). Nevertheless, information on this issue, above all on how to estimate self and non-self-competition effects, is still fragmentary.
On this background, the purpose of this study was to compare self- and non-self-competition, estimate parameters related to the plant ability of competing or tolerating competition and identify promising lines for the development of multilines.
MATERIAL AND METHODS
The experiments were conducted on an experimental area of the Universidade Federal de Lavras, in Lavras, a city in the southern region of the state of Minas Gerais (lat 21o58’ S, long 45o22’ W, 918 m asl).
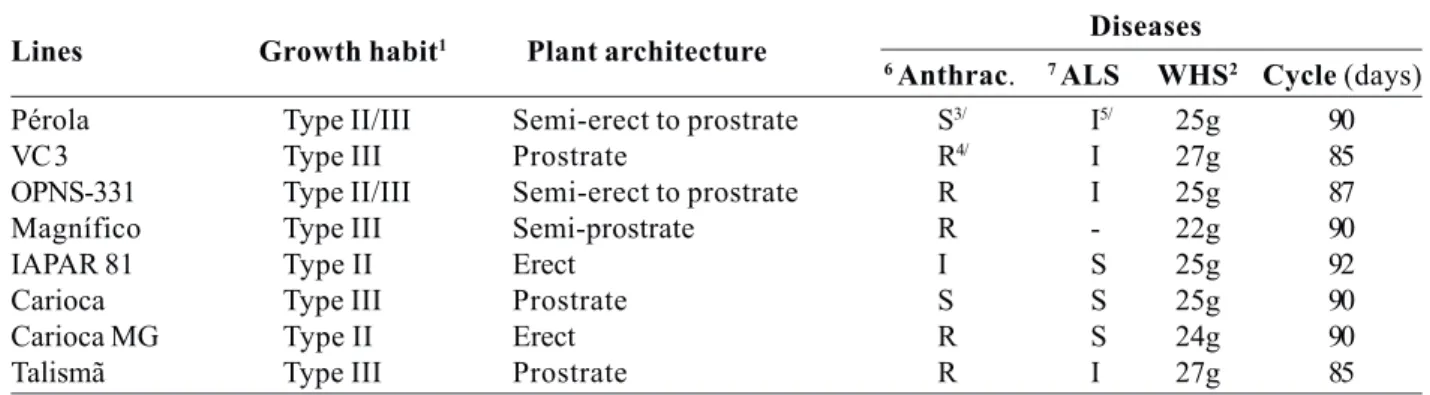
Eight carioca type lines were used, that is, with cream-colored and brown-striped grains. The description of the lines and phenotypes of some traits are presented in Table 1.
The experiments were conducted in the three possible common bean growing seasons of the region: winter - sowing in July 2005, wet - sowing in November 2005 and dry - sowing in February 2006. Eight different experiments were conducted in each growing season, altering only the competing line (identified by “x” in Figure 1). The plants were arranged in a system of nine hills and data were collected from the central plant (test) while the others of the same line exerted competition. In each row the test hill was replicated eight times. Note that in each experiment the eight lines were subjected to competition of the same line.
The distance between hills was 30 cm. To warrant the same spacing between all hills a sowing furrow was opened at 30 cm distance and the exact hill marked by a ruler at every 30 cm. The test hill was determined previously by a ruler to facilitate sowing. Three seeds were sown per hill and thinned to one plant per hill after
1 x x x x x x x x x x x x x x x x x x x x x x x x x x x x x x x x x x x 2 x 1 x x x 1 x x x 1 x x x 1 x x x 1 x x x 1 x x x 1 x x x 1 x x x x x 3 x x x 2 x x x 2 x x x 2 x x x 2 x x x 2 x x x 2 x x x 2 x x x 2 x x x 4 x 3 x x x 3 x x x 3 x x x 3 x x x 3 x x x 3 x x x 3 x x x 3 x x x x x 5 x x x 4 x x x 4 x x x 4 x x x 4 x x x 4 x x x 4 x x x 4 x x x 4 x x x 6 x 5 x x x 5 x x x 5 x x x 5 x x x 5 x x x 5 x x x 5 x x x 5 x x x x x 7 x x x 6 x x x 6 x x x 6 x x x 6 x x x 6 x x x 6 x x x 6 x x x 6 x x x 8 x 7 x x x 7 x x x 7 x x x 7 x x x 7 x x x 7 x x x 7 x x x 7 x x x x x 9 x x x 8 x x x 8 x x x 8 x x x 8 x x x 8 x x x 8 x x x 8 x x x 8 x x x 10 x x x x x x x x x x x x x x x x x x x x x x x x x x x x x x x x x x x
Figure1. Arrangement of one of the experiments in the competition study of common
bean plants, where “x” represents the competing line. One of the eight lines was used in each experiment. Numbers in bold represent lines under competition; each number corresponds to a different line
approximately 15 days. Only plants with the full set of eight neighboring plants were considered to be competing.
Fertilization was applied in the sowing furrow with 300 kg ha-1 of the mixture 8-28-16 of N, P
2O5 and K2O plus Zn and 150 kg ha-1 of ammonium sulphate, applied in top dressing. In the dry and winter seasons the crop was sprinkle-irrigated. Weeds were controlled by the post-emergent herbicides Fomesafen and Fluazifop-p-butil and the common crop practices of the region applied.
The plants in competition were harvested separately. The number of pods, number of grains and grain weight (g plant-1) of each plant was recorded. The plant data were subjected to analysis of variance of the type among and within and count data were transformed
by x. The analyses per growing season and per
experiment were performed first, followed by the joint analysis of variance of the three seasons, using software SAS-PROC GLM (SAS 2000).
The competition parameters were estimated with the mean data, based on the following model:
Table 1. Phenotypes of some traits of the lines related to self and non-self-competition
Diseases Lines Growth habit1
Plant architecture
6 Anthrac. 7 ALS WHS2 Cycle (days)
Pérola Type II/III Semi-erect to prostrate S3/ I5/ 25g 90
VC 3 Type III Prostrate R4/ I 27g 85
OPNS-331 Type II/III Semi-erect to prostrate R I 25g 87
Magnífico Type III Semi-prostrate R - 22g 90
IAPAR 81 Type II Erect I S 25g 92
Carioca Type III Prostrate S S 25g 90
Carioca MG Type II Erect R S 24g 90
Talismã Type III Prostrate R I 27g 85
Y _
ij=m+ci+zj+sij+eij, where: Y
_
ij: per plant mean of line j
under competition of line i; m: overall mean; ci:
competing ability of line i; zj: competition tolerance of
line j. This component involves the per se effect of the line in competition (aj) and the effect of the proper
competition tolerance (tj), that is, zj =aj+tj. The per se
effect of the line in competition aj was estimated
considering that i = j, that is, line i in competition with itself. So, a^j=Y
_
jj_Y
_
and t^j=z^j
_
a^j; sij: is the specific
competing ability of the pair of lines i and j; eij:
experimental error associated to the mean Y_jj , where
eij ∩ N (0, σ2 ).
The least square method was used to estimate the parameters ci, zj and sij in the expression:β^=(X’X)-1X’Y, where: β^: vector of the parameters to be estimated; X: coefficient matrix of the model; Y: vector of observations. SAS-PROC IML (SAS 2000) was used for resolution of the system.
RESULTS AND DISCUSSION
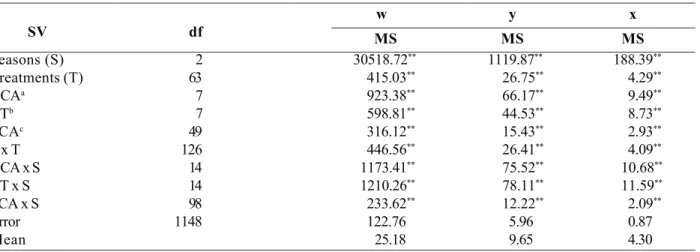
The summaries of the joint analysis involving all experiments and seasons are presented in Table 2, in which significant differences (P<0.01) between seasons were observed for the three traits. Significant differences (P<0.01) among treatments were stated as well. All sources of variation involving the general competing ability (GCA), competition tolerance (CT) and specific competing ability (SCA) were significant (P<0.01). The significance of the seasons x treatments interactions
suggests that the performance of the competing lines was not coincident in the different seasons. Although the interaction was significant, the differences in terms of estimates of the competition parameters were of small magnitude. In view thereof, our considerations focused on the mean performance of the three seasons.
The correlations of the three evaluated traits yield per plant, number of grains per plant and number of pods per plant are normally high and positive (Ramalho et al. 1993). In this study it was further stated that the line performance was very similar in the three traits; the discussion was therefore focused specifically on grain yield per plant.
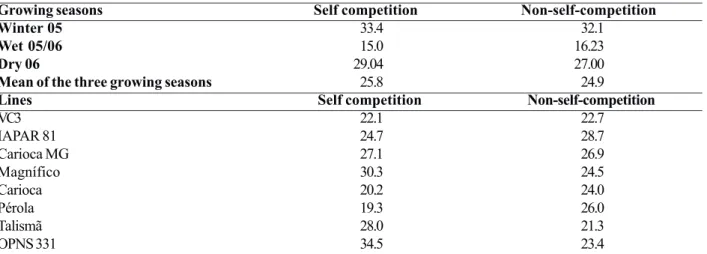
The effect of self competition, that is, competition of a line with itself, is presented along the diagonal of Table 3 and of non-self-competition, which is competition exerted by plants of other lines, in the values above and below the diagonal. In the overall mean of the growing seasons and eight lines, the plants under self competition produced 3.5% more grains than in non-self-competition, that is, very similar values (Table 4). There are reports in the literature, with other species, where self and non-self-competition were also similar, as observed here (Stringfield 1959). Nevertheless, in several studies the blend performed better than monoculture were observed with common bean, where the mean yield of the blend was 8.35% higher than in monoculture. In this sense, Mastrantonio et al. (2004) stated that the blend of common bean lines may stimulate grain yield. In other crops such as soybean and
Table 2. Summary of the joint analysis of variance involving all experiments and growing seasons for the traits grain yield (w), number of grains per plant ( y ) and number of pods per plant ( x)
w y x SV df MS MS MS
Seasons (S) 2 30518.72** 1119.87** 188.39**
Treatments (T) 63 415.03** 26.75** 4.29**
GCAa 7 923.38** 66.17** 9.49**
CTb 7 598.81** 44.53** 8.73**
SCAc 49 316.12** 15.43** 2.93**
S x T 126 446.56** 26.41** 4.09**
GCA x S 14 1173.41** 75.52** 10.68**
CT x S 14 1210.26** 78.11** 11.59**
SCA x S 98 233.62** 12.22** 2.09**
Error 1148 122.76 5.96 0.87
Mean 25.18 9.65 4.30
**Significant at 1% probability, by the F test
oat, gains of the blends were observed compared to monoculture (Bisognin et al. 1995, Helland and Holland 2001). As emphasized above, the methodologies these authors used were not the same as used here.
Based on line OPNS 331 as reference, it was observed that the grain yield in self-competition was 32.2% higher
Table 3. Means of the three growing seasons for grain yield (w), number of grains (y) and pod number per plant (x) found in the competition experiments involving lines that exert competition and others affected by competition
Experiments Lines under competition
VC3 IAPAR 81 Carioca MG Magnífico Carioca Pérola Talismã OPNS 331 Mean
V C 3 22.1 25.4 28.5 22.7 20.2 27.4 22.3 21.1 23.7
IAPAR 81 20.6 24.7 23.8 23.0 21.1 22.8 20.1 18.5 21.8
Carioca MG 28.8 31.0 27.1 23.4 30.2 28.0 18.4 22.5 26.2
Magnífico 31.1 27.7 21.7 30.3 23.1 19.4 17.4 28.8 24.9
w
Carioca 19.4 22.2 29.2 29.8 20.2 25.2 23.0 18.1 23.4
P é r o l a 26.7 27.4 30.3 21.2 21.6 19.3 20.6 31.5 24.8
Talismã 25.3 34.5 27.9 21.1 30.1 26.8 28.0 23.5 27.1
OPNS 331 29.0 33.1 26.7 30.4 21.8 32.9 26.8 34.5 29.4
Mean 25.4 28.2 26.9 25.2 23.5 25.2 22.1 24.8
V C 3 88.4 98.0 121.0 77.4 72.3 96.0 88.4 74.0 88.4
IAPAR 81 81.0 82.8 90.3 81.0 68.9 77.4 74.0 56.3 75.7
Carioca MG 104 125.4 102.0 90.3 114.5 112.4 68.9 79.2 98.0
y Magnífico 116.6 108.2 81.0 134.6 79.2 59.3 72.3 108.2 92.2
Carioca 75.7 75.7 104.0 121.0 72.3 84.6 86.5 60.8 84.6
P é r o l a 104.0 108.2 130.0 81.0 81.0 70.6 82.8 123.2 96.0
Talismã 90.3 123.2 114.5 79.2 82.8 82.8 90.3 81.0 92.2
OPNS 331 114.5 132.3 121.0 139.2 86.5 121.0 104.0 132.3 118.8
Mean 96.8 106.7 108.0 100.5 82.2 88.0 83.4 89.4
V C 3 17.6 20.3 25.0 16.0 16.0 19.4 17.6 16.0 18.5
IAPAR 81 16.8 18.5 17.6 14.4 13.7 14.4 16.8 11.6 15.2
Carioca MG 19.4 27.0 21.2 16.8 22.1 22.1 15.2 16.0 20.3
x Magnífico 22.1 23.0 15.2 26.0 14.4 13.7 16.0 22.1 18.5
Carioca 14.4 16.8 22.1 23.0 14.4 16.8 18.5 12.3 16.8
P é r o l a 20.3 21.2 24.0 15.2 16.0 13.0 16.8 24.0 18.5
Talismã 16.8 25.0 22.1 14.4 16.0 15.2 18.5 16.8 17.6
OPNS 331 21.2 27.0 22.1 25.0 17.6 22.1 23.0 24.0 23.0
Mean 18.6 22.4 21.2 18.9 16.3 17.1 17.8 17.8
Table 4. Means of self competition and of non-self-competition for grain yield (g plant-1) in the three growing seasons, in the overall
mean, and for each line separately
Growing seasons Self competition Non-self-competition
Winter 05 33.4 32.1
Wet 05/06 15.0 16.23
Dry 06 29.04 27.00
Mean of the three growing seasons 25.8 24.9
Lines Self competition Non-self-competition
VC3 22.1 22.7
IAPAR 81 24.7 28.7
Carioca MG 27.1 26.9
Magnífico 30.3 24.5
Carioca 20.2 24.0
Pérola 19.3 26.0
Talismã 28.0 21.3
OPNS 331 34.5 23.4
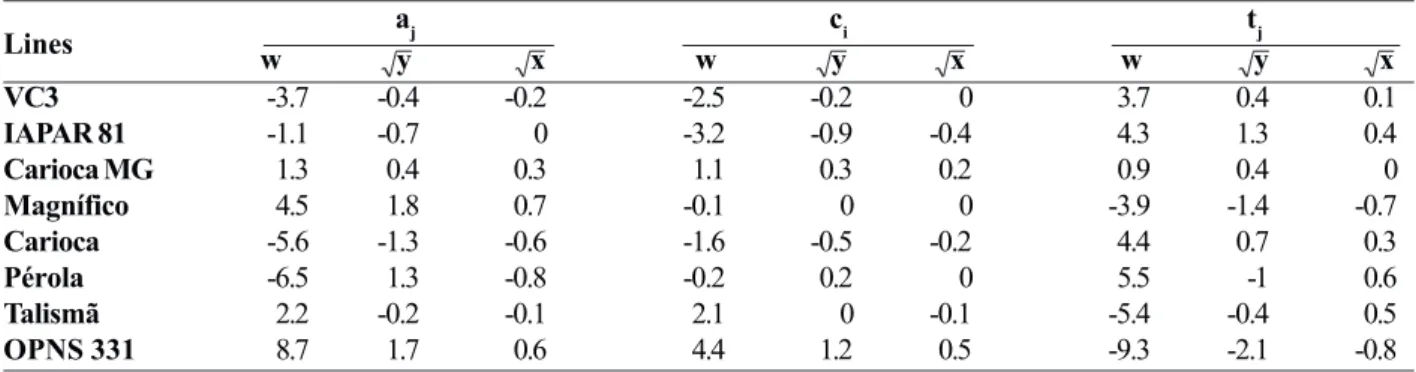
response in non-self-competition was not affected by the fact that the lines differed in growth habit (Table 1). Four parameters were estimated to evaluate the effect of competition, that is, the per se performance of line (aj): the general competing ability (ci), competition tolerance (tj) and specific competing ability (sij). The highest aj estimates were obtained for OPNS 331 and Magnífico, evidencing that these lines perform well in self-competition (Table 5).
The more negative the ci value, the more
competitive is the line, in other words, the performance dropped more markedly in the treatment under competition. The most competitive line for the three traits was IAPAR 81. The least competitive, on the other hand (positive ci estimate), was OPNS 331 (Table 5). As mentioned above, the tj estimate expresses competition tolerance, which also varied among lines. Note that a positive tj value indicates a tolerant line. Pérola was least affected by competition (most tolerant) while OPNS 331 was the least tolerant (Table 5). The estimates of correlation c vs t, in all growing seasons, were negative and high, confirming the above observation (Table 6). It was concluded that the identification of lines that exert little competition (positive and high ci) and suffer less competition (positive and high tj) will be difficult. The correlations between the estimates of a vs t were always negative, i.e., lines with greater yield potential are less competition-tolerant (Table 6). The a vs c correlations however were always positive, that is, the lines with highest per se performance exert little competition. As they compete strongly with each other (low aj estimate), they provide conditions that enable
Table 5. Estimate of the per se performance of the lines (aj), general competing ability (ci) and competition tolerance (tj) for grain yield
(w), number of grains per plant ( y ) and number of pods per plant ( x ), in the mean of the growing seasons
Lines aj ci tj
w y x w y x w y x
VC3 -3.7 -0.4 -0.2 -2.5 -0.2 0 3.7 0.4 0.1
IAPAR 81 -1.1 -0.7 0 -3.2 -0.9 -0.4 4.3 1.3 0.4
Carioca MG 1.3 0.4 0.3 1.1 0.3 0.2 0.9 0.4 0
Magnífico 4.5 1.8 0.7 -0.1 0 0 -3.9 -1.4 -0.7
Carioca -5.6 -1.3 -0.6 -1.6 -0.5 -0.2 4.4 0.7 0.3
Pérola -6.5 1.3 -0.8 -0.2 0.2 0 5.5 -1 0.6
Talismã 2.2 -0.2 -0.1 2.1 0 -0.1 -5.4 -0.4 0.5
OPNS 331 8.7 1.7 0.6 4.4 1.2 0.5 -9.3 -2.1 -0.8
Table 6. Estimate of the correlations between the per se performance of the line (a), general competing ability (c) and competition tolerance (t), for grain yield (w), number of grains per plant (y) and number of pods per plant (x), in the three growing seasons
Correlations Growing seasons Traits a and c a and t c and t Winter 05 w 0.70* -0.87** -0.81*
y 0.62 -0.77* -0.72*
x 0.62 -0.77* -0.80*
Wet w 0.80* -0.80* -0.34**
05/06 y 0.79* -0.82** -0.89**
x 0.70* -0.78* -0.86**
Dry 06 w 0.68 -0.95** -0.81*
y 0.78* -0.96** -0.84**
x 0.54 -0.97** -0.61
Harvest mean w 0.73* -0.93** -0.85**
y 0.74* -0.89** -0.83**
x 0.49 -0.85** -0.67
** , * Significant at 1% and 5% probability, by the T test
neighboring plants to express their yield potential. A negative value of specific competing ability indicates that a pair of lines is not a good combination and vice versa. In this regard, the combination Magnífico - Carioca was an outstanding pair with good performance in the three traits (Table 7).
in non-self-competition. However, if a multiline involves a blend of non-isogenic lines that contain different alleles of pathogen resistance, aiming not only at durable resistance but greater grain yield stability as well (Becker and Léon 1988, Bruzi et al. 2006), the lines to be blended must associate high aj, ci and tj, which is not easily obtained. An alternative would be to evaluate the performance of line blends, rather than only the combination of two lines, as some authors have reported
(Federer et al. 1982, Helland and Holland 2001).
ACKNOWLEDGEMENTS
The authors gratefully acknowledge the financial support of the Conselho Nacional de Desenvolvimento Científico e Tecnológico (CNPq) and Fundação de Amparo à Pesquisa do Estado de Minas Gerais (FAPEMIG).
Estimação de Parâmetros de Competição entre Plantas
Estimação de Parâmetros de Competição entre Plantas
Estimação de Parâmetros de Competição entre Plantas
Estimação de Parâmetros de Competição entre Plantas
Estimação de Parâmetros de Competição entre Plantas
do Feijoeiro
do Feijoeiro
do Feijoeiro
do Feijoeiro
do Feijoeiro
RESUMO - O trabalho objetivou estimar parâmetros relacionados à capacidade de exercer ou tolerar a competição. Os experimentos foram conduzidos em três safras, utilizando oito linhagens de feijão, com grãos tipo carioca, de diferentes origens. A competição foi avaliada em nível de planta, sendo obtido o número de vagens, o número de grãos e o peso dos grãos (g/planta). Com os dados médios, utilizando modelo semelhante ao dos cruzamentos dialélicos, foram estimados os parâmetros associados à competição: capacidade geral de exercer competição (ci), capacidade de tolerar a competição (tj), Table 7. Estimate of parameters of the specific competing ability (sij) for grain yield (w), number of grains ( y ) and number of pods ( x) per plant, in the mean of the growing seasons
Experiments Lines under competition
VC3 IAPAR 81 Carioca MG Magnífico Carioca Pérola Talismã OPNS 331 VC3 -0.3 -0.3 3.8 -0.4 -1.0 -4.2 3.1 -0.8
IAPAR 81 -1.2 -0.4 -0.3 0.5 0.6 1.9 1.5 -2.7
Carioca MG 2.7 1.6 -1.2 -3.4 5.3 2.8 -4.6 -3.1
w Magnífico 6.2 -0.5 -5.4 4.8 -0.6 -4.6 -4.3 4.4 Carioca -4.0 -4.5 3.6 5.9 -1.9 2.7 2.9 -4.7
Pérola 1.9 -0.7 3.3 -4.2 -2.0 -4.6 -1.0 7.2
Talismã -1.8 4.1 -1.4 -6.7 4.2 0.6 4.1 -3.1
OPNS 331 -0.4 0.4 -4.9 0.4 -6.3 4.4 0.6 5.7
VC3 -0.1 -0.2 0.8 -1.0 -0.4 0.7 0.5 -0.4
IAPAR 81 0.2 -0.2 0.0 -0.2 0.2 0.3 0.5 -0.8
Carioca MG 0.2 0.6 -0.6 -0.9 1.3 1.0 -1.1 -0.6
y Magnífico 1.1 0.1 -1.5 1.5 -0.2 -1.6 -0.6 1.1 Carioca -0.6 -1.1 0.3 1.4 -0.1 0.3 0.7 -1.0
Pérola 0.3 -0.1 0.8 -1.2 -0.2 -1.1 -0.1 1.7
Talismã -0.2 0.9 0.3 -1.2 0.1 -0.2 0.5 -0.2
OPNS 331 -0.3 0.0 -0.7 0.5 -1.0 0.4 0.0 1.0
VC3 -0.1 -0.2 0.4 -0.4 0.0 0.3 0.1 -0.2
IAPAR 81 0.2 0.0 -0.1 -0.2 0.0 0.1 0.3 -0.4
Carioca MG 0.1 0.3 -0.1 -0.4 0.5 0.4 -0.4 -0.3
x Magnífico 0.4 0.1 -0.8 0.7 -0.2 -0.5 -0.2 0.5 Carioca -0.3 -0.5 0.3 0.6 -0.1 0.2 0.3 -0.5
Pérola 0.2 -0.1 0.3 -0.5 0.0 -0.5 -0.1 0.7
Talismã -0.1 0.3 0.2 -0.5 0.0 -0.2 0.2 0.0
REFERENCES
Becker HC and LÉON J (1988) Stability analysis in plant breeding. Plant Breeding 101: 1-23.
Bisognin DA, Vernetti FJ, Gastal MFC and Zonta EP (1995) C o m p e t i ç ã o i n t e r g e n o t í p i c a e m s o j a . P e s q u i s a Agropecuária Brasileira 30: 947-955.
Bruzi AT, Ramalho MAP, Abreu A de FB, Ferreira DF and Sena MR (2006) Homeostasis of common bean populations with different genetic structures. Crop Breeding and Applied Biotechnology 7: 203-214.
Donald CM (1963) Competition among crop and pasture plants.
Advances in Agronomy 15: 1-118.
Federer WT, Connigale JC, Rutger JN and Wijesinha A (1982) Statistical analyses of yields from uniblends and biblends of eight dry bean cultivars. Crop Science 22: 111-115.
Gizlice Z, Carter TE, JR, Burton JW and Emigh TH (1989) Partitioning of blending ability using two-way blends and component lines of soybean. Crop Science 29: 885-889.
capacidade específica de competição (sij) e o desempenho per se da linhagem (aj). A performance média das linhagens em autocompetição foi semelhante à alocompetição. Nenhuma linhagem associou baixa capacidade de exercer competição e alta capacidade de tolerar a competição. A linhagem OPNS 331 apresentou a maior estimativa de aj e ci.
Palavras-Chave: autocompetição, alocompetição e feijoeiro.
Helland SJ and Holland JB (2001) Blend response and stability and cultivar blending ability in oat. Crop Science 41: 1689-1 6 9 6 .
Mastrantonio JJS, Antunes IF, Zonta EP, Emygdio BM, Ccosta C, Lobato L, Silva SDA and Silveira EP (2004) Interferência em misturas de feijão. Ciência Rural34: 373-377.
Mundt CC (2002) Use of multiline cultivars and cultivar mixtures for disease management. Annu Rev Phytopathol 40: 381-4 1 0 .
Ramalho MAP, Santos JB and Zimmermann MJO (1993) Ge-nética quantitativa em plantas autógamas: aplicações ao melhoramento do feijoeiro. Goiânia, 271p.
SAS Institute. SAS/STAT User’s Guide, Version 8. Cary, 2 0 0 0 .
Stringfield GH (1959) Performance of corn hybrids in mixtures.