© School of Engineering, Taylor’s University College
BATCH ANAEROBIC TREATMENT OF FRESH LEACHATE FROM TRANSFER STATION
SEYED MOHAMMAD DARA GHASIMI*, AZNI IDRIS, FAKHRU'L RAZI AHMADUN, BENG TI TEY, TEONG GUAN CHUAH
Department of Chemical and Environmental Engineering, Faculty of Engineering, Universiti Putra Malaysia, 43400 UPM Serdang, Malaysia
*Corresponding Author: environmental20@gmail.com
Abstract
Leachate from transfer station requires treatment before being discharged into the environment to avoid surface and underground water contamination. Various factors such as waste composition, availability of oxygen and moisture, designing and controlling of transfer station operations have been shown to affect the composition of the leachate. The high COD, BOD, ammonia nitrogen (NH3-N) and heavy metals contents of fresh leachate are the main problems faced by leachate treatment operators. The result of the present study indicated that this process reduced the COD content by 43%.The average removal efficiencies of BOD5, TS, TSS, and VSS were 80, 49, 37 and 39 %, respectively.
Keywords: Biological treatment, Leachate treatment, Anaerobic process, COD removal
1. Introduction
Municipal solid waste (MSW) transfer station is a facility to receive the production source of MSW before the waste is transported to a remote landfill. It serves as the link in collection transportation and disposal in the MSW management. To meet the development needs of MSW comprehensive disposal plan, the MSW operator has, considering the characteristics of domestic MSW, developed a series of transfer station processes and whole-set equipment by introducing and developing advanced technologies from abroad. MSW transfer station compresses garbage into bulk before transferring it in a clean and efficient way to reduce the volume of transferred waste and remove the leachate content from the waste.
Nomenclatures
BOD Biochemical oxygen demand
BOD5 Biochemical oxygen demand using a 5-day test COD Chemical oxygen demand
BOD/COD Biodegradability FSS Fixed suspended solids MSW Municipal solid waste NH3-N Ammonia nitrogen
-3 4
PO Phosphate
SMP Soluble microbial product TBTS Taman Beringin transfer station TS Total solids
TSS Total suspended solids
VSS Volatile suspended solids
effects of surrounding and internal working condition, MSW transfer station takes active measures to prevent pollution of dust, odour and sewage. Besides, based on the characteristics of specific waste and disposal requirements, MSW transfer station may build pre-treatment plant to enhance its functions and efficiency.
The leachate composition from transfer station can vary depending on several factors, including the degree of compaction, waste composition, climate and moisture content in waste. As a general rule, leachate is characterized by high values of COD, pH, ammonia nitrogen and heavy metals, as well as strong colour and bad odour. At the same time, the characteristics of the leachate also vary with regards to its composition and volume, and biodegradable matter present in the leachate against time [1, 2]. All these factors make leachate treatment difficult and complicated.
Anaerobic treatment is a biological process in which organic matter is degraded into a series of gaseous products, mainly CH4, CO2 and H2, and its liquid effluent containing the most refractive compounds with significant presence of nitrogen, phosphorus and mineral compounds such as K, Ca and Mg. The conversion of the organic compounds to methane is a very complex process and requires the presence of different microbial species.
Many different methods are currently in use to treat the landfill leachate. Most of these methods are adapted for wastewater treatment process and can be divided into two main categories: biological treatments and physical/chemical treatments. Table 1 presents the results of biological treatment of landfill leachate based on COD and BOD removal [3].
Table 1. Biological Treatment of Landfill Leachate [3].
Methods Past literature
COD Removal
(%)
BOD Removal
(%)
Recirculation Diamadopoulos [4] 90 98
Granular activated carbon-biological fluidized bed
Horan et al [5] 55 -
Rotating biological contactors (RBC)
Henderson and Atwater [6]
The main objective of this study was to investigate the potential of the application of anaerobic treatment system in COD removal in the fresh leachate treatment from transfer station. In this treatment process fresh leachate from Taman Beringin transfer station (TBTS), Kuala Lumpur, Malaysia was used. The pH of the anaerobic process was not controlled through out the entire treatment process and there was no inoculum added.
2. Experimental
Raw leachate was collected from the (TBTS) owned by Kuala Lumpur City Hall (DBKL) located at Jinjang Utara, Kuala Lumpur (KL). The transfer station occupies an area of more than 16 ha. This transfer station receives approximately 1800 tons of domestic solid wastes per day from KL. The domestic solid wastes contain about 50 to 60% of organic matter. The leachate were collected in 20-L plastic bottles, transported to the laboratory and sieved using a 1.5 mm mesh to remove solid particles such as shell, fiber, and small stones and then stored at 4°C before it was used for anaerobic treatment process.
The anaerobic fermenter used for this study was “BIOSTAT®B-10 L-MO (10 L volume). It was filled with 10 L fresh leachate and the treatment was carried out for 91 days. The batch study was conducted to establish the removal pattern of COD of this anaerobic treatment process. Parameters analyzed were pH, BOD5, COD, total solids (TS), total suspended solids (TSS), volatile suspended solids (VSS), ammonia nitrogen (NH3-N), phosphorous (PO ), and 34 -alkalinity. The techniques used for sampling analyses were in accordance with the Standard Method for the Examination of Water and Wastewater [7], except for ammonia nitrogen concentration (NH3-N) which was detected by the Nessler method (380 HACH DR/2500 spectrophotometer) and phosphorous by the React PV method (490 HACH DR/2500 spectrophotometer). The pH of the anaerobic process was not controlled throughout the running of the entire treatment study and there was no microbial inoculum added. Initial analytical data shows that the untreated leachate contain high quantity of COD (55000 mg/L), ammonia nitrogen (490 mg/L), TS (39000 mg/L), TSS (4700 mg/L) and VSS (3900 mg/L). The experiments were repeated three times to obtain a consistent average. All analyses were undertaken at room temperature of 28±2°C.
3. Results and Discussion
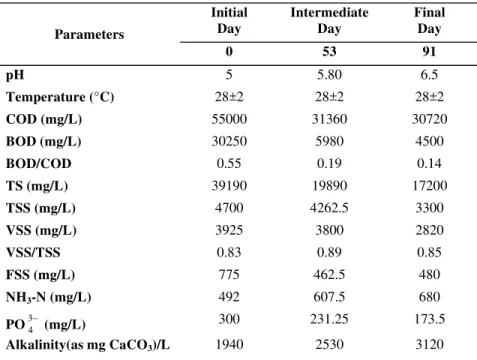
Figures 1-4 show the variation of COD, TSS and VSS, TS and NH3-N over time during anaerobic treatment of fresh leachate. Table 2 depicts the characteristic of fresh and treated leachate at day 53 and day 91 of the anaerobic treatment. The whole duration of batch anaerobic treatment of fresh leachate took 91 days, where day 53 and 91 have been determined as the two selected end points to be discussed in terms of completing the treatment process, of which a comparison between their characteristics is displayed in Table 2.
indicator of the ease of biological treatment. Biological decomposition processes generally start quickly and proceed rapidly with BOD5:COD ratios of 0.5 or greater. Ratios between 0.2 and 0.5 are amenable to biological treatment, but decomposition may proceed more slowly because degrading microorganisms need to become acclimated to the leachate. The BOD:COD ratio of industrial wastewaters is typically less than 0.5, except for wastewaters from the food and beverage industries, which are often significantly higher than 0.5 [8]. Initial alkalinity changed from 1940 to 3120 mg CaCO3/L at day 91 which indicates the increase of pH from 5 to 6.5 in the digestion.
Table 2. Leachate Characteristic in Batch Process for Day 53 and 91.
Initial Day
Intermediate Day
Final Day Parameters
0 53 91
pH 5 5.80 6.5
Temperature (°C) 28±2 28±2 28±2
COD (mg/L) 55000 31360 30720
BOD (mg/L) 30250 5980 4500
BOD/COD 0.55 0.19 0.14
TS (mg/L) 39190 19890 17200
TSS (mg/L) 4700 4262.5 3300
VSS (mg/L) 3925 3800 2820
VSS/TSS 0.83 0.89 0.85
FSS (mg/L) 775 462.5 480
NH3-N (mg/L) 492 607.5 680
PO34− (mg/L) 300 231.25 173.5
Alkalinity(as mg CaCO3)/L 1940 2530 3120
From Table 2, it is clearly shown that VSS/TSS ratio was in good condition during the time of anaerobic treatment (0.83-0.85). A decrease in VSS was also observed during the treatment process; from an initial value of 3925 mg/L to 2820 mg/L for day 91 (end of experiment). It indicates the decomposition of biodegradable organic matter of leachate occurred during the treatment process.
Ammonia is produced as a by-product of anaerobic digestion, principally from the mineralization of organic nitrogen during the deamination of proteins and amino acids. Initial ammonia nitrogen (NH3-N) increased from 492 mg/L to 607 mg/L for day 53 and 680 mg/L for day 91 which proves that the increase in pH, correlates with the increase of ammonia content. Ammonia toxicity can be avoided if the reactor pH is maintained within the optimum working range of 6.8 to 7.2 and the ammonia nitrogen concentration in the range of 1500 to 3000 mg/L [9].
(lag phase), followed by a phase of COD degradation from day 16 to day 31 (exponential stage). The COD concentration was decreased further to 31360 mg/L at day 53. A 42% reduction in COD was achieved at this stage. Since day 53, an increase in COD effluent was observed for a week and this was due to the soluble microbial product (SMP) which in turn contributed to the COD value in the effluent. Various articles have proven that formation of SMP in anaerobic system indeed contributed to a certain percentage of COD in the effluent of wastewater treatment system [10-13].
Nevertheless, the presence of inorganic constituents may also contribute to the variation of COD measurements in this period. For instance, Kylefors and his co-workers [14] found that Fe (II), Mn (II), and sulphide contributed up to one-third of the COD in the leachate they tested.
Beyond day 53, COD in fermenter maintained at value of 37500 mg/L until day 67 and then decreased gradually to a value of 30720 mg/L at day 91 which indicated the cellulose and hemicellulose hydrolysis and also consumption of carboxylic [15]. A total COD reduction of 44% was achieved from this anaerobic treatment.
Table 3 shows the efficiency of treatment in terms of percentage removal of COD, BOD and TS during batch anaerobic treatment process. Table 3 shows that COD reductions achieved at day 53 and 91 were 43% and 44%, respectively. It was found that leachate had low biodegradability as reflected in low value of BOD/COD ratio, 0.19 and 0.14 for day 53 and 91, respectively. A BOD removal of 80 and 85% was
Table 3. Percentage Removal of COD, BOD and TS during Day 53 and 91.
Parameters Day 53 (Intermediate) Day 91(Final)
COD (removal) 43 % 44 %
BOD (removal) 80 % 85 %
BOD/COD 0.19 0.14
TS (removal) 49 % 56 %
10000 20000 30000 40000 50000 60000
0 10 20 30 40 50 60 70 80 90 100
CO
D
Co
n
c
e
n
tr
a
tio
n
(
m
g
/L
)
Duration of Treatment (Day)
obtained for day 53 and 91, respectively. As a result it is better to stop the experiment at day 53 because there was no significant difference in terms of BOD and COD reductions observed after day 53 and 91.
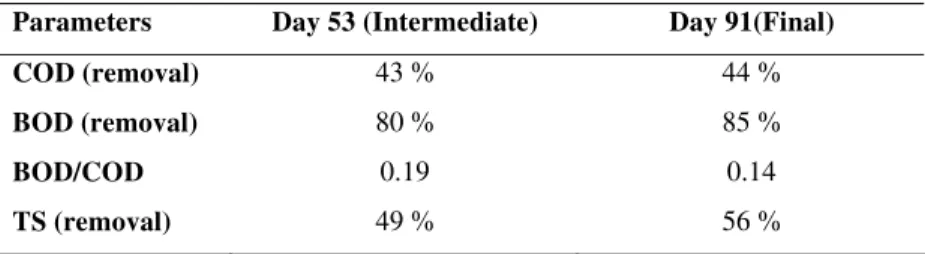
This study reveals the growth pattern in bacteria inside the bioreactor. Bacterial growth in a batch reactor is characterized by identifiable phases as can be seen in Fig. 2. This figure shows what occurred in a batch reactor in which, at the initial stage, substrate and nutrients are present in excess and only a very small amount of biomass exist. As substrate is consumed, four distinct growth phases was established [16].
I. The lag phase: Upon addition of the microorganisms, the lag phase
represents the time required for the organism to acclimate to the new environment before significant cell division and biomass generation occur. During the lag phase enzyme induction may be occurring and/or the cell may be acclimating to changes in salinity, pH, or temperature. The apparent extent of the lag phase may also be affected by the ability to measure the low biomass concentration during the initial batch phase. TSS and VSS decreased from their initial value of 4700 and 3925 mg/L from day 1 to 2812 and 2712 mg/L for TSS and VSS, respectively. Lag phase for this experiment took around 12 days.
II. The exponential-growth phase: During the exponential-growth phase,
bacterial cells are multiplying at their maximum rate, as there is no limitation due to substrate or nutrients. The biomass growth curve increases exponentially during this period. With unlimited substrate and nutrients the only factor that affects the rate of exponential-growth rate is temperature. In this stage both TSS and VSS started to rise up exponentially and reached to their maximum level of 6812 and 6275 mg/L, respectively at day 31.
III. The stationary phase: During this phase, the biomass concentration
remains relatively constant with time. In this phase, bacterial growth is no longer exponential and the amount of growth is offset by the death of cells.
1000 2000 3000 4000 8000 6000 7000 8000
0 10 20 30 40 50 60 70 80 90 100
TSS/
V
SS Co
nc
en
tra
ti
o
n (mg
/L)
TSS VSS
Lag Exponential Stationary Death
Duration of Treatment (Day)
Since day 31, biomass had a decrease around 760 mg/L till day 48 which can be assumed the stationary phase for biomass during the experiment.
IV. The death phase: In the death phase, the substrate has been depleted,
therefore no growth is observed, and the change in biomass concentration is often observed as an approximate constant fraction of biomass remaining that is lost each day. Death phase in this experiment appeared from day 48 until day 68. From day 48 to day 68 the TSS and VSS had drastically decreased to 3156 and 2309 mg/L, respectively. Since day 68 the biomass level increased again but remained for less than a week. Subsequently, TSS and VSS dropped to 3300 and 2820 mg/L, respectively at day 91. Increase in biomass was expected due to availability of sufficient nutrients and also the suitable environment (such as increasing in pH and etc.) for biomass to increase but it did not last for long (day 68 to 72).
TS profile during the treatment shows that leachate was being degraded sharply and then tends to decrease slightly until end of the treatment. Fig. 3 shows that TS decreased rapidly from the maximum amount of 39190 mg/L to 21290 mg/L at day 31 (45% reduction) and then decreased very slowly throughout the experiment to 17200 mg/L at day 91.
Rapid decrease in TS is due to the decomposition of organic material by the microorganisms which were at exponential growth phase that led to degradation of the substrate rapidly. After that reduction in degradation of TS was observed due to slow growth and death of bacteria and also including the non-biodegradable part of substrate (BOD/COD). In general a 56 % reduction in TS was achieved in this treatment process.
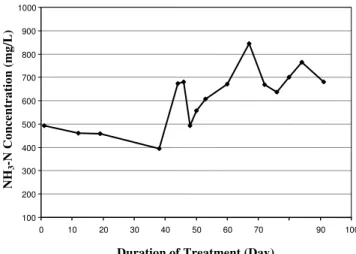
For ammonia nitrogen, the study indicated that there was not much increment in the ammonia nitrogen concentration. Fig. 4 shows that ammonia nitrogen decreased from 492 mg/L at day 1 to 394 mg/L at day 38, it then increased to 680 mg/L at day 46 and decreased again to 492 mg/L at day 48. Maximum concentration of NH3-N, 844 mg/L occurred at day 67, was reduced to 680 mg/L at the end day of treatment. Fluctuation in ammonia nitrogen is related to protein degradation during the treatment. Growth of bacteria can help to degrade and break down the complex
10000 20000 30000 40000 50000
0 10 20 30 40 50 60 70 80 90 100
Duration of Treatment (Day)
TS C
o
nce
n
trati
o
n (m
g/
L)
protein to amino acids. Then, these acids will be converted into ammonia and organic acid and finally producing acetate in the system. It is noted that ammonia level was not found to cause the inhibition during the treatment process.
4.Conclusions
The study shows that fresh leachate from transfer station having pollutants with high levels of BOD, COD, NH3-N and heavy metals took longer time to be degraded. The result of this study also shows that anaerobic biological treatment alone cannot efficiently remove the COD content of leachate from transfer station. Therefore pre-treatment methods like diluting the leachate, adding suitable inoculums from wastewater or palm oil sludge are proposed. Based on the results of this study, the following conclusions are made:
I.The values found for both COD and BOD5 of fresh leachate were extremely high as compare to landfill leachate and COD reduction rate for the batch process was found to be at 43 and 44% for day 53 and 91, respectively, which indicated the same result.
II. BOD5 reduction was drastically reduced at both points (day 53 and 91) with 80 to 85 % reduction for day 53 to 91, respectively.
III. BOD/COD ratio was found at range of 0.19–0.14 in batch system for days 53 and 91, respectively which showed the low biodegradability of treated leachate.
References
1. Andreottola, G. and Cannas, P. (1992). Chemical and biological characteristics
of landfill leachate. In: Christensen, T.H., Cossu, R., Stegmann, R. (Eds.),
Landfilling of Waste: Leachate. Elsevier Applied Science Publishers Ltd., 65-88. 2. Chu, L.M., Cheung, K.C. and Wong, M.H. (1994).Variations in the chemical
properties of landfill leachate. Journal of Environmental Management, 18, 105–117.
Duration of Treatment (Day) 100
200 300 400 500 600 700 800 900 1000
0 10 20 30 40 50 60 70 90 100
NH
3
-N
Concent
r
ation (mg/L)
3. Pouliot, J.M. (1999). Biological treatment of landfill leachate. Master of Science Thesis, University of Western Ontario, London, Ontario, Canada. 4. Diamadopoulos, E. (1994). Characterization and treatment of recirculation
stabilized leachate. Wat. Res., 28(12), 2439-2445.
5. Horan, N.J., Gohar, H. and Hill, B. (1997). Application of a granular activated carbon-biological fluidized bed for the treatment of landfill leachates containing high concentrations of ammonia. Journal of Water
Science and Technology, 36:369-375.
6. Henderson, J.P. and Atwater, W. (1995). High ammonia landfill leachate treatment using anaerobic filter and rotating biological contactor. Can. J. Civ. Eng., 22,992-1000.
7. APHA, AWWA, and WPCF (2005). Standard methods for the examination
of water and wastewater (21st edition.), Washington, DC: American Public
Health Association.
8. Fresenius, W., Schneider, W., Böhnke, B. and Pöppinghaus, K. (Eds.). (1989). Waste water technology: Origin, collection, treatment and analysis of
waste water. New York, NY: Springer-Verlag.
9. Gerardi, M. H. (2003). The microbiology of anaerobic digestion. First Ed. New Jersey: John Wiley and Sons Inc.
10. Barker, D.J. and Stuckey, D.C. (1999). A review of soluble microbial products (SMP) in wastewater treatment systems. Journal of Water Research, 33 (14), 3063-3082.
11. Aquino, S.F. and Stuckey, D.C. (2003). Soluble microbial products formation in anaerobic chemostats in the presence of toxic compounds. Journal of
Water Research, 38 (2), 255-266.
12. Goorany, O. and Ozturk, I. (2000). Soluble microbial product formation during biological treatment of fermentation during biological treatment of fermentation industry effluent. Journal of Water Science and Technology, Vol. 42, No. 1-2, 287-292.
13. Lu, S.G., Imai, T. Ukita, M., Sekine, M. and Higuchi, T. (2002). Modelling prediction of membrane bioreactor process with the concept of soluble microbial product. Water Science and Technology, 46 (11-12), 63-70.
14. Kylefors K., Ecke H. and Lagerkvist A. (1999). Relevancy of a discharge limit of COD for landfill leachates. I: Sardinia '99: 7th International Landfill symposium. Cagliari: CISA, Environmental sanitary engineering centre. 1999, 201-205.
15. Kjeldsen, P., Barlaz, M.A., Rooker, A.P., Baun, A., Ledin, A. and Christensen, T.H. (2002). Present and long-term composition of MSW landfill leachate: A Review. Critical reviews in Environmental Science and
Technology, 32(4):297-336.
![Table 1 presents the results of biological treatment of landfill leachate based on COD and BOD removal [3]](https://thumb-eu.123doks.com/thumbv2/123dok_br/18342741.352177/2.918.171.629.105.355/table-presents-results-biological-treatment-landfill-leachate-removal.webp)