DÉBORAH NEIDE DE MAGALHÃES
TOXICIDADE NO COTRATAMENTO DE ESGOTO SANITÁRIO E LIXIVIADO DE ATERRO SANITÁRIO
Dissertação apresentada à Universidade Federal de Viçosa, como parte das exigências do Programa de Pós-Graduação em Engenharia Civil, para a obtenção do título de Magister Scientiae.
VIÇOSA
Ficha catalográfica preparada pela Seção de Catalogação e Classificação da Biblioteca Central da UFV
T
Magalhães, Déborah Neide de, 1983-
M188t Toxicidade no cotratamento de esgoto sanitário e lixiviado 2012 de aterro sanitário / Déborah Neide de Magalhães. –
Viçosa, MG, 2012.
viii, 31f. : il. (algumas col.) ; 29cm.
Inclui anexos.
Texto em inglês e português. Orientador: Ann Honor Mounteer.
Dissertação (mestrado) - Universidade Federal de Viçosa. Referências bibliográficas: f.17-19.
1. Águas residuais – Purificação – Tratamento biológico. 2. Águas residuais – Purificação – Processo de lodo ativado. 3. Daphnia similis. 4. Testes de toxicidade. I. Universidade Federal de Viçosa. II. Título.
DÉBORAH NEIDE DE MAGALHÃES
TOXICIDADE NO COTRATAMENTO DE ESGOTO SANITÁRIO E LIXIVIADO DE ATERRO SANITÁRIO
Dissertação apresentada à Universidade Federal de Viçosa, como parte das exigências do Programa de Pós-Graduação em Engenharia Civil, para a obtenção do título de Magister Scientiae.
APROVADA: 15 de fevereiro de 2012.
_______________________________ Mônica de Abreu Azevedo
(Coorientadora)
_______________________________ Jurandyr Povinelli
_______________________________ Ann Honor Mounteer
ii AGRADECIMENTOS
Primeiramente a Deus, por tudo!
À minha mãe Gessy, minha guerreira, e ao Frederico, meu amor e futuro esposo, pelo apoio incondicional e compreensão nos momentos de distância.
À Universidade Federal de Viçosa, ao Departamento de Engenharia Civil e à Divisão de Água e Esgoto pela estrutura e oportunidade, o que permitiu o desenvolvimento desta pesquisa.
À Professora Ann H. Mounteer pela orientação, apoio e amizade.
Aos estagiários Vanessa Arantes Lizardo e Adonai Guimarães Pinto pela amizade e imprescindível ajuda na labuta diária.
À Companhia de Saneamento Municipal de Juiz de Fora – CESAMA, pela colaboração na concessão das amostras e permissão da realização deste estudo.
Às agências CAPES e Fapemig, pelo apoio financeiro na concessão de bolsas.
Aos membros da banca de dissertação, professores Mônica Azevedo e Jurandyr Povinelli, pelas indispensáveis contribuições para esta versão final.
E, enfim, a todos que de alguma forma colaboraram direta ou indiretamente para a realização deste trabalho de pesquisa.
iii BIOGRAFIA
DÉBORAH NEIDE DE MAGALHÃES, filha de Gessy Maria Neide de Magalhães e Albino Teixeira Magalhães (in memoriam), nasceu e cresceu em Dores de Campos, Minas Gerais, aos 12 de maio de 1983.
Estudou toda a educação básica na sua cidade, frequentando a educação infantil no Jardim de Infância Branca de Neve, e, do pré-escolar até à 4ª série, a Escola Municipal Randolfo Teixeira. O ensino fundamental foi integralmente realizado na Escola Estadual Duque de Caxias e o ensino médio na Escola Municipal João Cupertino da Silva.
De 2002 a 2006 cursou Licenciatura em Ciências Biológicas na Universidade Federal de São João del-Rei. No ano de sua formatura, matriculou-se no curso de pós-graduação lato sensu em Análise Ambiental, na Universidade Federal de Juiz de Fora, o qual concluiu em 2008 com a defesa do TCC que dissertava sobre a gestão dos resíduos sólidos urbanos no município de Dores de Campos. Concomitante a estes estudos (2005 a 2009), retornou à Escola Estadual Duque de Caxias, porém como professora de biologia nos ensinos fundamental, médio e educação de jovens e adultos.
iv SUMÁRIO
LISTA DE FIGURAS ... v
LISTA DE TABELAS ... v
RESUMO ... vi
ABSTRACT ... viii
INTRODUÇÃO GERAL ... 1
TOXICITY IN CO-TRETATMENT OF SANITARY SEWAGE AND LANDFILL LEACHATE ... 4
1 Introduction ... 4
2 Material and methods... 5
2.1 Sampling site ... 5
2.2 Samples ... 6
2.3 Physicochemical characterization ... 6
2.4 Acute toxicity ... 7
2.5 Oxygen uptake rate ... 7
2.6 Sludge growth ... 8
2.7 Statistical analyses ... 8
3 Results and discussion ... 9
3.1 Sample characterization ... 9
3.2 Sample toxicity ... 12
3.3 SOUR ... 14
3.4 Biomass Growth ... 15
4 Conclusions ... 16
REFERÊNCIAS BIBLIOGRÁFICAS ... 17
ANEXOS ... 20
ANEXO A – RESULTADOS DAS ANÁLISES FÍSICO-QUÍMICAS ... 21
ANEXO B – RESULTADOS DOS BIOENSAIOS DE TOXICIDADE AGUDA 25 ANEXO C – RESULTADOS DOS ENSAIOS DE TOMADA DA TAXA DE CONSUMO DE OXIGÊNIO ... 29
v LISTA DE FIGURAS
Figure 1. Boxplot representation of impact of leachate addition on organic (COD, BOD), solids (TSS, TDS) and Kjeldahl nitrogen (TKN) loads at the entrance of the STP (lines = median, bars = 25%-75% range, error bars = minimum and maximum values). ... 11
Figure 2. Comparison between leachate and leachate-sewage mixture acute toxicities to D. similis (error bars represent 95% confidence intervals around EC50 values). ... 13
Figure 3. Variation in VSS production and COD removal in sequencing batch reactors treating sewage or a 20% leachate-sewage mixture. ... 15
LISTA DE TABELAS
Table 1. Parameters and analytical methods used in sewage and leachate characterization ... 7 Table 2. Characteristics and variability of raw domestic sewage, landfill leachate and treated wastewater, together with state discharge limits ... 9 Table 3. Values of significantcorrelations (r, p < 0.05) between leachate toxicity and physicochemical variables ... 12 Table 4. Specific oxygen uptake rate (SOUR) in raw sewage (S) and leachate-sewage mixtures (L%S) ... 14
vi RESUMO
MAGALHÃES, Déborah Neide de, M.Sc., Universidade Federal de Viçosa, fevereiro de 2012. Toxicidade no cotratamento de esgoto sanitário e lixiviado de aterro sanitário. Orientadora: Ann Honor Mounteer. Coorientadoras: Mônica de Abreu Azevedo e Ana Augusta Passos Rezende.
viii ABSTRACT
MAGALHÃES, Déborah Neide de, M.Sc., Universidade Federal de Viçosa, February, 2012. Toxicity in co-treatment of sanitary sewage and landfill leachate. Adviser: Ann Honor Mounteer. Co-Advisers: Mônica de Abreu Azevedo and Ana Augusta Passos Rezende.
1 INTRODUÇÃO GERAL
A disposição final de resíduos sólidos urbanos (RSU) em aterros sanitários no Brasil tem crescido nos últimos anos e tende a aumentar mais rapidamente devido ao aumento de consumo em consequência da economia emergente e das pressões governamentais quanto à exigência da adequação do gerenciamento de RSU. Umas das vantagens deste tipo de destinação é a possibilidade de coleta e tratamento do lixiviado, evitando-se assim a contaminação do solo e de águas superficiais e subterrâneas.
O lixiviado de aterro sanitário é resultante das águas que percolam e solubilizam as diversas substâncias químicas da massa de resíduos num aterro sanitário, provindas da infiltração pluvial, da umidade intrínseca dos resíduos, e produzida nos processos bioquímicos de degradação da matéria orgânica (GOMES, 2009). Dessa forma, o lixiviado caracteriza-se geralmente por apresentar matéria orgânica dissolvida ou solubilizada e em suspensão, produtos intermediários da digestão anaeróbia dos resíduos, como ácidos orgânicos voláteis, e substâncias químicas, como metais pesados e organoclorados originados do descarte de agrotóxicos e inseticidas (CASTILHOS JUNIOR, 2006).
A composição do lixiviado apresenta grande variabilidade, pois depende dos constituintes dos resíduos e da idade do aterro, que pode refletir o grau de estabilização em que se encontram os resíduos. Segundo Mc Bean, et al. (2005), o lixiviado novo contém maior teor de matéria orgânica biodegradável e tende a ser ácido (pH entre 5 e 7) devido à presença de ácidos graxos voláteis. Neste estágio predominam as formas nitrogenadas em estado de oxidação mais reduzido, como nitrogênio orgânico e amoniacal. Em lixiviados mais antigos, a carga orgânica diminui, permanecendo a porção recalcitrante, o pH varia em torno da neutralidade, de 7 a 8, e há maiores concentrações de formas oxidadas de nitrogênio.
2 do lixiviado. Os processos biológicos são mais efetivos para o tratamento do lixiviado jovem, que contém maiores concentrações de ácidos voláteis. Os lixiviados estabilizados, por possuírem em sua constituição concentrações consideráveis de compostos refratários, em especial as substâncias húmicas, nitrogênio amoniacal e baixa concentração de fósforo, dificultam o tratamento biológico e requerem a combinação de processos físicos e químicos de tratamento (TATSI et al., 2003).
Uma prática que vem sendo largamente adotada na Europa, Estados Unidos, Japão e em outros países, incluindo o Brasil, é o tratamento combinado de lixiviado de aterro e esgoto sanitário em estações de tratamento de esgotos (ETE), conferindo uma alternativa vantajosa devido à viabilidade econômica e facilidade técnico-operacional. Nesta técnica, a potencialidade de tratamento do lixiviado é aumentada em decorrência da sua diluição no esgoto. Porém, um dos questionamentos a cerca dessa prática é a respeito das possíveis interferências do lixiviado nos processos de tratamento, especialmente os biológicos (GOMES, 2009).
Neste sentido, várias pesquisas vêm sendo desenvolvidas buscando a definição de critérios que viabilizem o cotratamento desses dois efluentes, principalmente relacionadas à proporção de diluição e tratabilidade pelas diversas tecnologias disponíveis. Del Borghi et al. (2003), assim como outros autores (DIAMADOPAULOS et al., 1997), demonstraram que uma mistura de 10% de lixiviado no esgoto, apresentou eficiência de remoção de DQO e N-NH3 acima de 70%, quando tratada aerobiamente e usando-se lodo aclimatado por 4h. Mannarino et al. (2010), em concordância com McBean et al. (1995), concluíram que o influxo de até 2% de lixiviado misturado ao esgoto afluente na ETE Icaraí, Rio de Janeiro, não interferiu no processo de tratamento quimicamente assistido. Neste trabalho também foi avaliada a toxicidade dos afluentes, constatando-se que a toxicidade do lixiviado não conferia toxicidade à mistura afluente na ETE e ao efluente final.
3 regulamentado pela Deliberação Normativa conjunta COPAM/CERH-MG nº. 01/2008.
Embora existam muitos trabalhos que investigam o processo de cotratamento de esgoto e lixiviado, estes têm focado no estudo de frações de diluição, tratabilidade por processos físicos e químicos e sua integração com processos biológicos. Porém, o estudo do possível efeito tóxico da adição de lixiviado ao esgoto durante o tratamento biológico é um aspecto que precisa ser investigado, uma vez que poucos trabalhos a respeito são encontrados na literatura.
4 TOXICITY IN CO-TRETATMENT OF SANITARY SEWAGE AND LANDFILL LEACHATE
1 Introduction
Final disposition of municipal solid wastes (MSW) in sanitary landfills has grown steadily in Brazil, with an increase from 17 to 28% of cities adopting this form of disposal between 2000 and 2008 (IBGE, 2000, 2008). According to the Brazilian Association of Public Sanitation Companies (ABRELPE), 57% of the 173,000 tons of MSW collected daily in 2010 were disposed of in sanitary landfills. Startup of new sanitary landfills is expected to continue increasing, at least in the short term, as a consequence of the emerging Brazilian economy that has lead to increased consumption and generation of solid wastes as well as recent federal policies that requires all cities to adopt adequate MSW management measures. Between 2009 and 2010, MSW generation increased 6.8% while the Brazilian population increased by only 1% in the same period (ABRELPE, 2010).
An important aspect of landfill operation is the adequate collection and treatment of leachate in order to eliminate the potential risk of soil, surface water and groundwater contamination. Leachate treatment represents a technical challenge since leachate is a complex mixture whose composition depends on a variety of factors, including the nature of the solid wastes, the age and operational management of the landfill and season of the year (ABBAS et al., 2009).
The few leachate biological treatment systems implanted in Brazil have presented mediocre performance, because of the variability in composition, seasonal flowrate variations and the fact that many were projected based on criteria defined for sanitary sewage that presents physicochemical characteristics quite different from those of leachates (CASTILHOS JUNIOR, 2006).
5 BORGHI et al., 2003). Combined treatment of landfill leachate with sanitary sewage in municipal sewage treatment plants (STP) has been adopted in many countries, including Brazil, since it allows for leachate dilution and avoids the technical and operational difficulties posed by the large seasonal variations in leachate flowrate and composition (DIAMADOUPOULUS et al., 1997; GOMES et al., 2009). Although improved degradation of the high organic load in leachates can be achieved by dilution with sanitary sewage and by adaptation of biological sludge (DEL BORGHI et al., 2003), the impacts on STP operation arising from mixing these two types of effluents needs to better evaluated (GOMES et al., 2009).
Results of combining complex mixtures such as leachate and wastewater cannot be anticipated, since interactive effects between toxic substances are often observed that can increase or decrease toxicity. Many toxic substances in these types of wastewater may be present at levels at or below analytical detection limits making their identification technically or economically unfeasible (MATEJCZYK et al., 2011). Therefore, toxicity testing of leachate, sewage and their mixture, allied with appropriate chemical analyses can provide a more direct measure of possible toxic effects and their associated causes.
The objective of the present study was to evaluate the toxicity of landfill leachate and its effect on treatment of domestic sewage in an activated sludge treatment plant, and to identify possible correlations between toxicity and leachate chemical components, such as organic matter, nitrogen compounds and trace metals. Possible toxic effects were evaluated by means of acute toxicity assays and activated sludge respirometry and biomass growth tests.
2 Material and methods 2.1 Sampling site
6 disposed of in the municipal sanitary landfill. The leachate generated at the Salvaterra landfill is collected and transported for treatment at the Barbosa Lage STP, The landfill occupies an area that was operated as the Juiz de Fora city dump from 1999 to 2005, when it was converted to a landfill and operated until reaching its holding capacity in April of 2010. An average of 45 m3/day of leachate is transported from Salvaterra to the STP in 15 m3 capacity trucks, generally two in the morning (8 and 11 am) and one in the afternoon (4 pm). The leachate is discharged directly at the inlet before the screens.
2.2 Samples
Samples were collected monthly from January through June of 2011, a period that covered parts of both the dry (April through October) and rainy (November through March) seasons in the region. The samples included raw sewage and landfill leachate, collected before their mixture, the leachate-sewage mixture, before equalization and treated wastewater collected at the STP outlet to the Paraibuna River. The samples were chilled and transported to the Water Quality Control Laboratory at the Federal University of Viçosa, within 3 hours of collection. One part of each sample was acidified to pH 2 with nitric acid and stored refrigerated for metals analyses and another part was filtered qualitatively and stored frozen for toxicity bioassays. Return activated sludge (RAS) was also collected from the recycle line in some months. The sludge was kept under constant aeration and at constant temperature in the laboratory and held for no more than one week before use.
2.3 Physicochemical characterization
7
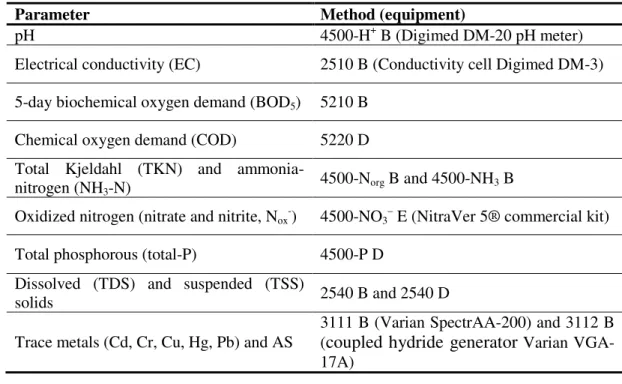
Table 1. Parameters and analytical methods used in sewage and leachate characterization
Parameter Method (equipment)
pH 4500-H+ B (Digimed DM-20 pH meter)
Electrical conductivity (EC) 2510 B (Conductivity cell Digimed DM-3)
5-day biochemical oxygen demand (BOD5) 5210 B
Chemical oxygen demand (COD) 5220 D
Total Kjeldahl (TKN) and
ammonia-nitrogen (NH3-N) 4500-Norg B and 4500-NH3 B
Oxidized nitrogen (nitrate and nitrite, Nox-) 4500-NO3– E (NitraVer 5® commercial kit)
Total phosphorous (total-P) 4500-P D
Dissolved (TDS) and suspended (TSS)
solids 2540 B and 2540 D
Trace metals (Cd, Cr, Cu, Hg, Pb) and AS
3111 B (Varian SpectrAA-200) and 3112 B (coupled hydride generator Varian VGA-17A)
2.4 Acute toxicity
Acute toxicity bioassays were performed using a static, 48 hour test with the water flea Daphnia similis, according to the Brazilian standard (NBR 12.713, ABNT, 2009). In each assay, five sample dilutions were prepared in four replicates. Each replicate contained five 6 to 24 hour-old test organisms. Mixtures containing different proportions of leachate and sewage were also prepared in order to determine the proportion of leachate that resulted in acute toxicity. Two types of negative controls were included, one containing only dilution water and the other only raw sewage. The test solutions were kept for 48 hours at 22°C under a 12 h light/dark cycle, after which the number of immobile organisms were counted. The endpoint calculated was the EC50, the percent of wastewater, leachate or their mixture that resulted in immobility of 50% of the test organisms.
2.5 Oxygen uptake rate
8 added to the mixtures and dissolved oxygen concentrations measured in 15 second intervals for 15 minutes using an oxygen meter (Digmed, model DM-4). The oxygen uptake rate (OUR mg O2/L.h) was calculated as the inclination of the curve of oxygen concentration versus time. The SOUR (mgO2/h.gVSS) was obtained by dividing the OUR by the concentration of VSS in the test mixture.
2.6 Sludge growth
The effect of leachate on activated sludge growth was evaluated using samples collected in May, 2011. Bench-scale sequencing batch reactors with one liter working volumes were filled with filtered raw sewage or filtered leachate-sewage mixture (20/80 v/v) in duplicate. The reactors were inoculated with RAS at an initial concentration of 100 mg VSS/L and kept at constant temperature (20°C ± 2) under aeration by porous stones attached to an air pump. The reactors were operated on a 24 hour cycle for 13 days. Each cycle consisted of 23 hours aeration and one hour sludge settling, followed by withdrawal of 700 mL clarified wastewater, and replenishment with 700 mL aliquots of filtered sewage or the leachate-sewage mixture for the start of a new cycle. COD was measured in the clarified wastewater and TSS and VSS determined in the settled sludge at the end of each cycle.
2.7 Statistical analyses
Results of physicochemical characterizations were analyzed using Statistica 8.0 (Statsoft, Tulsa, OK). Normality was checked using the Kolmogorov-Smirnov & Lilliefors test. Student´s t-test was used for comparison of means. Pearson´s correlation coefficient (r) was calculated to evaluate relationships between biological tests and physicochemical components of the wastewater samples. All statistical analyses were run at a 5% level of significance.
9 3 Results and discussion
3.1 Sample characterization
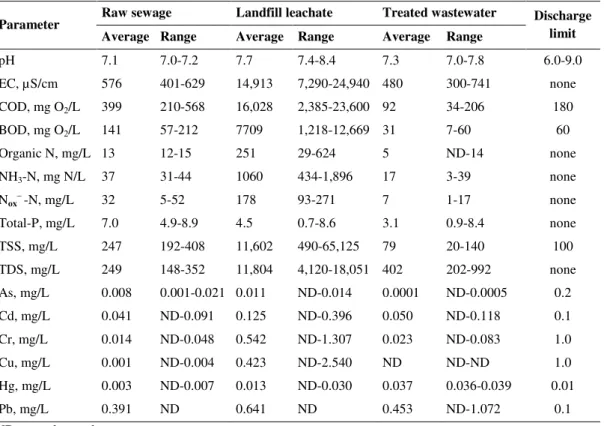
Characterization of the santitary sewage and landfill leachate entering the STP and treated wastewater are presented in Table 2. Leachate samples presented much higher average values and broader ranges in values than raw sewage, except for phosphorous. The largest differences between sewage and leachate were found for organic matter (BOD and COD), solids, nitrogen and conductivity. Leachate conductivity was on average two orders of magnitude (104 µS/cm) higher than sewage conductivity (102 µS/cm). This is a common characteristic of landfill leachates inherent to the chemical hydrolysis and partial biological degradation and hence solubilization of solid wastes that leads to its formation.
Table 2. Characteristics and variability of raw domestic sewage, landfill leachate and treated wastewater, together with state discharge limits
Parameter Raw sewage Landfill leachate Treated wastewater Discharge limit
Average Range Average Range Average Range
pH 7.1 7.0-7.2 7.7 7.4-8.4 7.3 7.0-7.8 6.0-9.0
EC, µS/cm 576 401-629 14,913 7,290-24,940 480 300-741 none
COD, mg O2/L 399 210-568 16,028 2,385-23,600 92 34-206 180
BOD, mg O2/L 141 57-212 7709 1,218-12,669 31 7-60 60
Organic N, mg/L 13 12-15 251 29-624 5 ND-14 none
NH3-N, mg N/L 37 31-44 1060 434-1,896 17 3-39 none
Nox– -N, mg/L 32 5-52 178 93-271 7 1-17 none
Total-P, mg/L 7.0 4.9-8.9 4.5 0.7-8.6 3.1 0.9-8.4 none
TSS, mg/L 247 192-408 11,602 490-65,125 79 20-140 100
TDS, mg/L 249 148-352 11,804 4,120-18,051 402 202-992 none
As, mg/L 0.008 0.001-0.021 0.011 ND-0.014 0.0001 ND-0.0005 0.2
Cd, mg/L 0.041 ND-0.091 0.125 ND-0.396 0.050 ND-0.118 0.1
Cr, mg/L 0.014 ND-0.048 0.542 ND-1.307 0.023 ND-0.083 1.0
Cu, mg/L 0.001 ND-0.004 0.423 ND-2.540 ND ND-ND 1.0
Hg, mg/L 0.003 ND-0.007 0.013 ND-0.030 0.037 0.036-0.039 0.01
Pb, mg/L 0.391 ND 0.641 ND 0.453 ND-1.072 0.1
ND = not detected.
10 system, with regard to sludge recycling and wasting. Potentially toxic metals were also present in higher concentrations in leachate, except for As and Pb, which had similar concentrations in sewage.
Biodegradability, measured as the BOD/COD ratio, averaged 0.48 in leachate, but only 0.34 in sewage, suggesting that the high organic load in leachate was not as recalcitrant to biological treatment as has been reported in other studies (YU et al., 2010; MANNARINO et al., 2010). The considerable leachate biodegradability indicates it is a relatively “young leachate”. Słomczy ska and Słomczy ski (2004) reported that leachates less than five years old exhibit BOD/COD ratios from 0.22 to 0.7, whereas older leachates exhibit much lower biodegradabilities (YU et al., 2010).
Nitrogen, in all its forms (organic, ammonium and oxidized) was several fold higher in leachate than in sewage. Toxicity of leachates has been attributed to high ammonium levels (DIAMADOPOULOS et al., 1997) and removal of nitrogen is considered an important objective of leachate treatment (MANNARINO et al., 2010).
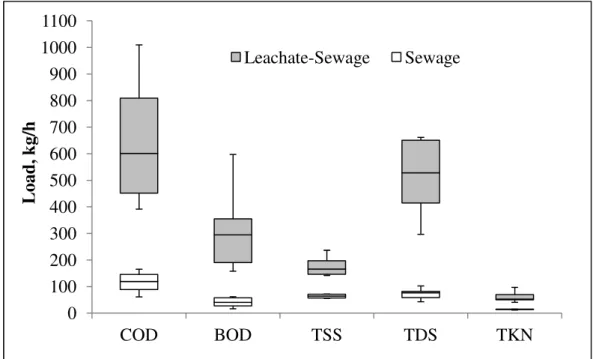
11
Figure 1. Boxplot representation of impact of leachate addition on organic (COD, BOD), solids (TSS, TDS) and Kjeldahl nitrogen (TKN) loads at the entrance of the STP (lines = median, bars = 25%-75% range, error bars = minimum and maximum values).
The activated sludge system was generally able to absorb and treat the leachate-sewage mixture to the level required by Minas Gerais state regulations (COPAM/CERH, 2008) (Table 2). Organic matter removalwas sufficient, with only one treated wastewater sample exceeding the COD discharge limit of 180 mg/L. However, in the case of municipal sewage treatment plants, state legislation permits discharge above this level, if average COD removal is over 55%, which is clearly the case at this plant. TSS exceeded the discharge limit of 100 mg/L twice, with values of 126 mg/L in February and 140 mg /L in June, which was likely due to solids loss in the secondary clarifier caused by poor floc formation in the aeration tank, possibly as a result of high influent conductivity.
High leachate conductivity can interfere in COD analyses, especially when associated with high chloride concentrations (above 2000 mg C –/L). Chloride analyses of leachate samples showed that only one sample presented C – above the recommended limit, reaching 2880 mg C –/L. However, because of the high concentrations of organic matter, samples were diluted several fold for COD determination, resulting in chloride levels that were eliminated by the standard procedure (addition of HgSO4).
0 100 200 300 400 500 600 700 800 900 1000 1100
COD BOD TSS TDS TKN
L
oad
, k
g/
h
12 Hg was the only parameter that was consistently detected at levels above the discharge limit at the STP outlet. Pb and Cd were also detected above the legal limit in some treated wastewater samples. Both sewage and leachate contributed to the high Hg and Pb concentrations, whereas leachate was responsible for input of most of the Cd.
3.2 Sample toxicity
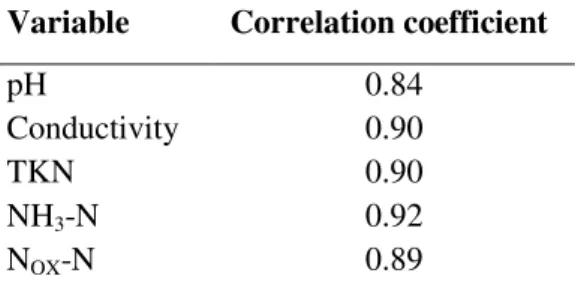
One of the challenges to combined leachate-sewage treatment is leachate toxicity that may hinder biological treatment and lead to discharge of toxic effluents. Raw sewage did not present acute toxicity to D. similis, whereas all leachate samples were toxic, with EC50 ranging from 4 to 18%. Significant (p < 0.05) positive correlations were found between leachate acute toxicity and pH, conductivity, TKN, ammonium and oxidized nitrogen (Table 3) which is similar to results reported by various authors (ISIDORE et al., 2003, SILVA et al., 2004, KALKA et al., 2010). Cotman and Gotvajn (2010) observed that ammonia stripping of leachates reduced their toxicity to activated sludge microorganisms. The significant correlation with pH may also be related to the presence of ammonia whose toxic unionized form is present at higher pH (pKa = 9.3).
Table 3. Values of significant correlations (r, p < 0.05) between leachate toxicity and physicochemical variables
Variable Correlation coefficient
pH 0.84
Conductivity 0.90
TKN 0.90
NH3-N 0.92
NOX-N 0.89
13 Leachate-sewage mixtures collected at the STP presented a relatively broad range of EC50 values (38% to >100%, in the samples of January and May), reflecting the large variability in leachate composition. Treated wastewater was only slightly toxic in March (EC50 = 92%). This toxicity correlated directly with the presence of As (r = 1.0). However, the presence of arsenic did not correlate with toxicity of the other sample types.
Leachate-sewage mixtures prepared in the laboratory consistently presented greater acute toxicity (lower EC50 values) than the leachate itself (Figure 2), indicating a potentiation effect between leachate and sewage, since raw sewage never showed toxicity and leachate toxicity increased (lower EC50 values) when added to sewage. Kalka et al. (2010) observed the same trend in acute toxicity bioassays with Daphnia magna, Vibrio fischeri and Thamnocephalus platyurus. However, Mannarino et al. (2010) reported no increase in toxicity of domestic sewage or leachate to D. similis or the fish Danio rerio after mixing.
Figure 2. Comparison between leachate and leachate-sewage mixture acute toxicities to D. similis (error bars represent 95% confidence intervals around EC50 values).
Leachate can represent up to almost 5% of the STP inlet flow (292 m3/h sewage and 15 m3/h leachate) at the time of addition, and even after the two hour equalization tank, still corresponds to 2.5% of the inlet flow to the activated sludge aeration tank, which is above the EC50 values of the leachate-sewage mixtures prepared in the laboratory in May and June. Some authors have suggested that the final leachate
0 5 10 15 20
Jan Feb Mar Apr May Jun
E
C50
, %
L
eac
hat
e
Leachate
14 concentration in co-treatment should not exceed from 2% (McBEAN, et al., 1995; MANNARINO et al., 2010). On the other hand, Çeçen and Çakıro lu (2001) stated that the proportion of leachate should not exceed 20% of the flowrate, or 50% of the initial COD in an activated sludge system. The potentiation effect observed between leachate and sewage could compromise microbial metabolism and thus biological treatment itself. The intermittent addition of leachate to the STP also might not permit adequate adaptation of microorganisms in the biological reactor.
3.3 SOUR
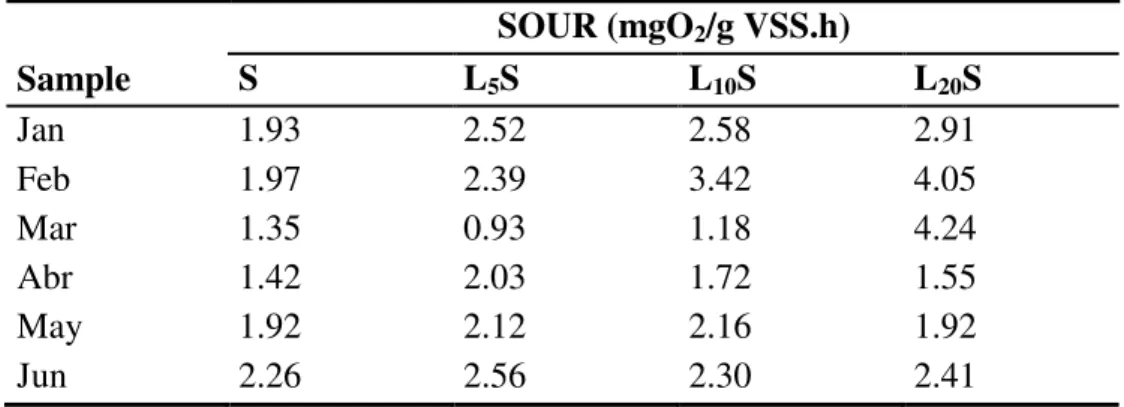
In order to evaluate possible toxic effects of leachate on activated sludge microorganisms, sludge oxygen uptake was measured in the presence of sewage and leachate-sewage mixtures (Table 4). Although no significant differences were found in respiration rates, SOUR tended to increase with the increase in the proportion of leachate in the mixture. The higher organic content in the sewage-leachate mixtures apparently lead to greater microbial activity, which as previously mentioned, could exhaust the oxygen supply in aerobic treatment.
Table 4. Specific oxygen uptake rate (SOUR) in raw sewage (S) and leachate-sewage mixtures (L%S)
Sample
SOUR (mgO2/g VSS.h)
S L5S L10S L20S
Jan 1.93 2.52 2.58 2.91
Feb 1.97 2.39 3.42 4.05
Mar 1.35 0.93 1.18 4.24
Abr 1.42 2.03 1.72 1.55
May 1.92 2.12 2.16 1.92
Jun 2.26 2.56 2.30 2.41
15
Table 5. Significant correlations (r, p < 0.05) between 20% leachate-sewage mixture (L20S)
SOUR values and sewage and leachate physicochemical variables.
Variable
SOUR L20S
Sewage Leachate
As -0.91 ns
Cd -0.82 -0.85
Hg ns 0.90
Pb -0.84 -0.85
*ns = no significant correlation.
3.4 Biomass Growth
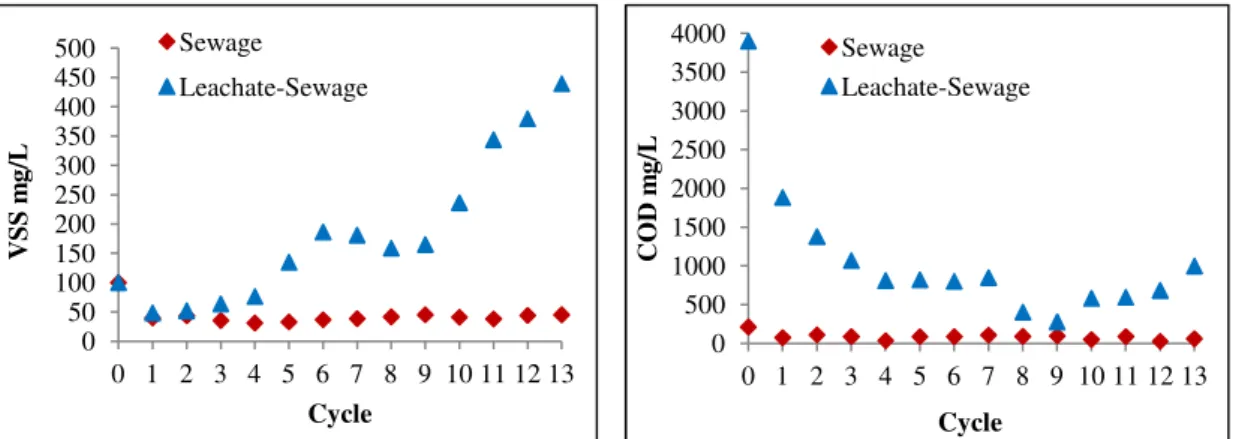
To evaluate the possible impact of leachate on sludge biomass growth, sequencing batch reactors fed with sewage and leachate-sewage mixtures were inoculated with activated sludge. VSS production and soluble COD were monitored after each of 13 cycles (Figure 3). Very little solids production was observed in the reactors treating only sewage, whereas in the reactors treating the 20% leachate-sewage mixture, solids reached approximately 500 mg VSS/L after 13 cycles.
Figure 3. Variation in VSS production and COD removal in sequencing batch reactors treating sewage or a 20% leachate-sewage mixture.
Soluble COD after each treatment cycle remained fairly constant in the reactors fed sewage, while it decreased rapidly within the first 4 cycles in the reactors fed the leachate-sewage mixture. COD removal efficiency averaged 65% for sewage and over 96% for the leachate-sewage mixture. The pause in increased COD removal observed from cycles 5 to 7 in the mixture was reflected in the slightly delayed pause in increased VSS production, observed from cycles 6 to 9, that may reflect adaptation of the activated sludge biomass to the mixture. Initial COD in sewage was only 210
0 50 100 150 200 250 300 350 400 450 500
0 1 2 3 4 5 6 7 8 9 10 11 12 13
V SS m g/ L Cycle Sewage Leachate-Sewage 0 500 1000 1500 2000 2500 3000 3500 4000
0 1 2 3 4 5 6 7 8 9 10 11 12 13
16 mg/L while in the 20% leachate-sewage mixture it was 3900 mg/L. Clearly, the higher organic and nitrogen contents of the leachate-sewage mixture afforded greater biomass growth than the sewage. These results suggest that activated sludge is able to adapt to the higher more concentrated wastewater over time, however, the effect of impulse loads such as those occurring in the STP still need to be evaluated.
4 Conclusions
This study evaluated the toxicity of sanitary landfill leachate and its effect on combined treatment with domestic wastewater in the activated sludge process. Leachate contained significantly higher levels of all physicochemical variables evaluated than sewage, except phosphorous. Addition of leachate to sewage increased organic (BOD and COD), nitrogen (Kjeldahl and oxidized forms) and solids loads, but these were consistently reduced during activated sludge biological treatment. Treated wastewater presented Pb and Hg concentrations above state discharge limits.
All leachate samples were acutely toxic to D. similis, and conferred toxicity to the wastewater after mixture in the STP, however treated wastewater was only slightly toxic on one sampling date. Leachate toxicity correlated positively with nitrogen compounds, principally, ammonia, as well as with electrical conductivity and pH. Potentiation of the toxic effect of leachate occurred after mixture with sewage in the laboratory.
The sludge oxygen uptake rate tended to increase with the increase in the proportion of leachate in leachate-sewage mixtures. Negative correlation was found between oxygen uptake and Pb, Cd, As and Hg. Addition of leachate to sewage resulted in increased biomass growth rate in laboratory scale reactors.
17 REFERÊNCIAS BIBLIOGRÁFICAS
ABBAS, A. A.; JINGSONG, G.; PING, L. Z; YA, P. Y.; AL-REKABI, W. S., 2009. Review on Landfill Leachate Treatment. Journal of Applied Sciences Research, vol. 5, p. 534-545.
ABNT NBR 12.713, 2009. Aquatic Toxicology – acute toxicity – Assay. Método de ensaio com Daphnia spp (Crustacea, Cladocera). Rio de Janeiro: ABNT, 3 ed. 21p. ABRELPE, Associação Brasileira das Empresas de Limpeza Pública e Resíduos Especiais. 2010. Panorama dos resíduos sólidos no Brasil. São Paulo: Grappa, 202p.
APHA, AWWA, WEF, 2005. Standard Methods for the Examination of Water and Wastewater. 21st ed. Washington DC, USA.
CASTILHOS JUNIOR, A. B. (coordenador) 2006. Gerenciamento de resíduos sólidos urbanos com ênfase na proteção de corpos d’água: prevenção, geração e tratamento de lixiviados de aterros sanitários. Rio de Janeiro: ABES, 494p.
ÇEÇEN, F.; ÇAKIRO LU, D. 2001. Impact of landfill leachate on the co-treatment of domestic wastewater. Biotechnology Letters 23: 821–826
CONSELHO NACIONAL DO MEIO AMBIENTE. 2011. RESOLUÇÃO Nº. 430, DE 13 DE MAIO DE 2011. Dispõe sobre as condições e padrões de lançamento de efluentes, complementa e altera a Resolução no 357, de 17 de março de 2005, do Conselho Nacional do Meio Ambiente – CONAMA. Brasil.
CONSELHO ESTADUAL DE POLÍTICA AMBIENTAL; CONSELHO ESTADUAL DE RECURSOS HÍDRICOS DE MINAS GERAIS. 2008. Deliberação Normativa conjunta COPAM/CERH nº 1 de 05 de maio de 2008. Dispõe sobre a classificação dos corpos de água e diretrizes ambientais para o seu enquadramento, bem como estabelece as condições e padrões de lançamento de efluentes. Belo Horizonte: COPAM.
COTMAN, M.; GOTVAJN, A. Z. 2010. Comparison of different physico-chemical methods for the removal of toxicants from landfill leachate. Journal of Hazardous Materials 178, 298-305.
DEL BORGUI, A., BINAGHI, L., CONVERTI, A., DEL BORGUI, M. 2003. Combined treatment of leachate from sanitary landfill and municipal wastewater by actived sludge. Chem. Biochem. Eng. 17, 277-283.
18 GOMES, L. P. (coordenadora). 2009. Estudos de caracterização e tratabilidade de lixiviados de aterros sanitários para as condições brasileiras. Rio de Janeiro: ABES, 360p.
IBGE, 2002. Pesquisa Nacional de Saneamento Básico 2000 (PNSB 2000). Rio de Janeiro, Brazil.
IBGE, 2010. Pesquisa Nacional de Saneamento Básico 2008 (PNSB 2008). Rio de Janeiro, Brazil.
ISIDORI, M.; LAVORGNA, M.; NARDELLI, A.; PARRELLA, A. 2003. Toxicity identification evaluation of leachates from municipal solid waste landfills: a multispecies approach. Chemosphere, 52, 85–94
KALKA, J.; OSLISLOK, A.; SURMACZ-GORSKA, J.; KRAJEWSKA, K; MARCIOCHA, D.; RASZKA, A. 2010. A laboratory study on toxicity removal from landfill leachate in combined treatment with municipal wastewater. Environmental Engineering III; edited by L. Pawlowski, M R. Dudzinska, A Pawlowski, Taylor and Francis, London, UK, pp. 185-189.
KARA ,F; GURAKAN, G.C.; SANIN, F.D. 2008. Monovalent cations and their influence on activatedsludge floc chemistry, structure, and physical characteristics. Biotechnology Bioengineering. New York.v.100, p.231–239.
MANNARINO, C. F.; FERREIRA, J. A.; MOREIRA, J. C.; BILA, D. M.; MAGALHÃES, D. P. 2010. Assessment of Combined Treatment of Landfill Urban Solid Waste Leachate and Sewage Using Danio rerio and Daphnia similis. Bull. Environ. Contam. Toxicol. 85, 274-278.
MAREK MATEJCZYK, M., PŁAZA, G.A., NAŁ CZ-JAWECKI, G., ULFIG, K., MARKOWSKA-SZCZUPAK, A., 2011. Estimation of the environmental risk posed by landfills using chemical, microbiological and ecotoxicological testing of leachates. Chemosphere 82, 1017-1023.
McBEAN, E.A.; ROVERS, F.A.; FARQUHAR, G.J. 1995. Solid waste landfill engineering and design. New Jersey: Prentice Hall.
RODGHER, S., ESPÍNDOLA, E.L,, LOMBARDI, A.T. 2010. Suitability of Daphnia similis as an alternative organism in ecotoxicological tests: implications for metal toxicity. Ecotoxicology. 19(6), 1027-33.
19 SŁOMCZY SKA, B., SŁOMCZY SKI, T. 2004. Physico-Chemical and Toxicological Characteristics of Leachates from MSW Landfills. Polish Journal of Environmental Studies, Vol. 13(6), 627-637.
TATSI A A, ZOUBOULIS A I, MATIS K A, SAMARA P, 2003. Coagulation-flocculation pre-treatment of sanitary landfill leachates. Chemosphere, 53: 737–744.
20 ANEXOS
DADOS EXPERIMENTAIS DAS ANÁLISES FÍSICO-QUÍMICAS, DOS ENSAIOS ECOTOXICOLÓGICOS, RESPIROMÉTRICOS, DE
21 ANEXO A – RESULTADOS DAS ANÁLISES FÍSICO-QUÍMICAS
Tabela A1. Médias obtidas nos ensaios de caracterização físico-química das amostras de esgoto bruto afluente na ETE Barbosa Lage, Juiz de Fora – MG
Parâmetro Unid.
Amostragens
Janeiro Fevereiro Março Abril Maio Junho
pH - 7,2 7,1 7,0 7,1 7,2 7,1
cond. µS/cm2 401 627 607 562 628 629
DQO mg/L 273 568 528 416 210 400
DBO mg/L 87 167 212 208 57 112
NTK mg/L 43 47 50 50 59 53
N-NH3 mg/L 31 35 35 38 44 39
Nox- N mg/L 17 44 43 52 5 32
P-total mg/L 6 8 9 6 5 8
ST mg/L 476 680 599 423 348 450
SST mg/L 192 408 247 242 200 194
SF mg/L 274 356 323 280 245 262
SV mg/L 202 324 276 143 103 188
Pb mg/L nd nd nd 0,685 0,796 0,867
Cd mg/L nd nd nd 0,063 0,091 0,089
Cu mg/L nd nd nd 0,004 nd nd
Cr mg/L nd nd nd 0,018 0,016 0,048
As mg/L 0,001 0,001 0,001 0,021 0,014 0,013
22
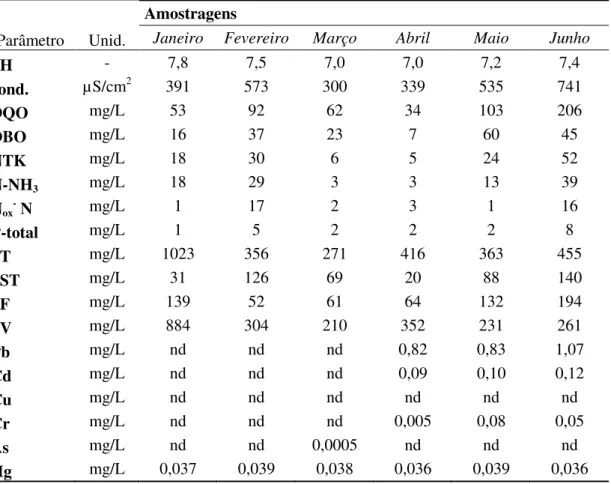
Tabela A2. Médias obtidas nos ensaios de caracterização físico-química das amostras de efluente secundário da ETE Barbosa Lage, Juiz de Fora – MG
Parâmetro Unid.
Amostragens
Janeiro Fevereiro Março Abril Maio Junho
pH - 7,8 7,5 7,0 7,0 7,2 7,4
cond. µS/cm2 391 573 300 339 535 741
DQO mg/L 53 92 62 34 103 206
DBO mg/L 16 37 23 7 60 45
NTK mg/L 18 30 6 5 24 52
N-NH3 mg/L 18 29 3 3 13 39
Nox- N mg/L 1 17 2 3 1 16
P-total mg/L 1 5 2 2 2 8
ST mg/L 1023 356 271 416 363 455
SST mg/L 31 126 69 20 88 140
SF mg/L 139 52 61 64 132 194
SV mg/L 884 304 210 352 231 261
Pb mg/L nd nd nd 0,82 0,83 1,07
Cd mg/L nd nd nd 0,09 0,10 0,12
Cu mg/L nd nd nd nd nd nd
Cr mg/L nd nd nd 0,005 0,08 0,05
As mg/L nd nd 0,0005 nd nd nd
23
Tabela A3. Médias obtidas nos ensaios de caracterização físico-química das amostras de mistura esgoto-lixiviado afluente nas ETE Barbosa Lage, Juiz de Fora – MG
Mistura esgoto-lixiviado
Parâmetro Unid.
Amostragem
Janeiro Fevereiro Março Abril Maio Junho
pH - 7,4 7,6 7,2 7,4 7,6 8,1
cond. µS/cm2 1343 2470 2110 2950 1551 5530
DQO mg/L 1457 841 2474 2957 909 1660
DBO mg/L 917 344 1050 1848 371 704
NTK mg/L 89 134 127 204 118 282
N-NH3 mg/L 78 116 106 176 100 233
Nox- N mg/L 25 50 51 115 15 55
P-total mg/L 6 4 2 6 5 6
ST mg/L 1680 1460 2196 2440 978 2272
SST mg/L 567 245 358 455 242 288
SF mg/L 1080 626 1152 1252 552 1104
SV mg/L 600 834 1044 1188 426 1168
Pb mg/L nd nd nd 1,11 1,07 1,14
Cd mg/L nd nd nd 0,11 0,13 0,14
Cu mg/L nd nd nd nd nd nd
Cr mg/L nd nd nd 0,28 0,23 0,24
As mg/L nd nd nd 0,013 0,012 0,012
24
Tabela A4. Médias obtidas nos ensaios de caracterização físico-química das amostras de lixiviado bruto do Aterro Sanitário Salvaterra, Juiz de Fora – MG
Parâmetro Unid.
Amostragens
Janeiro Fevereiro Março Abril Maio Junho
pH - 7,4 7,8 7,4 7,5 8,0 8,4
cond. µS/cm2 7290 7490 11410 14250 24940 24100
DQO mg/L 23600 2385 16396 18830 19305 15653
DBO mg/L 12669 1218 10707 10879 6414 4369
NTK mg/L 1173 463 750 1246 2100 2136
N-NH3 mg/L 549 434 680 980 1823 1896
Nox- N mg/L 174 93 169 115 271 245
P-total mg/L 1 5 2 5 6 9
ST mg/L 71750 4610 13260 13780 18716 18320
SST mg/L 65125 490 965 1560 665 805
SF mg/L 24800 1790 6500 6455 8474 7684
SV mg/L 46950 2820 6760 7325 10242 10636
Pb mg/L 0,03 nd nd 1,23 1,16 1,42
Cd mg/L nd nd nd 0,40 0,16 0,19
Cu mg/L 2,54 nd nd nd nd nd
Cr mg/L 1,31 nd nd 0,59 0,49 0,87
As mg/L 0,012 0,013 0,014 0,0005 0,012 0,012
25 ANEXO B – RESULTADOS DOS BIOENSAIOS DE TOXICIDADE AGUDA
Tabela B1: Resultados dos ensaios de toxicidade aguda para o esgoto bruto sobre D. similis,
48h
Concentração, %
Nº de organismos/organismos afetados
Janeiro Fevereiro Março Abril Maio Junho
0 10/0 10/0 20/0 20/0 20/0 20/1
6,25 10/1 10/0 20/0 20/0 20/0 20/0
12,5 10/0 10/0 20/0 20/0 20/0 20/0
25 10/0 10/0 20/1 20/0 20/0 20/0
50 10/0 10/0 20/3 20/0 20/0 20/0
100 10/0 10/0 20/1 20/0 20/0 20/0
Tabela B2: Resultados dos ensaios de toxicidade aguda para o efluente secundário sobre D. similis, 48h, após cotratamento de esgoto e lixiviado.
Concentração, % Nº de organismos/organismos afetados
Janeiro Fevereiro Março Abril Maio Junho
0 10/1 10/0 20/0 20/0 20/0 20/1
6,25 10/1 10/0 20/0 20/0 20/1 20/4
12,5 10/0 10/1 20/1 20/0 20/0 20/2
25 10/0 10/1 20/1 20/0 20/0 20/0
50 10/0 10/0 20/0 20/0 20/0 20/1
80 - - 20/2 - - -
85 - - 20/3 - - -
90 - - 20/8 - - -
95 - - 20/12 - - -
26
Tabela B3: Resultados dos ensaios de toxicidade aguda para a mistura esgoto-lixiviado afluente na ETE, sobre D. similis, 48h
Concentração, % Nº de organismos/organismos afetados
Janeiro Fevereiro Março Abril Maio Junho
0 10/0 10/0 20/0 20/0 20/0 20/2
6,25 10/1 10/0 20/0 20/0 20/0 20/0
12,5 10/0 10/0 20/0 20/0 20/0 20/0
25 - 10/0 20/0 20/0 20/0 20/1
35 10/0 10/2 - - - -
37,5 - 10/5 - - - -
40 - 10/9 - 20/0 - 20/1
42,5 - 10/6 - - - -
45 - 10/10 - - - -
50 - 10/10 20/1 20/9 - 20/7
60 - - - 20/19 - 20/20
100 10/0 10/0 20/11 20/20 20/7 20/20
Tabela B4: Resultados dos ensaios de toxicidade aguda para o lixiviado bruto sobre D. similis, 48h
Concentração, %
Nº de organismos/organismos afetados
Janeiro Fevereiro Março Abril Maio Junho
0 10/0 10/0 20/0 20/0 20/0 20/0
2 - - - 20/1
3 - - - - 20/0 -
4 - - - - 20/12 20/2
5 - - - - 20/17 -
6 - - - - 20/20 20/18
6,25 10/1 10/2 20/0 20/0 20/20 -
8 - - - 20/20
10 - - 20/0 20/1 - -
12,5 10/0 10/4 20/1 20/1 20/20 20/20
15 - 10/7 20/9 20/16 - -
17,5 - 10/10 20/15 20/18 - -
20 - 10/9 20/20 - - -
25 10/9 10/10 20/20 20/20 20/20 20/20
50 10/10 10/10 20/20 20/20 20/20 20/20
27
Tabela B5: Resultados dos ensaios de toxicidade aguda para a mistura esgoto-lixiviado preparada em bancada, sobre D. similis, 48h
Proporção de lixiviado, %
Nº de organismos/organismos afetados
Janeiro Fevereiro Março Abril Maio Junho
0 10/0 10/0 20/2 20/0 20/0 20/0
0,25 - - - 20/1
0,5 - - - 20/2
0,75 - - - 20/9
1 - - - - 20/6 20/9
1,25 - - - 20/11
2 - - - - 20/18 -
2,5 - - 20/1 - - -
3,5 - - - - 20/20 -
5 - 10/4 20/2 20/0 - -
5,5 - - - - 20/20 -
7,5 - - 20/13 20/1 - -
10 10/4 10/9 20/20 20/0 20/20 20/20
12,5 - - 20/19 20/10 - -
15 10/7 10/10 - 20/13 - -
20 10/9 10/10 - - - -
25 10/10 10/10 20/20 20/20 20/20 20/20
Tabela B6: Toxicidade (CE50 e intervalo de confiança, 95%) do esgoto bruto (EB), lixiviado
(L), misturas esgoto-lixiviado preparada em bancada (EB-L preparada) e afluente (EB-L afluente) a D. similis
Amostra CE50 (%)
Janeiro Fevereiro Março Abril Maio Junho
EB NT NT NT NT NT NT
L
18,2 (15,8 –
20,9)
12,1 (9,2 – 16,0)
15,5 (14,7 – 16,3)
14,1 (13,5 – 14,7)
4,0 (3,7 – 4,2)
4,6 (4,2 – 5,2)
EB-L preparada
11,5 (7,6 – 14,0)
5,6 (3,4 – 7,3)
7,0 (6,4 – 7,6)
12,9 (10,5 – 15,7)
1,3 (1,1 – 1,5)
1,1 (0,8 – 1,6)
EB-L
afluente NT NT
91,9
(89,7 – 94,2) NT NT NT
28
Tabela B7: Correlações entre a CE50 e os parâmetros físicos e químicos das amostras de efluente secundário, lixiviado bruto e mistura esgoto-lixiviado
afluente.
Efluente secundário
pH cond. DQO DBO NTK N-NH3 NOX
–
P ST SST SF SV Pb Cd Cu Cr As Hg CE50
CE50 -0,55 -0,53 -0,24 -0,21 -0,46 -0,50 -0,33 -0,24 -0,38 -0,10 -0,40 -0,31 -0,44 -0,44 - -0,32 1,00 0,17 1,00
Lixiviado bruto
CE50 -0,86 -0,80 -0,16 0,42 -0,87 -0,84 -0,83 -0,62 -0,08 0,06 -0,10 -0,07 -0,61 -0,13 0,05 -0,39 -0,28 0,62 1,00
Mistura esgoto-lixiviado afluente
CE50 -0,16 0,39 0,65 0,38 0,37 0,36 0,52 -0,41 0,72 -0,14 0,52 0,81 -0,13 -0,16 - -0,10 -0,14 -0,19 1,00
29 ANEXO C – RESULTADOS DOS ENSAIOS DE TOMADA DA TAXA DE
CONSUMO DE OXIGÊNIO
Tabela C1: Taxa de consumo de oxigênio no esgoto bruto (EB) e em misturas esgoto-lixiviado (L%EB) nas proporções de 5, 10 e 20% v/v, e sólidos suspensos voláteis do lodo.
Amostra EB Taxa de consumo de oxigênio mg OL5EB L10EB 2/L.h L20EB SSV lodo g/L
Janeiro 0,13 0,17 0,18 0,20 4,1
Fevereiro 0,13 0,16 0,23 0,28 4,1
Março 0,11 0,07 0,09 0,33 4,7
Abril 0,39 0,56 0,47 0,43 16,5
Maio 1,92 2,12 2,16 1,92 12,1
Junho 0,60 0,68 0,61 0,64 15,8
Tabela C2. Correlações entre a taxa específica de consumo de oxigênio (TECO) do esgoto bruto (EB) e misturas lixiviado-esgoto (L%EB) e os resultados dos parâmetros físicos e
químicos do esgoto bruto.
Parâmetros (EB)
TECO
EB L5EB L10EB L20EB
pH 0,55 0,73 0,43 -0,46
Cond. 0,05 -0,25 -0,08 0,08
DQO -0,31 -0,38 0,05 0,69
DBO -0,74 -0,60 -0,37 0,36
NTK 0,10 -0,14 -0,30 -0,45
N-NH3 0,17 0,04 -0,18 -0,59
NOX – -0,51 -0,33 -0,16 0,28
P -0,18 -0,46 -0,20 0,72
ST -0,13 -0,25 0,32 0,91
SST -0,05 0,00 0,56 0,58
SF -0,27 -0,31 0,28 0,83
SV -0,06 -0,22 0,33 0,93
Pb 0,28 0,29 -0,21 -0,84
Cd 0,32 0,29 -0,18 -0,82
Cu -0,55 -0,05 -0,33 -0,57
Cr 0,49 0,38 -0,09 -0,56
As -0,05 0,19 -0,30 -0,91
Hg -0,29 -0,43 -0,60 -0,39
30
Tabela C3: Correlações entre a Taxa específica de consume de oxigênio (TECO) do esgoto bruto (EB) e misturas lixiviado-esgoto (L%EB) e os resultados dos parâmetros físicos e
químicos do lixiviado (L).
Parâmetros (L)
TECO
EB L5EB L10EB L20EB
pH 0,80 0,53 0,33 -0,31
Cond. 0,36 0,13 -0,25 -0,61
DQO -0,18 -0,07 -0,57 -0,55
DBO -0,60 -0,38 -0,64 -0,19
NTK 0,49 0,36 -0,17 -0,74
N-NH3 0,44 0,23 -0,20 -0,64
NOX – 0,45 0,10 -0,24 -0,39
P 0,52 0,42 0,21 -0,43
ST 0,20 0,34 0,11 -0,11
SST 0,16 0,34 0,22 0,02
SF 0,16 0,29 0,03 -0,15
SV 0,22 0,36 0,15 -0,09
Pb 0,24 0,30 -0,22 -0,85
Cd -0,19 0,14 -0,33 -0,85
Cu 0,17 0,34 0,23 0,03
Cr 0,42 0,61 0,10 -0,54
As 0,43 -0,08 0,25 0,66
Hg -0,26 -0,38 0,12 0,90
CE50 -0,80 -0,57 -0,27 0,48
31 ANEXO D – RESULTADOS DOS ENSAIOS DE CRESCIMENTO DE
BIOMASSA
Tabela D1: resultados do monitoramento da DQO nos reatores inoculados com esgoto bruto (R1 e R2) e mistura esgoto-lixiviado 20% v/v (R3 e R4), por um período de 13 dias.
Datas
Reatores
R1 R2 R3 R4
14/mai 86 64 3707 3524
15/mai 111 108 2648 2352
16/mai 63 111 2027 1968
17/mai 34 35 1585 1677
18/mai 80 94 1548 1710
19/mai 80 95 1510 1277
20/mai 114 101 1598 1585
21/mai 89 91 718 685
22/mai 96 98 460 710
23/mai 39 64 1099 1224
24/mai 104 73 1118 1230
25/mai 23 28 1338 1351
26/mai 54 67 1930 1263
Tabela D2: Resultados do monitoramento de SSV nos reatores inoculados com esgoto bruto (R1 e R2) e mistura esgoto-lixiviado 20% v/v (R3 e R4), por um período de 13 dias.
Datas
Reatores
R1 R2 R3 R4
14/mai 39 41 51 45
15/mai 44 43 61 51
16/mai 34 37 56 87
17/mai 31 32 80 82
18/mai 35 31 185 192
19/mai 37 36 170 198
20/mai 42 35 172 184
21/mai 38 45 145 134
22/mai 43 47 235 146
23/mai 39 42 244 320
24/mai 44 33 401 411
25/mai 46 42 408 300