Recebido em 19/setembro/2013 Aprovado em 27/setembro/2014
Sistema de Avaliação: Double Blind Review Editor Cientíico: Nicolau Reinhard
DOI: 10.5700/rausp1196
RESUMO
U.S. subprime inancial crisis contagion on
BRIC and European Union stock markets
Daniel Reed Bergmann é Professor Doutor em Economia das Organizações do Departamento de Administração da Faculdade de Economia, Administração e Contabilidade da Universidade de São Paulo (CEP 05508-010 – São Paulo/SP, Brasil). E-mail: [email protected]
Endereço:
Universidade de São Paulo
FEA – Departamento de Administração Avenida Professor Luciano Gualberto, 908 Cidade Universitária – Butantã
05508-010 – São Paulo – SP
José Roberto Securato, Doutor em Administração e Livre Docente pela Faculdade de Economia, Administração e Contabilidade da Universidade de São Paulo, Professor Titular pela Pontifícia Universidade Católica de São Paulo, é Professor do Departamento de Administração da Faculdade de Economia, Administração e Contabilidade da Universidade de São Paulo (CEP 05508-010 – São Paulo/SP, Brasil), Coordenador e Professor do MBA Finanças e do Laboratório de Finanças da Fundação Instituto de Administração. E-mail: [email protected]
José Roberto Ferreira Savoia, Mestre e Doutor em Administração pela Faculdade de Economia, Administração e Contabilidade da Universidade de São Paulo, Pós-Doutor pela Columbia University (Estados Unidos), é Professor Doutor do Departamento de Administração da Faculdade de Economia, Administração e Contabilidade da Universidade de São Paulo (CEP 05508-010 – São Paulo/SP, Brasil) e Visiting Professor na Columbia University.
E-mail: [email protected]
Eduardo Augusto do Rosário Contani, Doutor em Administração pela Faculdade de Economia, Administração e Contabilidade da Universidade de São Paulo, é Professor do Mestrado Proissional em Administração da FECAP (CEP 01502-001 – São Paulo/SP, Brasil).
E-mail: [email protected] Daniel Reed Bergmann
Universidade de São Paulo – São Paulo/SP, Brasil
José Roberto Securato
Universidade de São Paulo – São Paulo/SP, Brasil
José Roberto Ferreira Savoia
Universidade de São Paulo – São Paulo/SP, Brasil
Eduardo Augusto do Rosário Contani
Centro Universitário FECAP – São Paulo/SP, Brasil
Contágio da crise norte-americana do subprime sobre os mercados dos BRIC e da União Europeia
A Teoria de Cópula foi utilizada para analisar o contágio entre BRIC (Brasil, Rússia, Índia e China) e mercados de ações da União Europeia com o mercado norte-americano. Os índices de mercado utilizados para o período de 01 de janeiro de 2005 a 27 de fevereiro de 2010 foram: MXBRIC (BRIC), MXEU (União Europeia) e MXUS (Estados Unidos). Avalia-se neste artigo a adequação das principais cópulas encontradas na literatura inanceira usando os critérios estatísticos de log-verossimilhança, a informação Akaike e o critério de informação Bayesiana. Apresenta-se um estudo inovador na área de contágio, devido à utilização de cópulas condicionais, que permite calcular o aumento de correlação entre os índices numa abordagem não paramétrica. A cópula condicional simetrizada Joe-Clayton foi a que apresentou o melhor ajuste para os pares de retornos considerados. Os resultados indicam que há evidência do efeito de contágio em ambos os mercados, o da União Europeia e o dos países constituintes do BRIC, para um nível de signiicância de 5%. Além disso, há evidências de que o contágio da crise inanceira nos Estados Unidos foi mais pronunciado na União Europeia do que nos mercados do BRIC para um nível de signiicância de 5%. Dessa forma, carteiras de ações formadas por empresas dos países do BRIC puderam oferecer maior proteção para os investidores durante a crise inanceira do subprime. Esse resultado se alinha a outros estudos que mostram a crescente correlação entre mercados, especialmente em momentos de baixa.
1. INTRODUCTION
Globalization, deregulation and technological advances have deeply changed the relationship between the structures of inancial markets in different countries. There is suficient evidence to show that the increasingly faster transmission of information was responsible for a signiicant portion of greater integration between markets. Faced with these changes, there were questions about the possible disadvantages of this process. Among the many negative aspects pointed out, one of them relates to the intensiication of the phenomenon of inancial contagion and losses linked to discontinuities in the propagation mechanisms of shocks. The closer relationship between markets can lead to a signiicant increase in the vulnerability of economies against external inancial shocks. Thus, inancial contagion raises interest research for economic policy makers and international investors seeking to diversify risks. In the last two decades, the analysis of the patterns of spreading international inancial events became the subject of many academic studies focused on volatility models.
Bianconi, Yoshino and Sousa (2013) stated that the inancial crisis of 2007-2009 has arguably been the irst truly major global crisis since the Great Depression of 1929-1932. While the crisis initially originated in the United States in a relatively small segment of the lending market, i.e. the sub-prime mortgage market, it rapidly spread across virtually all economies, both advanced and emerging, as well as across economic sectors. It also affected equity markets worldwide, with many countries experiencing even sharper equity market crashes than the United States, making it an ideal laboratory to revisit the debate about the presence and sources of contagion in equity markets.
The recent financial crises that occurred in the Latin American economies have raised questions concerning the beneits of diversiication, the robustness of domestic inancial institutions, and the extent of the domino effect with asymmetries in propagation of contaminations. All these points suggest that the measurement of cross-markets linkages and the assessment of changes in their interdependencies during crises may be crucial for decision-makers such as portfolio managers, central bankers and regulatory authorities.
A central issue in asset allocation and risk management is whether inancial markets become more interdependent during inancial crises. The importance of this issue grew dramatically during the ive major crises of the 1990s. It was the largest recession since the early 1980s. From November 1982 to July 1990 the U.S. economy experienced robust growth, modest unemployment, and low inlation. The Reagan boom rested on shaky foundations, however, and as the 1980s progressed signs of trouble began to mount. On October 19, 1987 stock markets around the world crashed. In the U.S., the Dow Jones Industrial Average lost over 22% of its value. Although the causes of Black Monday were complex, many saw the crash
as a sign that investors were worried about the inlation that might result from large U.S. budget deicits. Common to all these events was the fact that the turmoil that originated in one market extended to a wide range of markets and countries in a way that was hard to explain on the basis of changes in economic fundamentals. The word contagion became popular, both in the press and in the academic literature, to refer to this phenomenon.
According to Horta, Mendes and Vieira (2008), the burst of the U.S. mortgage bubble, in August 2007 is largely recognized as the moment when the international inancial markets were stricken by the subprime crisis. Despite the almost generalized interventions by central banks, suggesting that the impact could go global, until then the effects of the crisis were somewhat conined to the U.S.. After the irst liquidity injection by the European Central Bank on August 9 that same year, the supply of funds by central banks became a mandatory rule. By providing low cost money, monetary authorities wanted to ensure that commercial banks could maintain a normal level of activity, in spite of the increasing dificulties faced in the interbank money market. In fact, commercial banks were lending each other less frequently and at higher costs, either following an anticipation of losses and the consequent need to maintain adequate levels of reserves, or relecting the turmoil in the inancial system, motivated by the uncertainties on the real dimension of the crisis.
These episodes suggest that the burst of the U.S. mortgage bubble has, in fact, affected all Developed and Latin America markets. In previous crises, contagion effects were visible in stock market indices, and empirical assessments of inancial contagion often focus on the dependence among stock market indices in turbulent periods (Bae, Karolyi & Stulz, 2003). Cappiello, Gerard and Manganelli (2005), for instance, suggest that the inancial crises that occurred in the 1990s in Asia and Russia affected Latin American markets. Rodriguez (2007) inds evidence of contagion in Asian markets during the 1997 Asian crisis.
An overview of these comprehensive financial crises can be found in Lo (2012). Since inancial theories and risk management analysis rely on the dependence structure of assets, the introduction of an alternative measure that overcomes these limitations is paramount. In order to do so, we will employ the Copula Theory, irst used by Sklar (1959), which proved that a collection of marginal distributions can be joined by means of a copula to produce their multivariate distribution.
suficient then it is not clear how to appropriately measure the dependence between multiple asset returns. Fortunately, the theory of copulas offers a lexible methodology for the general modeling of multivariate dependence. As Cherubini, Luciano and Vecchiato (2004, p. 11) state: “the copula function methodology has become the most signiicant new technique to handle the co-movement between markets and risk factors in a lexible way”.
According to Cherubini et al.(2004), when one or more marginal distributions for a given asset are non-normal, the traditional measure of correlation (Pearson’s correlation coeficient) is suitable because it is only able to capture linear dependence. As asset returns are typically non-normal and feature non-linear dependence, use of a robust measure of association would be more prudent. Correlation, a broad concept when applied to the ields of inance and insurance, is used as a measure of dependence between random variables. Boyer, Gibson and Mulder (1999) detect pitfalls in the conditional correlation coeficient. They show that conditional correlation, given a selected event or a (large) threshold value, possesses a systematic bias and will differ from the (true) non-conditional correlation coeficient even when the latter is constant. One such measure that is particularly convenient for copula modeling is Kendall’s τ.
Peng and Ng (2012) state that the reason for using copula models is that they are very lexible and can model correlations as an alternative tonormal distribution. It can capture the extreme co-movements (tail dependence) that a simple linear correlation fails to model. Patton (2006) suggested using a dynamic copula approach combined with other evaluation models to measure market dependence. Xu and Li (2009) followed this methodology and use three Archimedian copulas to estimate tail dependence across three Asian futures markets.
Nikoloulopoulos, Joe and Li (2012) employed other copula approaches to study relationships between inancial markets but mainly focus on equity indices. Horta et al. (2008) assesses whether the capital markets of developed countries relect the effects of inancial contagion from the U.S. subprime crisis and, if so, whether the intensity of contagion differs across countries. The results in this paper support the evidence for inancial contagion, which may reduce the beneits of international portfolio diversiication with either equity or volatility products. The dependence structure for both volatility indices and stock indices are asymmetric.
In our study we assessed whether the BRIC (Brazil, Russia, India and China) and European Union stock markets relect the effects of inancial contagion from the U.S. subprime crisis and, if so, whether the intensity of contagion differs across them. We will attempt to answer this research question by applying copula theory. Cherubini et al.(2004) note that there are several types of copula, both conditional and non-conditional, which may be used in dependence modeling, such as the Normal, Student,
and Gumbel copulas. The adopted concept of contagion is proposed by Forbes and Rigobon (2002, p. 2223), who posit that inancial contagion is “a signiicant increase in cross-market linkages after a shock to one country (or group of countries)”. Following this, a signiicant increase in the dependence between the U.S. market (the so-called ground-zero market) and the other markets in the sample analyzed (BRIC and European Union), from the pre-crisis period (i.e. before the subprime mortgage bubble burst) to the crisis period (after the burst), may be interpreted as evidence of contagion. When contagion exists, its intensity across markets is also evaluated.
The goal is to measure dependence between the U.S. index and each of the remaining indices during the pre-crisis and crisis period. Thus, the following pairs of markets are assessed: US- -BRIC (US-BRIC) and US-European Union (US-EU).
Rodriguez (2007) explored whether inancial crises can be described as periods of change in the dependence structure between markets. He modeled the dependence structure by asymmetries in tail dependence (e.g. lower dependence index). Mendes (2004) says that crises may propagate faster in one direction - a feature which is captured by asymmetric copulas (e.g. symmetrized Joe-Clayton Copula). As with Chan-Lau, Mathieson and Yao (2004), contagion can be deined as the probability of observing large return realizations simultaneously across different inancial markets (co-exceedances), rather than as increases in correlations.
There are many papers that deal with inancial contagion between stock markets. Serwa and Bohl (2005) apply methods using heteroscedasticity-adjusted correlation coeficients to discriminate between contagion, interdependence and breaks in stock market relationships. Mendes (2004) measured the asymmetry between the markets using copulas.
This article will address the types of copula described in the inancial literature and classify copulas according to their goodness of it. Following Patton (2006), Canela and Pedreira (2012), and Breymann, Dias and Embrechts (2003) goodness of it was measured by applying the econometric concepts of Log-Likelihood (LL), Akaike’s Information Criterion (AIC), and Bayesian Information Criterion (BIC).
The paper is organized as follows: the second section presents the empirical framework, deining contagion and the different copula types. Section 3 presents and methodology used. The indings and conclusions are presented in Section 4.
2. CONTAGION AND COPULA THEORY
density functions fi, i = 1,2,..., d. then a unique copula C exists, which pertains to F, deined on [0.1]d such as
C(F1(x1), F2(x2),..., Fd(xd)) = F(x1,x2,..., xd) [1]
holds or any (x1, x2,..., xd) d (SKLAR, 1959). Let F
i(Xi) = Ui, i
= 1..., d. From the assumptions made, Ui follows a uniform (0,1) distribution. Therefore a copula is a multivariate distribution with standard uniform margins. Multivariate modeling through copulas allows us to factor the joint distribution into its marginal univariate distributions and a dependence structure – its copula. By taking partial derivatives of (1), one obtains:
f(x1,..., xd) = c1...d(F1(x1),..., Fd(xd)) fi(x1) [2]
for some d-dimensional copula density c1...d. This decomposition allows us to estimate the marginal distributions fi separated from the dependence structure given by the d-variate copula. In practice, this aspect simpliies both speciication and estimation of the multivariate distribution.
The copula C provides all information about the dependence structure of F, regardless of the speciication of the marginal
distributions. It is invariant under monotone increasing transformations of X, making copula-based dependence measures relevant scale-free tools for studying dependence. For example, to measure monotone dependence (not necessarily linear), one may use Spearman’s rank correlation (r).
r(X1, X2) = 12 u1u2dC(u1, u2) – 3 [3]
The rank correlation r is invariant under strictly increasing transformations. It always exists in the interval [-1,1], does not depend on the marginal distributions; the values +1 and -1 occur when the variables are functionally dependent, that is, when they are modeled by one of the Fréchet limit copulas.
The copula function builds a bridge between the univariate distributions and their multivariate distribution. This justiies the fact that a copula will create dependence alone, as the probability distribution of the random variables involved is given solely by their marginal distributions. The bivariate copulas used in this article are described below. All of the following deinitions can be found in Cherubini et al. (2004).
The Gaussian Copula function is:
CGa (v,z) = Ф
ρXY (Ф–1 (v), Ф–1 (z)) [4]
where ФρXY is the joint distribution function of a standard bivariate normal vector with linear correlation coeficient ρXY; Ф is the standard normal distribution function. Therefore,
[5]
As expression [1] is parameterized by the linear correlation coeficient, it may also be rendered as CρGa. The following
representation, as demonstrated by Roncalli (2001), is equivalent to expression [5]:
[6]
The conditional version of [6] may be expressed by:
[7]
The Gaussian copula generates a multivariate normal distribution if the marginal distributions are standard normal (Sklar, 1959).
Let tυ:ℜ → ℜ be the univariate Student’s t distribution with I degrees of freedom:
[8]
where Γ(.) is the Euler function. Withρ∈I and tρ,υ the bivariate distribution function corresponding to tυ is:
[9]
The conditional version of [6] may be expressed by:
[10]
Copula generalizes the bivariate t-distribution because it can adopt any marginal distribution.
The Plackett family of copulas is given by:
[11]
for θ = 1, C1 (u, v) = uv, giving the well-known product copula. It is used when two independent random variables are present.
Rockinger and Jondeau (2001) used the Plackett Copula and a dependence measure to ascertain whether the linear dependence varies over time. They worked with returns of European stock market series, the S&P500 index and the Nikkei index. One disadvantage of the Plackett Copula is that it cannot be easily extended for dimensions larger than two.
According to Gumbel (1960):
[12]
The dependence parameter is restricted to the interval [1,∞). Values of 1 and + ∞ correspond to independence and the Fréchet upper bound, but this copula does not attain the Fréchet lower bound for any value of θ. Similar to the Clayton Copula, Gumbel (1960) does not allow negative dependence, but in contrast to Clayton, Gumbel exhibits strong right tail dependence and relatively weak left tail dependence. If outcomes are known to be strongly correlated at high values but less correlated at low values, then the Gumbel Copula is an appropriate choice.
According to Frank (1979):
[13]
The dependence parameter θ may assume any real value (-∞, +∞). Values of -∞, 0, and +∞ correspond to the Fréchet lower bound, independence, and the Fréchet upper bound, respectively. The Frank Copula is popular for several reasons. Firstly, unlike some other copulas, it permits negative dependence between the marginal distributions. Secondly, dependence is symmetric in both tails, similarly to the Gaussian and Student-t Copulas. Thirdly, it is “comprehensive”, in the sense that both Fréchet bounds are included in the range of permissible dependence. Consequently, the Frank Copula can, in theory, be used to model outcomes with strong positive or negative dependence.
According to Clayton (1978):
[14]
As θ approaches zero, the marginals become independent. As θ approaches ininity, the copula attains the Fréchet upper
bound, but for no value does it attain the Fréchet lower bound. The Clayton Copula cannot account for negative dependence. It has been used to study correlated risks because it exhibits strong left tail dependence and relatively weak right tail dependence. Anecdotal and empirical evidence suggests that loan defaults are highly correlated during periods of recession. Similarly, researchers have studied the “broken heart syndrome” in which spouses’ ages at death tend to be correlated. When correlation between two events, such as performance of two funds or spouses’ ages at death, is strongest in the left tail of the joint distribution, Clayton is an appropriate modeling choice.
Rotation allows the copula to exhibit lower tail dependence, unlike the unrotated Gumbel Copula [12], which only has upper tail dependence. The distribution function is as follows:
[15]
Patton (2006) used a modiied Joe-Clayton Copula to model exchange rate returns. The Joe-Clayton Copula is given by:
[16]
with
κ = 1/log2 (2 – τυ)
γ = –1/log2 (τL)
τυ (0,1), τL (0,1)
The copula has two parameters – τυ and τL, which allow upper tail and lower tail dependence modeling respectively (Patton, 2006). The Joe-Clayton copula still has some slight asymmetry when τυ = τυ, which is not convenient in the inancial studies environment. In order to overcome this issue, the copula must be modiied, leading to the so-called symmetrized Joe--Clayton Copula:
[17]
which is symmetrical when τυ = τυ.
asymmetries in the dependence structure of a set of exchange rates.
For the bivariate case, Patton (2006) extended the standard deinition of the copula to the conditional case. In order to do so the heteroskedasticity pattern, widely used in the inancial literature for the volatility of asset returns, was taken into account. Furthermore, many situations require a generalized joint conditional density, such as in the pricing of options with multiple underlying assets, or in the calculation of portfolio VaR.
Without assuming any functional structure, it is obviously impossible to estimate the form of each joint distribution. Therefore, this study assumes that the distribution remains constant over time while some of its parameters vary according to some inite difference equation.
When modeling marginal distributions, Patton (2006) assumes that conditional means evolve according to an autoregressive process, and that the evolution of conditional variances follows a GARCH (1,1) process. The evolution of Ct must also be considered. One may only consider the case in which parameters vary with time (that is, only the functional form of the Conditional Copula remains ixed), or cases in which both the functional form of the copula and its parameters vary. Our Conditional Copula Modeling followed the assumptions outlined by Patton (2006).
Nelsen (1999) shows that any convex linear combination of copulas is also a copula and a time-varying functional form of the conditional copula could, therefore, be a convex sum of several types of copulas.
2.1. Measures of dependence
A considerable number of concepts underlie the notion of association, some of which will be presented in this section. Among the most commonly used measures of association are: agreement (as distinguished from dependence), linear correlation, tail dependence and positive quadrant dependence. Some measures associated with the above include Kendall’s τ, Spearman’s ρ, the linear correlation coeficient and tail dependence indices.
All measures of dependence are related to the properties of copulas, since by coupling a distribution function to its marginals, a copula “captures certain […] aspects of the relationship between the variates, from which it follows that […] positive dependence concepts are properties of the copula” (Nelsen, 1999, p. 29).
2.2. Tail dependence
As the name suggests, measures of tail dependence are used to capture dependence in the tail of a bivariate distribution. They describe the extent to which high (or low) values of a random variable follow the high (or low) values of another random variable. In some cases the concordance between
extreme (tail) values of random variables is of interest. For example, one may be interested in the probability that stock indices in two countries exceed (or fall below) given levels. This requires a dependence measure for upper and lower tails of the distribution. Such a dependence measure is essentially related to the conditional probability that one index exceeds a given value given that another exceeds a given value. If such a conditional probability measure is a function of the copula, then it too will be invariant under strictly increasing transformations.
Li and Rose (2009) showed that most investable portfolios have lower tail risk but higher tail dependence than non--investable ones; emerging markets are likely to be more dependent on the world market during large joint losses than large joint gains; and tail dependence of the aggregate and investable markets on the world market varies across countries and regions. Their study employed the skewed Student-t GJR--GARCH model and the SJC Copula.
Let X and Y be continuous random variables with distribution functions F and G, respectively. The upper tail dependence parameter λU is the limit (if it exists) of the conditional probability that Y is greater than the 100t-th percentile of G given that X is greater than the 100t-th percentile of F as t approaches 1 from the left, i.e.:
[18]
Likewise, the lower tail dependence parameter λL is the limit (if it exists) of the conditional probability of Y being less than or equal to the 100t-th percentile of G given that X is less than or equal to the 100t-th percentile of F as t approaches 0 from the right, i.e.:
λL = limt→0 + P [Y ≤ G(–1) (t) X ≤ F(–1) (t)] [19]
These parameters are nonparametric and depend solely on the copula of X and Y. According to Rodriguez (2007), intuitively, asymptotic tail dependence is a measure of the propensity of markets to crash (or boom) together, i.e., it can be treated as the contagion effect. As Chan-Lau et al. (2004) posit, Contagion can be deined as the probability of observing
large returns simultaneously across different inancial markets (co-exceedances) rather than as increases in correlations. So,
λL will be used as a measure of contagion between markets. Two tests are performed to identify the affected markets and the existence of distinct levels of contagion intensity. The irst assesses whether evidence of contagion emerges after the U.S. subprime mortgage bubble burst (the ground-zero market) in August 2007. The second assesses whether the contagion effect is more intense in the BRIC markets than in the European Union market.
H0: ∆ λL = λL (crisis) – λL(pre – crisis) ≤ 0
H1: ∆ λL = λL (crisis) – λL(pre – crisis) > 0
There is evidence of contagion if the null hypothesis was rejected for a given level of signiicance (5%).
Test 2 – If contagion is more intense in market A than in market B, the increase in dependence between the U.S. market and market A, relevant to the pre-crisis up to the crisis period, is higher than between the U.S. market and market B. Using a lower dependence tail index, the test may be expressed as:
H0: ∆ λLA–B = {λAL (crisis) – λAL(pre – crisis)} –
{λB
L (crisis) – λBL(pre – crisis)} ≤ 0
H1: ∆ λLA–B = {λAL (crisis) – λAL(pre – crisis)} –
{λB
L (crisis) – λBL(pre – crisis)} > 0
There is evidence of more contagion in market A than B if the null hypothesis was rejected for a given level of signiicance (5%). The limitation is related to the fact that this test may only be conducted for conditional copulas. Rodriguez (2007) and Horta et al. (2008) did not use conditional copulas.
3. DATA AND METHODOLOGY
Horta et al. (2008), state that the pre-crisis period begins
on January 1, 2005 and ends immediately before the subprime burst, which is generally regarded as having occurred on August 1, 2007. The crisis period starts at the beginning of August and extends until February 27, 2010, the last day for which data on stock market indices was collected from the Bloomberg platform. Kenourgios, Samitas and Paltalidis (2011) justify the use of weekly data to avoid market microstructure bias at daily frequencies. Thus, weekly closing data on the Morgan Stanley Capital International (MSCI) indices stipulated in U.S. dollars are used for the BRIC and the European Union stock markets.
Table 1 shows the descriptive statistics of the market indices (MXBRIC, MXEU and MXUS).
A sequence of quantitative procedures were applied in series of log-returns of the BRIC (MXBRIC), European Union (MXEU) and United States (MXUS) indices. They are: • Test Normality Distribution of MXBRIC, MXEU and MXUS
log-returns.
• Adjust the univariate non-parametric distribution for each index. [This procedure was also performed by Patton (2006)]. • Decide which family of copula functions (Bivariate Gaussian,
Bivariate Student’s t, Plackett, Gumbel, Frank, Clayton, Rotated Gumbel, Symmetrized Joe-Clayton, Dynamic) is most suitable to represent the particular dependence between log-returns.
• Estimate the parameters of each copula. These parameters refer to both the marginal distributions as the copula that will be used. The LL, AIC and BIC criteria determine the most appropriate statistical copula. The fewer the information criteria for a given copula, the better its statistical it. • Estimate lower tail indices for pairs MXBRIC/MXUS and
MXEU/MXUS in order to verify the impact of contagion on BRIC and European Union stock markets.
• Calculate the conidence intervals for lower tail indices and p-values by the bootstrapping technique. This procedure was also performed by Horta et al. (2008).
• If p-value is lower than 5% for test 1, there is evidence for contagion with a signiicance level of 5%. Similarly, if p-value is lower than 5% for test 2, contagion is more intense
in one market than it is in the other market.
4. RESULTS
We assume that the true copula belongs to a given parametric family C = {Cθ, θ Θ} with certain mathematical properties, the θestimates obtained by the likelihood method (LM), through optimization of the likelihood function of each copula are then consistent and normally distributed.
Of the several maximum likelihood estimation procedures that can be used in the copula environment, we opted to use the canonical maximum likelihood (CML) method, as did Canela and Pedreira (2012).
According to Roncalli (2001), the CML method estimates association of the copula’s θ parameters without taking on any parametric form for the marginal distributions of MXBRIC and MXEU returns. The main advantage is that marginal distributions need not be speciied, therefore making CML a robust approach that is free of marginal distribution-related speciication errors. All algorithms were developed using the MATLAB® software package.
Table 1
Descriptive Statistics of Market Indices (MXBRIC, MXEU and MXUS)
Statistics MXBRIC MXEU MXUS
Mean 0.000915 -0.000169 -0.000357
Std. Dev. 0.05619 0.032067 0.029801
Jarque-Bera
(Normality) 0.000 0.000 0.000
Observations 250 250 250
Note: Mean, standard deviation and Jarque-Bera normality test of the market
The parameters were estimated for the following copulas: Gaussian, Clayton, Plackett, Frank, Gumbel, rotated Gumbel, Student’s t, Student’s t with time-varying parameters, symmetrized Joe-Clayton (SJC), Gaussian with time-varying parameters, rotated Gumbel with time-varying parameters and symmetrized Joe-Clayton with time-varying parameters (SJC-conditional).
Following the studies of Breymann et al. (2003), Patton (2006), Horta et al. (2008) and Canela and Pedreira (2012), this study used a goodness-of-it hierarchy through the econometric concepts of log-likelihood (LL), Akaike’s information criterion (AIC) and Bayesian information criterion (BIC). Table 2 and Table 3 shows the results obtained.
Figure 1 presents the evolution of the cumulative returns of the following indices: MXBRIC, MXEU and MXUS between 2000 and 2010.
From 2000 to 2004, cumulative returns of both markets are very similar and after that curves decoupled. We calculated a higher correlation between MXEU and MXUS than between MXBRIC and MXUS during the subprime crisis. The hypothesis tests presented below conirm this intuition.
Our results show that the most appropriate copula for modeling the dependence structure of US/BRIC and US/EU
Table 2
LL, AIC, and BIC Results for USA/BRIC Country Estimated Copulas
Copulas (USA/BRICs) LL AIC BIC
Frank Ininite Ininite Ininite
Conditional – SJC -215.5823 -433.1571 -432.1337
Student’s t -210.1533 -432.4127 -430.1325 SJC -208.6570 -422.3072 -423.3028 Gumbel -207.8312 -420.1312 -421.1892 Conditional Rotaded
Gumbel -206.6843 -412.3950 -420.3940 Rotaded Gumbel -203.4930 -401.4929 -400.4939 Plackett -199.4930 -399.4892 -394.3959 Conditional Gaussian -196.0673 -395.4939 -392.4930 Clayton -192.4930 -390.4930 -390.5839 Conditional Student’s t -170.5940 -323.4939 -333.4949 Gaussian -165.4934 -320.5493 -330.5939
Note: The information criteria (LL, AIC, BIC) show the copula with the highest
goodness-of-it in multivariate distribution formed by the U.S. and the BRIC country log-returns. This procedure was performed by Mendes (2004), Patton (2006) and Canela and Pedreira (2012).
Table 3
LL, AIC, and BIC Results for USA/European Union Estimated Copulas
Copulas (USA/EU) LL AIC BIC
Frank Ininite Ininite Ininite
Conditional – SJC -347.1104 -694.2142 -694.1998
Student’s t -341.8180 -683.6166 -683.5734 SJC -336.2935 -672.5805 -672.5661 Conditional Rotaded
Gumbel -329.7838 -659.5579 -659.5363 Rotaded Gumbel -327.2292 -654.4551 -654.4479 Plackett -324.8289 -649.6546 -649.6474 Conditional Gaussian -324.4056 -648.8015 -648.7799 Gumbel -317.5621 -635.1210 -635.1138 Gaussian -317.0587 -634.1141 -634.1069 Clayton -274.1559 -548.3085 -548.3013 Conditional Student’s t -259.8002 -519.5972 -519.5900
Note: The information criteria (LL, AIC, BIC) show the copula with the higher
goodness-of-it in multivariate distribution formed by the log-returns of the U.S. and the European Union. This procedure was performed by Mendes (2004), Patton (2006) and Canela and Pedreira (2012).
was the symmetrized Joe-Clayton Copula with time-varying parameters. The symmetrized Joe-Clayton copula assumes asymmetric tail dependence, implying that upper and lower tail dependence is not equal, which supports the Markwat, Kole and Van Djik (2009) Domino Effect Hypothesis. This means that shocks in the contagion channels evolve into global crashes and signiicantly increase the probability of more severe crashes, similar to a domino effect.
As shown in Tables 2 and 3, dynamic copulas are better suited to asset returns. The most appropriate copula for modeling the dependence structure of US/BRIC and US/ EU markets was the symmetrized Joe-Clayton Copula with time-varying parameters. Patton (2006) also found this same copula to be the most appropriate for modeling international exchange rates. The Frank Copula does not it the data in two tables because the information criteria (LL, AIC and BIC) cannot be calculated. Table 4 shows the statistics for test 1 and test 2.
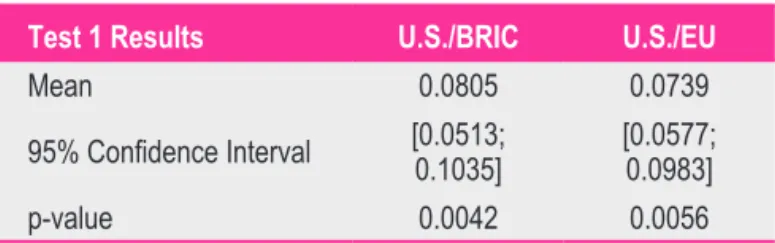
Table 4
Test to Evaluate the Existence of Financial Contagion
Test 1 Results U.S./BRIC U.S./EU
Mean 0.0805 0.0739
95% Conidence Interval [0.0513; 0.1035]
[0.0577; 0.0983]
p-value 0.0042 0.0056
Note: 95% conidence intervals and the p-values calculated using the studentized
bootstrapping technique. Since there is no academic literature to determine the sampling distribution of the indices lower tail dependence, which is our measure of contagion, the tests were conducted using the bootstrapping technique.
Figure 1: Cumulative Returns of MXBRIC, MXUS and MXEU
and Wadhwani (1990), Longin and Solnik (1995), Karolyi and Stulz (1996) and Hartmann, Straetmans and Vries (2004), these results suggest that correlation (dependence) increases more (or is at least larger) during bear markets than during bull markets. Bianconi et al. (2013) showed that the effect of the U.S. inancial stress on the Chinese stock market is negligible. The effect on the stock returns in Brazil and Russia is negative and relatively larger than the effect on the Indian stock market.
5. CONCLUSION
The use of copula allows us to capture how assets relate to each other in moments of greater volatility or crisis. Cherubini et al. (2004) stated that the lack of normality in a random variable is associated with the presence of skewness and/or kurtosis in its marginal distributions. In the multivariate context, the problem of kurtosis may appear through the individual behavior of returns or the inluence of large market movements. This concept is known as tail dependence. Intuitively, assets that do not strongly associate with each other on normal trading days may indicate strong association in extreme market moments and vice-versa.
Firstly, our results show that the most appropriate copula for modeling the dependence structure of US/BRIC and US/ EU markets was the symmetrized Joe-Clayton Copula with time-varying parameters. The symmetrized Joe-Clayton copula assumes asymmetric tail dependence, implying that upper and
lower tail dependence is not equal supporting Domino Effect Hypothesis as Markwat et al. (2009). This means that shocks
in the contagion channels evolve into global crashes and signiicantly increase the probability of more severe crashes, resembling a domino effect.
Secondly, our indings support the evidence of inancial contagion, which may reduce the beneits of international portfolio diversification. The results also suggest that correlation (or dependence) increases more (or is at least larger) in bear markets than in bull markets.
Thirdly, we found that crashes in the U.S. market tend to have a greater effect on the European Union market than on BRIC markets (5% signiicance level). In other words, the contagion of the U.S. subprime crisis was more pronounced in European Union than in BRIC markets.
The dependence structure for both volatility indices and stock indices is asymmetric. Alcock and Hatherley (2009) showed that asymmetric correlation structures ( and ) do have real economic value in portfolio management. The primary source of this economic value is the ability to better protect portfolio value and reduce the size of any erosion in return relative to the normal portfolio when asymmetric return correlations are accounted for.
Therefore, stock portfolios formed by the BRIC countries would offer greater protection during the subprime crisis. The results of this empirical analysis seem to support the operational advantages associated with deinition of contagion proposed by Forbes and Rigobon (2002). In fact, the evidence of increased dependence between countries after the crisis should be carefully considered by portfolio managers as it suggests that a simple strategy of geographical diversiication may not always be successful. Furthermore, the results also support the decisions by the central banks to inject liquidity. In theoretical terms, the crisis-contingent theories appear to be the most adequate to explain the transmission of the shock provoked by the U.S. market crisis.
Alcock, J., & Hatherley, A. (2009). Asymmetric dependence between domestic equity indices and its effect on portfolio construction. The Australian Actuarial Journal, 15(1), 143-180.
Bae, K., Karolyi, G., & Stulz, R. (2003). A new approach to measuring inancial contagion. Review of Financial Studies, 16(3), 716-763.
Bianconi, M., Yoshino, J. A., & Sousa, M. O. M. (2013). BRIC and the U.S. inancial crisis: An empirical investigation of stock and bond markets. Emerging Markets Review, 14,
pp.76-109.
Boyer, B., Gibson, M., & Mulder, C. (1999). Pitfalls in tests for changes in correlations. International Finance Discussion Paper, 597, Board of Governors of the Federal Reserve
System.
Breymann, W., Dias, A., & Embrechts, P. (2003).
Dependence structures for multivariate high-frequency data in inance. Quantitative Finance, 3, pp.1-14.
Canela, M. A., & Pedreira, E. (2012). Modelling dependence in Latin countries markets using copulas functions. Journal of Emerging Market Finance, 11, pp. 231-270.
Cappiello, L., Gerard, B., & Manganelli, S. (2005). Measuring co-movements by regression quantiles. ECB Working Paper,
No. 501.
Chan-Lau, J. A., Mathieson, D. J., & Yao, J. Y. (2004). Extreme contagion in equity markets. IMF Staff Papers. Cherubini, U., Luciano, E., & Vecchiato, W. (2004). Copula
methods in inance. London: John Wiley & Sons Inc. 293p.
REFERENCES
Table 5
Assessing the Degree of Contagion Between the European Union and BRIC Countries
Test 2 Results ΔλLEU–BRIC
Mean 0.1140
95% Conidence Interval [0.1049; 0.1349] p-value 0.0001
Note: 95% conidence intervals and the p-values were calculated when applying
the studentized bootstrapping technique. Since there is no academic literature to determine the sampling distribution of the index lower tail dependence, which is our measure of contagion, the tests were conducted using the bootstrapping technique. The null hypothesis, the difference between the contagion of the different trade blocks is: ∆λLEU–BRIC = {λLEU(crisis) – λ
Clayton, L.G. (1978). A model for association in bivariate life tables and its application in epidemiological studies of familial tendency in chronic disease incidence. Biometrika, 65, pp. 141-151.
Forbes, K., & Rigobon, R. (2002). No contagion, only interdependence: measuring stock markets co-movements.
Journal of Finance, 57, pp. 2223-2261.
Frank, M. J.(1979). On the simultaneous associativity of F(x,y) and x + y – F(x,y). Aequationes Mathematicae, v.19,
pp. 194-226.
Gumbel, E. J. (1960). Bivariate exponential distributions.
Journal of American Statistical Association, 55, pp. 698-707.
Hartmann, P., Straetmans, S., & Vries, C. G. (2004). Asset market linkages in crisis periods. Review of Economics and Statistics, 86, pp. 313-326.
Horta, P., Mendes, C., & Vieira, I. (2008). Contagion effects of the U.S. subprime crisis on developed countries.
CEFAGE-UE Working Paper.
Karolyi, G. A., & Stulz, R. M. (1996). Why do markets move together? An investigation of US-Japan stock return comovements. The Journal of Finance, 51(3), 951-986. Kenourgios, D., Samitas, A., & Paltalidis, N. (2011). Financial crises and stock market contagion in a multivariate time-varying asymmetric framework. Journal of
International Financial Markets, Institutions and Money, 21(1), 92-106.
King, M. A., & Wadhwani, S. (1990). Transmission of volatility between stock markets. Review of Financial studies, 3(1), 5-33.
Li, X. M., & Rose, L. C. (2009). The tail risk of emerging stock markets. Emerging Markets Review, 10(4),
242-256.
Lo, A. (2012). Reading about the inancial crisis: A 21-book review. Journal of Economic Literature, 50, pp. 151-178.
Longin, F., & Solnik, B. (1995). Is the correlation in international equity return constant: 1960-1990? Journal of International Money and Finance, 14, pp. 3-26.
Markwat, T., Kole, E., & Van Djik, D. (2009). Contagion as a domino effect in global stock markets. Journal of Banking & Finance, 33.
Mendes, B. V. M. (2004). Asymmetric extreme
interdependence in Latin equity markets. Appl. Stochastic Models Bus. Ind.
Mendes, B. V. M., Semeraro, M. M., & Leal, R. P. C. (2010). Pair-copulas modeling in inance. Financial Markets and Portfolio Management, 24, pp. 193-213.
Nelsen, R. B. (1999). An introduction to copulas. New York:
Springer-Verlag.
Nikoloulopoulos, A., Joe, H., & Li, H. (2012). Vine copulas with asymmetric tail dependence and applications to inancial return data. Computational Statistics and Data Analysis, 56, pp. 3659-367.
Palaro, H. P., & Hotta, L. K. (2006). Using conditional copula to estimate value at risk. Journal of Data Science, 4,
pp. 93-115.
Patton, A. (2006). Modelling asymmetric exchange rate
dependence. International Economic Review, 47(2),
527-556.
Peng, Y., & Ng, W. L. (2012). Analysing inancial contagion and asymmetric market dependence with volatility indices via copulas. Annals of Finance, 8, pp. 49-74.
Rockinger, M., & Jondeau, E. (2001). Conditional dependency of inancial series: an application of copulas.
Working Paper NER # 82, Paris: Banque de France.
Rodriguez, J. (2007). Measuring inancial contagion: A copula approach. Journal of Empirical Finance, 14. Roncalli, T. (2001). Copulas: A tool for dependence in inance. Working Paper.
Scarsini, M. (1984). On measures on concordance.
Stochastica, 8, pp. 201-218.
Serwa, D., & Bohl, M. T. (2005). Financial contagion vulnerability and resistence: A comparison of European stock markets. Economic Systems, pp. 344-362.
Sklar, A. (1959). Fonctions dé repartition à n dimensions et leurs marges. Publications de l’ Institut Statistique de l’ Université de Paris 8, pp.229-231.
Xu, Q., & Li, X. (2009). Estimation of dynamic asymetric tail dependences: An empirical study on Asia developed futures markets. Applied Financial Economics, 19,
pp. 273-290.
U.S. subprime financial crisis contagion on BRIC and European Union stock markets
The Copula Theory was used to analyze contagion among the BRIC (Brazil, Russia, India and China) and European Union stock markets with the U.S. Equity Market. The market indexes used for the period between January 01, 2005 and February 27, 2010 are: MXBRIC (BRIC), MXEU (European Union) and MXUS (United States). This article evaluated the adequacy of the main copulas found in the inancial literature using log-likelihood, Akaike information and Bayesian information criteria. This article provides a groundbreaking study in the area of contagion due to
REFERENCES
the use of conditional copulas, allowing to calculate the correlation increase between indexes with non-parametric approach. The conditional Symmetrized Joe-Clayton copula was the one that itted better to the considered pairs of returns. Results indicate evidence of contagion effect in both markets, European Union and BRIC members, with a 5% signiicance level. Furthermore, there is also evidence that the contagion of U.S. inancial crisis was more pronounced in the European Union than in the BRIC markets, with a 5% signiicance level. Therefore, stock portfolios formed by equities from the BRIC countries were able to offer greater protection during the subprime crisis. The results are aligned with recent papers that present an increase in correlation between stock markets, especially in bear markets.
Keywords: contagion, copula theory, correlation, U.S. subprime crisis.
Contagio de la crisis financiera subprime de Estados Unidos sobre los BRIC y la Unión Europea
Se utiliza la Teoría de Cópulas para analizar el contagio entre los BRIC (Brasil, Rusia, India y China) y mercados de acciones de la Unión Europea con el mercado estadounidense. Los índices de mercado utilizados para el período del 1 de enero de 2005 al 27 de febrero de 2010 fueron: MXBRIC (BRIC) MXEU (Unión Europea) y MXUS (Estados Unidos). Se evalúa en este trabajo la adecuación de las principales cópulas encontradas en la literatura inanciera mediante el uso de los criterios estadísticos de log-verosimilitud, información de Akaike e información bayesiana. Se presenta un estudio innovador en el área de contagio, debido a la utilización de cópulas condicionales, que permite calcular el aumento de correlación entre los índices, en un enfoque no paramétrico. La cópula Joe-Clayton simetrizada presentó la mejor adecuación para los pares de retornos considerados. Los resultados indican que existe evidencia del efecto de contagio en los mercados de la Unión Europea y de los BRIC, para un nivel de signiicación del 5%. Además, hay evidencias de que el contagio de la crisis inanciera de Estados Unidos fue más pronunciado en la UE que en los mercados de los BRIC para un nivel de signiicación del 5%. De esa manera, las carteras de acciones formadas por empresas de los países BRIC pudieron ofrecer una mayor protección a los inversores durante la crisis inanciera subprime. Este resultado está en línea con otros estudios que muestran la creciente correlación entre los mercados, especialmente en los momentos de caída.
Palabras clave: contagio, teoría de cópulas, correlación, crisis subprime de Estados Unidos.