BRAZILIAN JOURNAL OF OCEANOGRAPHY, 62(4):279-293, 2014
SEASONAL ASSESSMENT OF HYDROGRAPHIC VARIABLES AND
PHYTOPLANKTON COMMUNITY IN THE ARABIAN SEA
WATERS OF KERALA, SOUTHWEST COAST OF INDIA
Sushanth Vishwanath Rai and Madaiah Rajashekhar* Mangalore University - Department of Biosciences
(Mangalagangothri, 574 199, Mangalore, Dakshina Kannada district, India)
*Corresponding author: [email protected]
http://dx.doi.org/10.1590/S1679-87592014069906204
A
B S T R A C TThe seasonal variation of the hydrographic variables and phytoplankton species in the Arabian Sea waters of the Kerala coast, Southern India was investigated during different seasons. The variables such as pH, temperature, salinity, turbidity and chlorophyll-a contents of water were found to be high during pre-monsoon season and the dissolved oxygen content was minimal. The concentration of nutrients viz., nitrate, phosphate, silicate varied independently. In the study a total of 53 species of phytoplankton were recorded. Their density was higher during the post-monsoon season than during other seasons and the diatoms were found to be the dominant species. The major phytoplankton in terms of frequency and abundance were the species namely, Biddulphia mobiliensis, Chaetoceros curvisetus, Licmophora abbreviata, Skeletonema costatum, Prorocentrum micans and Oscillatoria
sp. They showed significant positive correlation with pH, temperature, salinity, nitrate, phosphate and chlorophyll-a contents, whereas turbidity, dissolved oxygen and silicate exhibited significant negative correlation. The Principal Component Analysis (PCA) developed two principal components with 84.74% of total variability in the water quality which separated pre- and post-monsoon periods from the monsoon season on axis I, and pre-monsoon and monsoon periods from post-monsoon on axis II.
R
E S U M OFoi investigada a variação sazonal das variáveis hidrográficas e das espécies de fitoplâncton nas águas do Mar Arábico da costa de Kerala, sul da India, em diferentes estações do ano. Variáveis como pH, temperatura, salinidade, turbidez e conteúdo de clorofila-a das águas mostraram-se altas durante a estação pré-monção enquanto o conteúdo de oxigênio dissolvido foi mínimo. A concentração de nutrientes, tais como nitrato, fosfato e silicato, variaram independentemente da época. Foi encontrado um total de 53 espécies, com picos de densidade durante a estação pós-monção, sendo a dominância exercida pelas diatomáceas. Em termos de frequência e abundância, as espécies mais importantes foram Biddulphia mobiliensis, Chaetoceros curvisetus, Licmophora abbreviata, Skeletonema costatum, Prorocentrum micans and Oscillatoria sp. Estas apresentaram correlação significativa positiva com pH, temperatura, salinidade, nitrato, fosfato e conteúdo de clorofila-a, enquanto que com turbidez, oxigênio dissolvido e silicato exibiram correlação negativa. A Análise de Componentes Principais (ACP) mostrou que os dois primeiros eixos contêm 84,74% da variação na qualidade das águas. O eixo I separou os períodos de pré- e pós-monção do período de monção, enquanto o eixo II separou os períodos de pré-monção e monção do período de pós-monção.
Descriptors: Seasonal variation, Phytoplankton, Hydrographic variables, Kerala coast. Descritores: Variação sazonal, Fitoplâncton, Variáveis hidrográficas, Costa de Kerala.
I
NTRODUCTIONCoastal environments are generally of economic importance and significantly involved in the transport of terrestrial organic matter and associated nutrient elements to the sea. They play a vital role in a nation’s economy by virtue of their resources,
288 BRAZILIAN JOURNAL OF OCEANOGRAPHY, 62(4), 2014
to their increasing human population, urbanization and accelerated developmental activities.
The Arabian Sea is an ocean basin in which the strength of the physical forcing and biological response vary seasonally. The boundary and open ocean processes of the Arabian Sea are influenced by upwelling during summer and cooling in winter that bring agreat amount of nutrients into the upper ocean enhancing primary productivity and ultimately the fisheries (MADHUPRATAP et al., 2001). The reversal in surface circulation during the monsoon, seasonality in the nutrient distribution and light intensities have important effects on primary production in the Arabian Sea (BROCK et al., 1994).
Marine phytoplankton communities which contribute to primary productivity are largely dependent on nutrient availability, light penetration and mixing within the water column in coastal areas, whereas in the open sea they are highly dependent on the depth of the mixed layer and light penetration. However, nutrient availability is frequently referred to as a key factor regulating phytoplankton biomass (ROELKE et al., 1999). Inorganic substances such as nitrogen, phosphorous and silicon are considered to be more important than other nutrients, because they play a key role in phytoplankton abundance, growth and metabolism (GRANT; GROSS, 1966). Seasonal pattern include changes in phytoplankton diversity, composition, biovolume and importantly, the magnitude of primary production (SAWANT; MADHUPRATAP, 1996), but the photosynthetic response to limiting factors might be regulated by changes in species composition and diversity (DUARTE et al., 2006). Substantial work has been carried out relating to species composition and seasonal variation of phytoplankton in different coastal ecosystem of India (MENON et al. 2000; SRIDHAR et al., 2006; SAHU et al., 2012; SIVASANKAR; PADMAVATHI, 2012).
The coastal areas of Kasaragod district, Kerala are extensively exposed to sewage and anthropogenic pollutants and are under the threat of erosion. There are also a few plywood and food industries. The effluents produced at various stages are fed into the Arabian Sea via river mouths. Besides, there are also paddy fields and plantation crops all along the coastal zone. They are generally sprayed with pesticides to control their diseases. In addition, there is a historical fort (Bekal fort) which attracts tourists from nearby places. The information about the water quality and phytoplankton diversity in the Arabian Sea off the Kasargod coast is limited (PILLAI et al., 2000). The present study was undertaken to investigate the hydrographic variables and composition of phytoplankton communities in the Arabian Sea waters off Kasaragod, Kerala, Southern India.
M
ATERIAL ANDM
ETHODSStudy Area
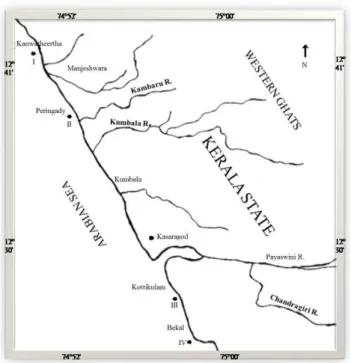
The study area is located between 12°43’and 12°30’N latitude and 74°52’ and 75°00’E longitude. Three sampling sites at Kanwatheertha, Peringady, Kottikulamand Bekalwere selected (Fig. 1). The station locations were fixed with the help of a Global Positioning System (GPS),on a transect parallel to the shoreline and at 200 m from it The Kambaru, the Kumbala, the Payaswini and the Chandragiri are the major rivers that contribute sediment and water discharge into the Arabian Sea atthe sampling stations. The district receives an average rainfall of about 3500 mm annually which varies from 0.27 to 136.77 mm, 545.97 to 1346.07 mm and 5.17 to 224.97 mm, respectively, during the pre-monsoon, monsoon and post-monsoon seasons. The major source of rainfall is the southwest monsoon from June to September which contributes nearly 85.3% of the total rainfall of the year (SOMAN; KRISHNAKUMAR, 1990). The climate here is characterized by excessive humidity during the greater part of the year. The surface currents are southerly during the pre- and southwest monsoon seasons (MURTHY et al., 1982), whereas they become northerly during the northeast monsoon (SHETYE et al., 1994). The region supports intense agricultural and fishing activities.
Collection of Water Samples
Surface water samples for the determination of the physical and chemical variables were collected in pre-cleaned polythene bottles from the three sites of each sampling station seasonally (Pre-monsoon: February to May, Monsoon: June to September and Post-monsoon: October to January) for a period of two years (November 2009- October 2011) and stored in a refrigerator prior to their analysis.
Hydrographic variable analysis
Surface water temperature was measured using a mercury-in-glass thermometer. pH and salinity were analyzed insitu with the help of a Systronics water analyzer. The chlorophyll-a content was analyzed by the acetone extraction method (JEFFREY; HUMPHREY, 1975). The turbidity of the water samples was measured using anephelometer. Dissolved oxygen was determined by Winkler’s titrimetric method. The dissolved nutrients such as nitrate, phosphate and silicate contents were estimated by following the procedure outlined by standard
methods (STRICKLAND; PARSONS, 1972;
RAJASHEKHAR AND RAI: SEASONAL STUDY ON HYDRO-BIOLOGICAL VARIABLES 289
Collection, Preservation and Analysis of Phytoplankton Samples
The phytoplankton samples were collected by filtering 50 liters of surface sea water samples through plankton net cloth of 20 µm pore size and preserved in 4% formaldehyde. The phytoplankton cells were counted using a Sedgewick-Rafter counting chamber under the phase contrast microscope. Standard manuals and publications were used to aid identification of the species (DESIKACHARY, 1959; DESIKACHARY, 1989; TOMAS, 1997).
Statistical analysis
The results were calculated as the mean value of the triplicate tests with the standard deviation. One way analysis of variance (ANOVA) was applied to test for significant differences at p<0.05. The correlation matrix (Pearson's correlation coefficients) was carried out by SPSS statistical software (Version 16.0 for Windows). The principal component analysis (PCA) was performed by XLSTAT software. The similarity indices in phytoplankton diversity between the sampling stations were evaluated by applying Sorensen’s index (SORENSEN, 1948). The diversity indices such as species diversity (SHANNON, 1948), evenness (PIELOU, 1966), richness (MARGALEF, 1958) and dominance (SIMPSON, 1949) were calculated.
R
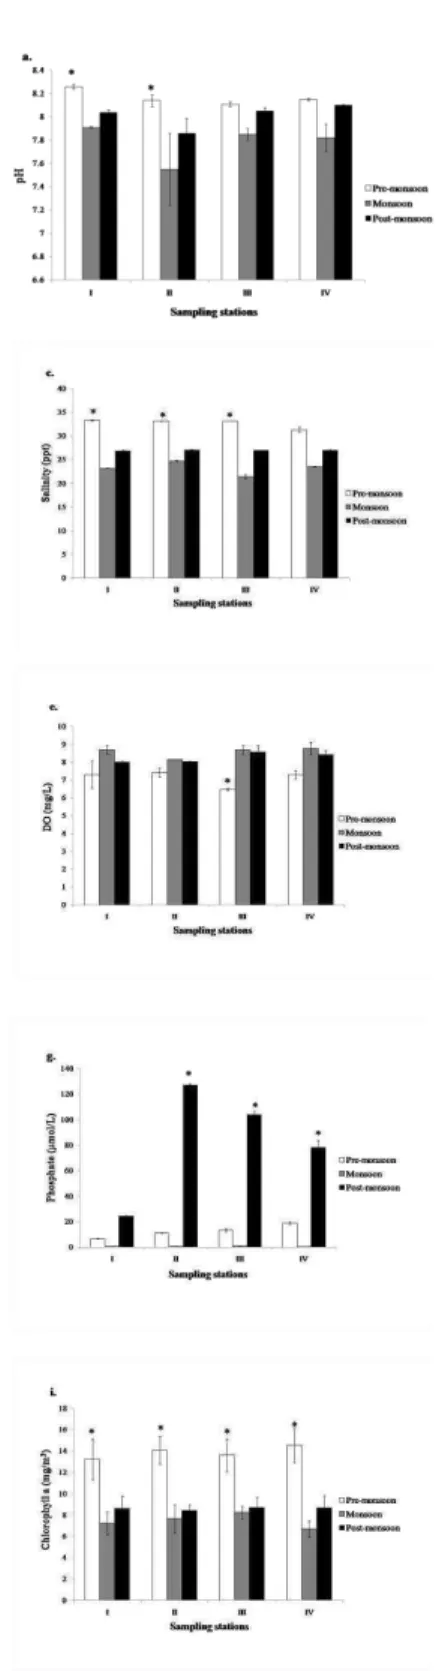
ESULTSThe hydrographic variables at the study stations were subjected to wide seasonal variation (Fig.2 a-i). pH values remained alkaline throughout the study period at all the stations, varying from 7.55 to 8.26. The highest value was observed at the Kanwatheertha station during the pre-monsoon season and the lowest value at Peringady during the monsoon season, respectively. The temperature of the surface water at all the stations showed almost similar values throughout the study period, varying from 29.0 to 31.3˚C. The highest and lowest values were observed during the pre-monsoon and monsoon seasons, respectively (p<0.05). The observed surface salinity values ranged from 21.5 to 33.3 ppt. During the study, lower salinity values were recorded during the monsoon season at the Kottikulam station and higher values were observed at Kanwatheertha during the pre-monsoon season (p<0.05). The turbidity of water samples varied from 7.63 to 20.55 NTU. The highest and lowest values were recorded during the pre-monsoon and post-monsoon seasons at Peringady and Kottikulam stations, respectively (p<0.05). The dissolved oxygen content ranged between 6.48 mg/L at Kottikulam station during the pre-monsoon and 8.78 mg/L at Bekal Fort station during the monsoon period.
Fig. 1. Map of the study area with sampling stations.
288 BRAZILIAN JOURNAL OF OCEANOGRAPHY, 62(4), 2014
Fig. 2(a-h). The hydrograhic variables at different sampling stations during the study period.
RAJASHEKHAR AND RAI: SEASONAL STUDY ON HYDRO-BIOLOGICAL VARIABLES 289
During the study period, the nutrients showed seasonal as well as spatial variations. The concentration of nitrates ranged from 4 μmol/L during the monsoon season in Peringady to 232 μmol/L during the pre-monsoon season in Kanwatheertha (p<0.05). The phosphate values varied from 0.26 μmol/L in Bekal to 127 μmol/L in Peringady and were high during the post-monsoon and low during the monsoon season (p<0.05). The high concentration of silicate was recorded during monsoon and low during post-monsoon periods and varied from 4.38 μmol/L to 289 μmol/L at Peringady station (p<0.05). Chlorophyll-a concentration during the study period ranged from 6.70 to 14.54 mg/m3. The highest concentration was observed during pre-monsoon and low during monsoon periods at Bekal station (p<0.05). A total of 53 phytoplankton species were identified from the study sites during the survey
(Table 1). Of these, 38 species of diatoms, 8 species of cyanobacteria, 5 species of dinoflagellates and 2 species of planktonic green algae were recorded. The diatom species belonged to the genera, Navicula (6), Amphora (4), Achnanthes (3), Chaetoceros (3), Diploneis (3), Biddulphia (2), Caloneis (2), Licmophora (2), Mastogloia (2),Nitzschia (2), Pleurosigma (2), Asterionella (1), Cocconeis (1), Coscinodiscus (1), Cymbella (1), Gyrosigma (1), Pinnularia (1) and Skeletonema (1). The dinoflagellate genera were represented by Dinophysis (2) Prorocentrum (2) and Ceratium (1). The cyanobacteria genera recorded were Lyngbya (2), Oscillatoria (5) and Phormidium (1). The two genera of planktonic green algae, namely Chlamydomonas (1) and Nannochloropsis (1) were observed during the study period.
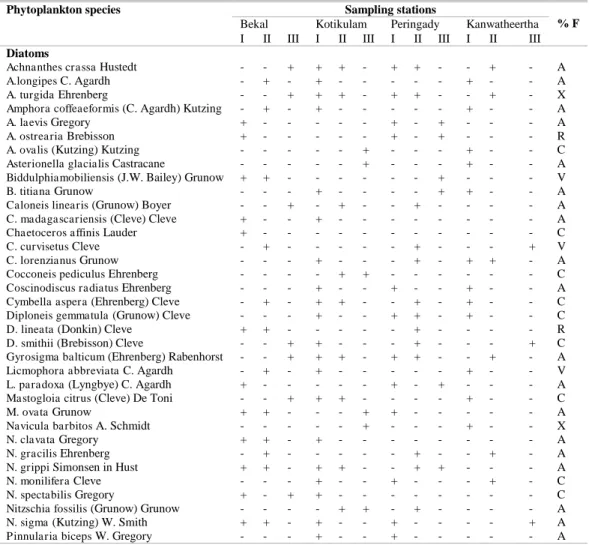
Table 1. Phytoplankton species recorded in the sampling stations of Kasaragod, Kerala coast and their frequency of occurrence (%) during the study period.
Phytoplankton species Sampling stations
% F Bekal Kotikulam Peringady Kanwatheertha I II III I II III I II III I II III Diatoms
Achnanthes crassa Hustedt - - + + + - + + - - + - A
A.longipes C. Agardh - + - + - - - + - - A
A. turgida Ehrenberg - - + + + - + + - - + - X
Amphora coffeaeformis (C. Agardh) Kutzing - + - + - - - + - - A
A. laevis Gregory + - - - + - + - - - A
A. ostrearia Brebisson + - - - + - + - - - R
A. ovalis (Kutzing) Kutzing - - - + - - - + - - C
Asterionella glacialis Castracane - - - + - - - + - - A
Biddulphiamobiliensis (J.W. Bailey) Grunow + + - - - + - - - V
B. titiana Grunow - - - + - - - - + + - - A
Caloneis linearis (Grunow) Boyer - - + - + - - + - - - - A
C. madagascariensis (Cleve) Cleve + - - + - - - A
Chaetoceros affinis Lauder + - - - C
C. curvisetus Cleve - + - - - + - - - + V
C. lorenzianus Grunow - - - + - - - + - + + - A
Cocconeis pediculus Ehrenberg - - - - + + - - - C
Coscinodiscus radiatus Ehrenberg - - - + - - + - - + - - A
Cymbella aspera (Ehrenberg) Cleve - + - + + - - + - + - - C
Diploneis gemmatula (Grunow) Cleve - - - + - - + + - + - - C
D. lineata (Donkin) Cleve + + - - - + - - - - R
D. smithii (Brebisson) Cleve - - + + - - - + - - - + C
Gyrosigma balticum (Ehrenberg) Rabenhorst - - + + + - + + - - + - A
Licmophora abbreviata C. Agardh - + - + - - - + - - V
L. paradoxa (Lyngbye) C. Agardh + - - - + - + - - - A
Mastogloia citrus (Cleve) De Toni - - + + + - - - - + - - C
M. ovata Grunow + + - - - + + - - - A
Navicula barbitos A. Schmidt - - - + - - - + - - X
N. clavata Gregory + + - + - - - A
N. gracilis Ehrenberg - + - - - + - - + - A
N. grippi Simonsen in Hust + + - + + - - + + - - - A
N. monilifera Cleve - - - + - - + - - - + - C
N. spectabilis Gregory + - + + - - - C
Nitzschia fossilis (Grunow) Grunow - - - - + + - + - - - - A
N. sigma (Kutzing) W. Smith + + - + - - + - - - - + A
288 BRAZILIAN JOURNAL OF OCEANOGRAPHY, 62(4), 2014
Pleurosigma angulatum W. Smith + - - + - - + - - - C
P. formosum W. Smith - - + - - - + - - A
Skeletonema costatum (Greville) Cleve + - + - - + + + - + - - V Dinoflagellates
Ceratium belone Cleve + - - + - - - + - - - - A
Dinophysis caudata Saville-Kent + - - + - - + - - - A
Dinophysis sp - - + - - - + - - R
Prorocentrum micans Ehrenberg - - - - + + + - - - V
Prorocentrum sp + - - - + - - - - A Cyanobacteria
Lyngbya dendrobia Bruhl & Biswas + + - - - + - - - A
L. mesotricha Skuja + - - - A
Oscillatoria acutissima Kufferath - - - + - - C
O. agardhii Gomont - + - - - + - - - + A
O. cortiana Meneghini ex Gomont - - - + - - - + - + + - C
O. limosa C. Agardh ex Gomont + + - + - - - V
O. nigroviridis Thwaites ex Gomont - + - - - + - - + - A
Phormidium tenue Meneghini Gomont + + - + + - - + + + - - A Planktonic green algae
Chlamydomonas sp - - + + - - - + - - - + A
Nannochloropsis sp - - + + + - + + - - + - A + : Present; - : Absent; V : Very abundant (81-100 %); A: Abundant (61-80 %); C: Common (41-60 %); R: Rare (21-40 %); X: Present sporadically (1-20 %).
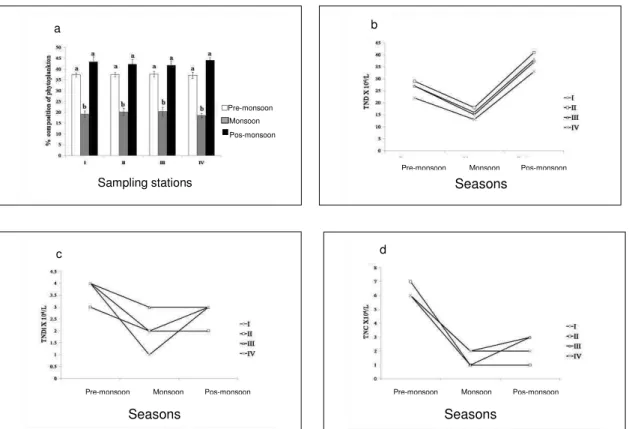
The highest phytoplankton density was recorded during the post-monsoon period followed by the pre-monsoon and monsoon seasons (Fig. 3a, p<0.05). The diatoms were dominant during the study period. The highest number of diatoms in the seasonal variation ofthe phytoplankton community was observed the during post-monsoon and that of the cyanobacteria species during the pre-monsoon season (Fig. 3b and 3d). No significant variation was found in the dinoflagellates (Fig. 3c). The most frequent and abundant diatoms were Biddulphia mobiliensis, Chaetoceros curvisetus, Licmophora abbreviate and Skeletonema costatum. The most abundant dinoflagellates were Prorocentrum micans. Among cyanobacteria, species of Oscillatoria were commonly found at all the sampling stations.
Correlation matrix was determined among 15 physico-chemical and biological variables of water (Table 2). The variables, pH, temperature and salinity significantly correlated with each other. The turbidity showed significant positive correlation with temperature and salinity. The dissolved oxygen exhibited significant negative correlation with other variables such as pH, temperature, salinity, turbidity, nitrate and chlorophyll-a. The silicate showed significant negative correlation with pH, salinity, chlorophyll-a and other nutrients. The phytoplankton composition showed significant positive correlation with pH, temperature, salinity, nitrate, phosphate and chlorophyll-a whereas turbidity, dissolved oxygen and silicate exhibited significant negative correlation.
The diversity indices of phytoplankton species are shown in Table 3. Analysis of phytoplankton diversity revealed that the Shannon-Weiner diversity index was highest at the Bekal Fort station followed by Peringady, Kottikulam, and
Kanwatheertha, respectively. It varied from 3.271 to 3.563. The evenness index was high at Peringady station (0.980) and low at Kottikulam station (0.953). The richness index was found to be high at Kottikulam (7.533), whereas the dominance index was high at Peringady and Bekal stations (0.969). The richness index (6.511) and dominance index (0.958) were low at Kanwatheertha station.
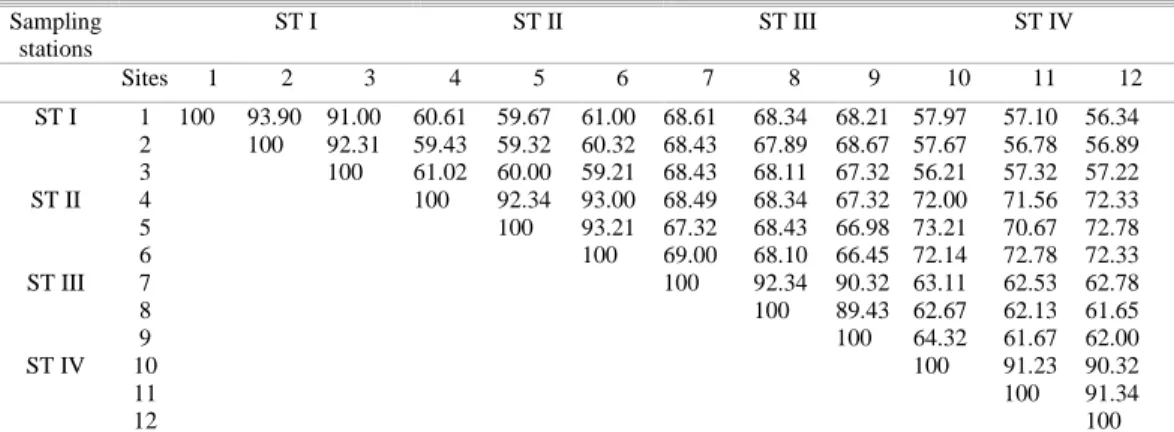
The similarity index of the phytoplankton species between the sites belonging to the same station was generally high (Table 4). The range of similarity between the phytoplankton species of Kanwatheertha station was 91.00 – 93.90%, at Peringady 92.34 – 93.21%, at Kottikulam 89.43 – 92.34% and atBekal 90.32 – 91.34%. The phytoplankton composition of the sites of the variousstations showed low indices of similarity. However, in cases such as the three sites of the Peringady station showed high similarity (70.67 – 73.21%) with three sites of Bekal station.
RAJASHEKHAR AND RAI: SEASONAL STUDY ON HYDRO-BIOLOGICAL VARIABLES 289
0.832), total number of phytoplankton (-0.449), diatoms (-0.692) and dinoflagellates (-0.612). The PCA plot showed that axis I was highly and positively correlated withnitrate, salinity, phytoplankton counts, pH and temperature, whereas axis II strongly correlated with turbidity. The dissolved oxygen and
silicate contents appeared to be negatively correlated with axis I. Axis II was highly and negatively correlated with phosphate and total number of diatoms. The difference in the relative size of axis I and axis II was small (eigen values of 7.09 and 3.93 respectively).
Fig. 3(a-d). The phytoplankton density observed during the study period.
Table 2. Correlation matrix of hydro-biological parameters at the sampling stations of Kerala coast, Southern India. Variables pH Temp. Sal. Tur. DO NO3 PO4 SiO2 Chla TNP TND TNDi TNC
pH 1
Temp. 0.607** 1
Sal. 0.684** 0.873** 1
Tur. 0.047 0.408* 0.337* 1
DO -0.455** -0.722** -0.849** -0.395* 1
NO3 0.757** 0.676** 0.836** -0.187 -0.618** 1
PO4 0.085 -0.093 -0.006 -0.784** 0.155 0.423* 1
SiO2 -0.690** -0.291 -0.419* 0.287 0.208 -0.687** -0.431** 1
Chla 0.637** 0.813** 0.884** 0.479** -0.760** 0.671** -0.177 -0.346* 1
TNP 0.578** 0.491** 0.606** -0.492** -0.429** 0.888** 0.623** -0.629** 0.423* 1
TND 0.384* 0.227 0.330* -0.715** -0.186 0.714** 0.766** -0.578** 0.150 0.936** 1
TNDi 0.489** 0.274 0.411* -0.628** -0.206 0.780** 0.679** -0.589** 0.219 0.938** 0.912** 1
TNC 0.707** 0.885** 0.962** 0.411* -0.834** 0.781** -0.112 -0.412* 0.885** 0.545** 0.238 0.350* 1 Temperature; Sal.: Salinity; Tur.: Turbidity; DO: Dissolved oxygen; NO3: Nitrate; PO4: Phosphate; SiO2:
Silicate; Chla: Chlorophyll-a; TNP: Total number of phytoplankton; TND: Total number of diatoms; TNDi: Total number of dinoflagellates; TNC: Total number of cyanobacteria.
**Correlation is significant at the 0.01 level. *Correlation is significant at the 0.05 level.
Sampling stations a
Seasons b
Pre-monsoon Monsoon Pos-monsoon Pre-monsoon Monsoon Pos-monsoon
Pre-monsoon Monsoon Pos-monsoon
Seasons Seasons
Pre-monsoon
Monsoon Pos-monsoon
d
288 BRAZILIAN JOURNAL OF OCEANOGRAPHY, 62(4), 2014
Table 3. Diversity indices of phytoplankton at the sampling stations during the study period.
Sampling stations Diversity indices
Shannon-Weiner diversity index (H’)
Pielou’s evenness index (J’)
Margalef’s richness index (d)
Simpson dominance index
(D’)
Kanwatheertha 3.271±0.34 0.962±0.09 6.511±0.56 0.958±0.06
Peringady 3.512±0.15 0.980±0.09 7.362±0.76 0.969±0.12
Kottikulam 3.442±0.38 0.953±0.06 7.533±0.34 0.964±0.09
Bekal 3.563±0.27 0.972±0.03 7.399±0.45 0.969±0.08
Table 4.Sorensen’s similarity index (%) of phytoplankton species at the sampling stations. Sampling
stations
ST I ST II ST III ST IV
Sites 1 2 3 4 5 6 7 8 9 10 11 12
ST I 1 100 93.90 91.00 60.61 59.67 61.00 68.61 68.34 68.21 57.97 57.10 56.34 2 100 92.31 59.43 59.32 60.32 68.43 67.89 68.67 57.67 56.78 56.89 3 100 61.02 60.00 59.21 68.43 68.11 67.32 56.21 57.32 57.22 ST II 4 100 92.34 93.00 68.49 68.34 67.32 72.00 71.56 72.33 5 100 93.21 67.32 68.43 66.98 73.21 70.67 72.78 6 100 69.00 68.10 66.45 72.14 72.78 72.33 ST III 7 100 92.34 90.32 63.11 62.53 62.78
8 100 89.43 62.67 62.13 61.65
9 100 64.32 61.67 62.00
ST IV 10 100 91.23 90.32
11 100 91.34
12 100
*ST I: Kanwatheertha; ST II: Peringady; ST III: Kotikulam; ST IV: Bekal
RAJASHEKHAR AND RAI: SEASONAL STUDY ON HYDRO-BIOLOGICAL VARIABLES 289
D
ISCUSSIONAll the sampling stations showed similar seasonal variations in nutrient contents and other physico-chemical characteristics. They depend on several factors such as local climatic conditions, days of sampling, time of sampling and nature of effluents discharged near the sampling stations before or during sampling.
The pH is always taken as the function of the salinity in marine systems and was governed by the amount of free CO2 and HCO3- (LESTER, 1975). The high pH during the pre-monsoon may have been due to the uptake of CO2 by photosynthesizing organisms and high biological activity (BALASUBRAMANIAN; KANNAN, 2005; SRIDHAR et al., 2006). The low pH observed during the monsoon season may be due to the dilution of seawater by freshwater influx, low primary productivity, reduction of salinity, low temperature and organic matter decomposition (RAJASEGAR, 2003). According to HEN and DURBIN (1994), the variation in pH of marine water appears to correlate with change in temperature, dissolved oxygen and phytoplankton production. This is confirmed by the significant positive correlation of pH with temperature, salinity and phytoplankton density and significant negative correlation with dissolved oxygen.
The surface water temperature is influenced by the intensity of solar radiation, tidal currents, freshwater influx, incidence of up-welling waters and atmospheric variations (KANNAN; KANNAN, 1996; GOVINDASAMY et al., 2000). A general increase in the water temperature during the pre-monsoon period could be attributed to high solar radiation (GOVINDASAMY et al., 2000; PUTHIYA et al., 2009). The low temperature in the monsoon season was due to the overcast sky and heavy rainfall (KANNAN; KANNAN, 1996).
Salinity varies in different ecosystems according to topography, tides and freshwater inflow (SATHEESHKUMAR; KHAN, 2009). In the present study, lower salinity values were recorded during the monsoon season, which may be due to the dilution of coastal water by the addition of freshwater from the riverine sources (MCLUSKY, 1989; SATPATHY, 1996; KAMALKANTH et al., 2012), whereas higher values were observed during the pre-monsoon season, which could be attributed to low rainfall, decreased fresh water inflow, high temperature and evaporation (KUMAR et al., 2009; KAMALKANTH et al., 2012; SAHU et al., 2012). BESIKTEPE et al. (1995) reported that during winter and spring, the salinity of the surface water was slightly higher due to both the circulation caused by winds and reduced water influx.
Turbidity of water is generally caused by the presence of suspended matter such as clay, silt, finely divided organic and inorganic matter and other microscopic organisms. It has been reported that wave action increases during the pre-monsoon season resulting in turbulence in the coastal waters favoring the resuspension of the bottom sediment due to stirring action that causes low water transparency (NIXON, 1988). The high turbidity of water during the monsoon period could be due to the influx of heavily silt-laden freshwater (GARG et al., 2006). The phytoplankton cell density also contributes to the turbidity of the water column (KALIMURTHY, 1973). The high turbidity sometimes couples with high nutrient loading that will enhance the growth of phytoplankton (WETSTEYN; KROMKAMP, 1994) and water flushing could also modify nutrient concentrations in the water column and the responses of phytoplankton to nutrient enrichment (LIN et al., 2005). The investigators have found that high turbidity implies high concentration of suspended solids that will decrease light intensity, which ultimately affects the growth of phytoplankton (FLODER et al., 2002; CHOU et al., 2012). This is indicated by the significant negative correlation of turbidity with total phytoplankton count.
Dissolved oxygen (DO) is essential to most aquatic organisms and is greatly affected by their metabolism (TOULIABAH et al., 2002). Seasonal variation in dissolved oxygen is due to freshwater flow and terrigenous impact of sediments (KUMAR et al., 2009). The high values of DO during monsoon and post-monsoon periods could be attributed to the input of DO-rich freshwater (RAJASEGAR, 2003). In the present study, season-wise observation of dissolved oxygen showed an inverse trend to temperature and salinity. Several studies have reported that the greater solubility of oxygen especially during the monsoon season might be due to low temperature and low salinity values (ROCHFORD, 1951; SATPATHY, 1996; PUTHIYA et al., 2009). This is well explained by the significant negative correlation of dissolved oxygen with salinity and temperature.
288 BRAZILIAN JOURNAL OF OCEANOGRAPHY, 62(4), 2014
coconut and paddy fields, sewage and anthropogenic wastes.
Variations in nitrate and its reduced inorganic compounds are predominantly the results of biologically activated reactions (KATHIRAVAN et al., 2013). The high concentration of nitrate was recorded during the pre-monsoon period which could be attributed to higher activity of the oxidation of ammonia from nitrogen to nitrite and subsequently to nitrate during the summer season and the enrichment of terrogenous deposit with a lot of nutrients as the terrestrial run off during the monsoon and subsequent post-monsoon seasons (KALAIARASI et al., 2012). Usually nitrates are built up during the dry season and high levels of nitrates are observed only during early rainy seasons (WOLFHARD; REINHARD, 1998). This is because initial rains flush out deposited nitrate from near-surface soils and the nitrate level reduces drastically as the rainy season progresses. The increase in temperature and rapid mixing of sub-surface and surface water during the pre-monsoon season might have favored the nitrate replenishment mechanism (RAINA et al., 1984). Quick assimilation by phytoplankton and enhancement by surface runoff results in large scale spatio-temporal variation of nitrate in the coastal areas (ZEPP, 1997).
Phosphate is the most important inorganic nutrient that can limit the phytoplankton production in coastal ecosystems. In this study, it showed a high value during the post-monsoon and a low one during monsoon periods. The variation in phosphate content depends upon its concentration in the freshwater that mixes with the seawater, phytoplankton uptake, addition through localized upwelling, adsorption and desorption of phosphate, buffering action of sediment under varying environmental conditions and replenishment as a result of microbial decomposition of organic matter (POMEROY et al., 1965; SATPATHY et al., 2010).
The spatio-temporal variation of silicate in coastal water is influenced by several factors, most importantly the proportional physical mixing of seawater with fresh water, adsorption of reactive silicate into suspended sedimentary particles and biological removal by phytoplankton, especially by diatoms and silicoflagellates (ASTON, 1980). The higher value of silicate observed during the monsoon period in this study may be due to the discharge of freshwater rich with dissolved silicate into the coastal
water (PURUSHOTHAMAN; VENUGOPALAN,
1972). The lower values of silicate observed during the post-monsoon and pre-monsoon periods, could be due to the uptake of silicates by phytoplankton for their biological activity (LISS; SPENCER, 1970; ASTON, 1980), which is confirmed by the negative correlation of silicate with phytoplankton community. The silicate content observed was higher when the
salinity was low and this may be due to heavy influx of freshwater derived from the surrounding drains carrying silicate leached out of rocks. A similar result was also reported by KAMALKANTH et al. (2012) and this is evident from the significant negative correlation of silicate content with salinity.
Chlorophyll-a constitutes the chief photosynthetic pigment of phytoplankton and is an index that would provide the primary production potential upon which the biodiversity, biomass and carrying capacity of the system depends (SAKSHAUG et al., 1997; SATPATHY et al., 2010). A higher value of chlorophyll-a was recorded during the pre-monsoon and alower one during the monsoon season. The high chlorophyll-a value during the pre-monsoon season could be due to the high phytoplankton productivity, as reported by REDEKAR AND WAGH (2000). The reduction in chlorophyll-a during the monsoon season may be due to the dilution of sea water with freshwater discharged from the rivers causing turbidity and lower light availability (RAJASEKAR et al., 2010). A positive correlation was observed between the phytoplankton population and chlorophyll-a content. Similar observations have been made by other researchers (SATPATHY et al., 2010; PANDA et al., 2012). LOPEZ-ARCHILLA et al. (2004) found that the chlorophyll-a concentration was especially elevated during the pH maxima. This was confirmed by the significant positive correlation of chlorophyll-a withpH. Similarly, the strong positive correlation between chlorophyll-a and salinity indicates the significant role of salinity in governing phytoplankton growth and proliferation in coastal water (SAHU et al., 2012).
The characterization of phytoplankton communities has become important in understanding the functionality of ecosystems (CERMENO, 2008). The distribution and abundance of phytoplankton in tropical waters varied remarkably due to the seasonal fluctuations. The high abundance of phytoplankton during the post-monsoon and pre-monsoon seasons could be attributed to the increased salinity, pH, temperature, high nutrient content and high intensity of light penetration (MURALEEDHARAN et al., 2010; BADSI et al., 2012). The total count of phytoplankton was lowest during the monsoon, when the water column was remarkably stratified to a large extent because of heavy rainfall, reduced salinity, high turbidity, decreased temperature and pH (PERUMAL et al., 2009). This is confirmed by the significant positive correlation of phytoplankton density with hydrographic variables such as pH, temperature, salinity, nitrate and phosphate contents.
RAJASHEKHAR AND RAI: SEASONAL STUDY ON HYDRO-BIOLOGICAL VARIABLES 289
Oscillatoria limosa were found abundantly, whereas Amphora ostrearia, Diploneis lineataand Dinophysis sp. were rarely observed during the survey. Some species, namely Achnanthes turgida and Navicula barbitos occurred sporadically. According to EI-GINDY and DORHAM (1992), the interaction between different physico-chemical and biological factors is the causative regulator for seasonal variation and the standing crop of phytoplankton.
Diatoms dominated the phytoplankton community throughout the study period. It has been observed that the high species diversity of the phytoplankton coincided with significantly higher relative diatom abundance (POLAT et al., 2000; HARNSTROM et al., 2009; PANDA et al., 2012). STOWE (1996) reported that in coastal regions, diatoms always prefer to inhabit and dominate the phytoplankton community because the availability of an adequate amount of nutrients and sun light facilitate these microscopic autotrophs'vigorous reproduction.
Diatom diversity was found to be high during the post-monsoon season. This could be due to the low temperature and high concentration of available nutrients (GLIGORA et al., 2007). ANDERSSON et al. (1994) indicated that a high concentration of nutrients along with temperature and light intensity determine the growth of diatoms. It was observed that salinity influenced the abundance of diatoms and a low number of diatoms was recorded during the monsoon when salinity was low and high numbers during periods of increased salinity i.e. during post-monsoon and pre-monsoon seasons (REDEKAR; WAGH, 2000). MITBAVKAR and ANIL (2008) recorded low density of diatoms during the monsoon period when precipitation and run-off reduced the salinity of water. These observations were confirmed by the significant positive correlation of diatom species with temperature, salinity, nutrients such as nitrates and phosphates, and negative correlation with silicate. The dominance of diatoms during both post and pre-monsoon seasons has been noted in earlier studies from the coastal waters of thewest coast of India (DEVASSY; GOES, 1988).
The dinoflagellates did not constitute a significant part of the phytoplankton and are less numerous than the diatoms (RAMAMURTHY, 1965). The productivity and community composition of dinoflagellates are expected to be scanty in most coastal waters (SAHU et al., 2012). YOO (1991) reported that changes in salinity, pH and nutrients cause variations in the abundance and composition of dinoflagellates. It was found that high temperature and salinity are favorable to the growth of dinoflagellates (TAYLOR, 1973). The cells of Prorocentrum micans were commonly observed at all the stations over wide ranges of water temperatures, salinities and nutrient
concentrations, as suggested by ALKAWRI and RAMAIAH (2010).
Cyanobacteria are also abundant in most marine habitats. Their ability to grow in seawater is presumably related to their preference for alkaline conditions (THAJUDDIN; SUBRAMANIAN, 2005). The high abundance of cyanobacteria during the pre-monsoon season may be due to the high light intensity, increased temperature, high salt concentration and nutrient availability. The cyanobacteria require relatively high temperatures for their optimum growth compared to other phytoplankton (SELLNER, 1997). The correlation matrix analysis also showed the significant positive correlation of cyanobacteria species with pH, temperature, salinity and nitrate. The cyanobacteria, particularly Oscillatoria limosa, were the dominant species (PARIKH et al., 2006; HAMED, 2008). This might be due to their wide tolerance for different environmental variables. Oscillatoria limosa was also found to be dominant in the freshwater habitats (RAJESHWARI; RAJASHEKHAR, 2012).
The percentage contribution of microscopic green algae to the total phytoplankton counts was very low. The species of Chlamydomonas and Nannochloropsis were commonly observed planktonic green algae throughout the study.
The similar pattern of seasonal variation in hydrographic variablesand phytoplankton distribution in the Arabian Sea waters of the Karnataka Coast has been reported in our earlier study (SUSHANTH et al., 2011; SUSHANTH; RAJASHEKHAR, 2012).
The toxic bloom formed by dinoflagellates, namely Dinophysis caudata and Dinophysis sp. and cyanobacteria, specifically Oscillatoria acutissima was recorded in this study. It indicates that these species are characteristic of eutrophic conditions.
288 BRAZILIAN JOURNAL OF OCEANOGRAPHY, 62(4), 2014
competitive interactions among species (LOUCKS, 1970; LUCKINBILL, 1973). Among the four stations, Peringady station exhibited a high similarity with Bekal station. This might be due to their more homogeneous geographical conditions. These two stations are very much influenced by freshwater inflow and human activities such as the discharge of anthropogenic wastes. It also depends on the day and time of sample collection. ILYASH AND MATORIN (2007), during their study on phytoplankton in Nhatrang Bay of the South China Sea, noted that variability in phytoplankton composition may be influenced by abiotic factors, riverine runoff, sea depth and anthropogenic wastes.
The Principal Component Analysis (PCA) of the environmental variables determined the sources of influence on the water quality at the sampling stations. The positive loading indicated the contribution of the variables' increases with the increasing loading in dimension and negative loading indicated a decrease
(JAYAKUMAR; SIRAZ, 1997). The PCA
distinguishedthe pre- and post-monsoon periods from the monsoon on axis I, and the pre-monsoon and monsoon from the post-monsoon on axis II. The results of PCA revealed that seasonal effects and riverine discharge were the main factors influencing the sampling stations during the study period.
The present investigation of the hydrographic variables and phytoplankton distribution and abundance provides useful information for further ecological assessment and monitoring of these coastal ecosystems. However, the involvement of more than one factor in limiting the appearance of certain species cannot be ruled out.
A
CKNOWLEDGEMENTThe authors are thankful to the Ministry of Earth Sciences, Government of India, New Delhi for their financial support and Dr. C. Krishnaiah, OASTC and Mrs. Shruthi, M. S., Department of Biosciences, Mangalore University for their help during the study.
R
EFERENCESALKAWRI, A.A.S.; RAMAIAH, N. Spatio-temporal variability of dinoflagellate assemblages in different salinity regimes in the West coast of India. Harmful Algae, v. 9, p. 153-162. 2010.
ANDERSSON, A.; HAECKY, P.; HAGSTROM, A. Effect of temperature and light on the growth of micro, nano and picoplankton: impact on algal succession. Mar. Biol., v. 120, p. 511-520, 1994.
APHA (American Public Health Association).Standard Methods for the Examination of Water and Waste Water. American Public Health Association, Washington, D.C., 1992.p. 522.
ASTON, S. R. Nutrients dissolved gasses and general biochemistry in estuaries. In: OLAUSSON, E.; CATO, I. (Eds.). Chemistry and Biogeochemistry of Estuaries. Wiley, New York, 1980.233-262 p.
BADSI, H.; OULAD ALI, H.; LOUDIKI, M.; AAMIRI, A. Phytoplankton diversity and community composition along the salinity gradient of the Massa estuary. Am. J. Human Ecol., v. 1, p. 58-64, 2012.
BALASUBRAMANIAN, R.; KANNAN, L. Physico-chemical characteristics of the coral reef environs of the Gulf of Munnar biosphere reserve, India. Int. J. Ecol. Environ. Sci., v. 31, p. 265-271, 2005.
BERGER, W. H. Global maps of ocean productivity. In: BERGER, W. H.; SMETACEK, V. S.; WEFER, G. (Eds.). Productivity of the Ocean: Present and Past. John Wiley, Chichester, 1989. 429-455 p.
BESIKTEPE, S. T.; SUR, H. I.; OZSOY, E.; LATIF, M. A. A.; OGUZ, T.; UNLUATA, U. The circulation and hydrography of the Marmara Sea.Prog.Oceanogr.,v. 34, p. 285-334, 1995.
BROCK, J.; SATHYENDRANATH, S.; PLATT, T.A model study of seasonal mixed layer primary production in the Arabian Sea. Proc. Indian Acad. Sci., v. 103, p.163-176, 1994.
CERMENO, P.; MARANNON, E.; HARBOUR, D.; CRESPO, F.; HUETE-ORIEGA, M.; VARELA, M.; HARRIS, R. Resource levels, allometric scaling of population abundance and marine phytoplankton diversity.Limnol.Oceanogr., v. 53, p. 312-318, 2008. CHANG, K. H.; AMANO, A.; MILLER, T. W.; ISOBE, T.;
MANEJA, R.; SIRINGAN, F. P.; IMAI, H.; NAKANO, S. Pollution study in Manila Bay: eutrophication and its impact on plankton community. In: OBAYASHI, Y.; ISOBE, T.; SUBRAMANIAN, A.; SUZUKI, S.; TANABE, S. (Eds.). Interdisciplinary Studies on Environmental Chemistry – Environmental Research in Asia. Terra pub, 2009.261-267 p.
CHOU, W.; FANG, L.; WANG, W.; TEW, K. S. Environmental influence on coastal phytoplankton and zooplankton diversity: a multivariate statistical model analysis. Environ. Monit.Assess.,v. 184, p. 5679-5688, 2012.
CLARKE, K. R.; WARWICK, R. M. Changes in Marine Communities: An Approach to Statistical Analysis and Interpretation. 2nd ed. PRIMEROE Ltd., Plymouth
Marine Laboratory, Plymouth, United Kingdom. 2001. 172 p.
DESIKACHARY, T. V. Atlas of Diatoms. Madras Science Foundation, Madras, 1989. p. 809.
DESIKACHARY, T. V. Cyanophyta. Indian Council of Agricultural Research, New Delhi, 1959.p. 686. DEVASSY, V. P.; GOES, J. I. Phytoplankton community
structure and succession in a tropical estuarine complex (Central west coast of India). Estuar. Coast. Shelf. Sci., v. 27, p. 671-685, 1988.
DUARTE, P.; MACEDO, M. F.; DA FONSECA, L. C. The relationship between phytoplankton diversity and community function in a coastal lagoon. Hydrobiologia, v. 555, p. 3-18, 2006.
RAJASHEKHAR AND RAI: SEASONAL STUDY ON HYDRO-BIOLOGICAL VARIABLES 289
FLODER, S.; URABE, J.; KAWABATA, Z.The influence of fluctuating light intensities on species composition and diversity of natural phytoplankton communities. Oecologia, v. 133, p. 395-401, 2002.
FORSBERG, C. Limnological research can improve and reduce the cost of monitoring and control of water quality, Hydrobiologia, v. 86, p. 143-146, 1982. GARG, R. K.; SAKSENA, D. N.; RAO, R. J. Assessment of
physico-chemical water quality of Harsi reservoir, district Gwalior, Madhya Pradesh. J. Ecophysiol. Occup. Health,v. 6, p. 33-40, 2006.
GLIGORA, M.; MORAJ, A. P.; KRALJ, K.; GRIGORSZKY, I.; PUCAR, D. P.The relationship between phytoplankton species dominance and environmental variables in a shallow lake (Lake Vrana, Croatia). Hydrobiologia, v. 584, p. 337-346, 2007. GOVINDASAMY, C.; KANNAN, L.; AZARIAH, J.
Seasonal variation in physico-chemical properties and primary production in the coastal water biotopes of Coromandel Coast, India. J. Environ. Biol., v. 21, p. 1-7, 2000.
GRANT, G. M.; GROSS, E. Oceanography-A View of the Earth. Prentice-Hall, USA, 1966. p. 472.
GRASSHOFF, K.; EHRHARROT, M.; KREMLING, K. Methods for Seawater Analysis. Verlag. Chemic. Weinheim, 1983.p. 419.
HAMED, A. F. Biodiversity and distribution of blue-green algae/cyanobacteria and diatoms in some of the Egyptian water habitats in relation to conductivity. Aust. J. Basic Appl. Sci., v. 2, p. 1-21, 2008.
HARNSTROM, K.; KARUNASAGAR, I.; GODHE, A. Phytoplankton species assemblages and their relationship to hydrographic factors – a study at the old port in Mangalore, coastal Arabian Sea. Indian J. Mar. Sci., v. 38, p. 224-234, 2009.
HEN, C. Y.; DURBIN, E. G. Effect of pH on the growth and carbon uptake of marine phytoplankton. Mar. Ecol. Prog. Ser. v. 190, p. 83-94, 1994.
ILANGOVAN, G. A comparative study on species diversity, distribution and ecology of the dinophyceae from Vellar estuary and nearby Bay of Bengal. J. Mar. Biol. Assoc. India, v. 29, p. 280-285, 1987.
ILYASH, L. V.; MATORIN, D. N. Features of the spatial distribution of phytoplankton in Nhatrang Bay of the South China Sea during the rainy season. Oceanology, v. 47, p. 788-796, 2007.
JAYAKUMAR, R.; SIRAZ, L. Factor analysis in hydrogeochemistry of coastal aquifers -preliminary study. Environ. Geol., v. 31, p. 174-177, 1997. JEFFREY, S. W.; HUMPHREY, G. F.New
spectrophotometric equations for determining chlorophylls a, b, c1 and c2 in higher plants, algae and
natural phytoplankton. Biochem. Physiol. Pflanzen., v. 167, p. 191-194, 1975.
KALAIARASI, M.; PAUL, P.; LATHASUMATHI, C.; STELLA, C. Seasonal variations in the physico-chemical characteristics of the two coastal waters of Palk-Strait in Tamil Nadu, India.Global J. Environ. Res., v. 6, p. 66-74, 2012.
KALIMURTHY, M. Observations on the transparency of the waters of the Pulicat lake with particular reference to plankton production. Hydrobiologia, v. 41, p. 3-11, 1973.
KAMALKANTH, S.; MUNIYAN, M.; CHRISTYPONNI, A. Seasonal variations in physico-chemical parameters at Tranquebar Coastal Nagapattinam, Tamilnadu. India. Int. J. Environ. Biol., v. 2, p. 203-207, 2012.
KANNAN, R.; KANNAN, L. Physiochemical characteristic of seaweed beds of the Palk bay, South East coast of India. Indian J. Mar. Sci., v. 25, p. 358-362, 1996. KATHIRAVAN, T.; SUNDARAMANICKAM, A.;
VARADHARAJAN,.D.; BALASUBRAMANIAN, T. Seasonal variations in physico-chemical parameters of Parangipettai coast, South east coast of India. Int. J. Pharm. Biol. Arch., v. 4, p. 240-249, 2013.
KUMAR, J. I.; GEORGE, B.; KUMAR, R. N.; SAJISH, P. R.; VIYOL, S. Assessment of spatial and temporal fluctuations in water quality of a tropical permanent estuarine system – Tapi, West coast of India. Appl. Ecol. Environ. Res., v. 7, p. 267-276, 2009.
LESTER, W. F. Polluted river, river trent, England. In: WHITION, B. A. (Ed.). River Ecology, Blackwen Scientific Publications, London. 1975. 489-513 p. LIN, H. J.; WANG, T. C.; SU, H. M.; HUNG, J. J. Relative
importance of phytoplankton and periphyton on oyster-culture pens in a eutrophic tropical lagoon. Aquaoyster-culture, v. 243, p. 279-290, 2005.
LISS, P. S.; SPENCER, C. P.A biological process in the removal of silicate from seawater. Geochim. Cosmochim. Ac., v. 34, p. 1073-1088, 1970.
LONGHURST, A.; SATHYENDRANATH, S.; PLATT, T.; CAVERHILL, C.An estimate of global primary production in the ocean from satellite radiometer data.J. Plankton Res., v. 17, p. 1245-1271, 1995.
ARCHILLA, A. I.; MOREIRA, D.; LOPEZ-GARCIA, P.; GUERRERO, C. Phytoplankton diversity and cyanobacterial dominance in a hypereutrophic shallow lake with biologically produced alkaline pH. Extremophiles,v. 8, p. 109-115, 2004.
LOUCKS, O. L. Evolution of diversity, efficiency and community stability. Am. Zool., v. 10, p. 17-25, 1970. LUCKINBILL, L. S. Coexistence in laboratory populations
of Paramecium aurelia and its predator Didinium nasutum. Ecology,v. 54, p. 1320-1327, 1973.
MADHUPRATAP, M.; NAIR, K. N. V.; GOPALAKRISHNAN, T. C.; HARIDAS, P.; NAIR, K. K. C.; VENUGOPAL, P.; GAUNS, M. Arabian sea oceanography and fisheries off the West coast of India. Curr. Sci., v. 81, p. 355-361, 2001.
MARGALEF, R. Diversity. In: SOURNIA, A. (Ed.), Phytoplankton Manual, UNESCO, Paris, 1978. 251-260 p.
MARGALEF, R. Temporal succession and spatial heterogeneity in phytoplankton. In: BUZZATI-TRAVERSO. (Ed.). Perspectives in Marine Biology. University of California Press, Berkeley, 1958. 323-347 p.
MCLUSKY, D. S. The Estuarine Ecosystem.2nd ed.
Chapman and Hall, New York. 1989. 214 p.
MENON, N. N.; BALCHAND, A. N.; MENON, N.R. Hydrobiology of the Cochin backwater system – a review. Hydrobiologia, v. 430, p. 149-183, 2000. MITBAVKAR, S.; ANIL, A. C. Seasonal variations in the
288 BRAZILIAN JOURNAL OF OCEANOGRAPHY, 62(4), 2014
MURALEEDHARAN, H.; ABHILASH; RAMASUBBU, R. Physio-chemical parameters and planktons analysis of sea water of Thondi of Palk Bay, Tamil nadu. J. Biosci. Res., v. 1, p. 20-24, 2010.
MURTHY, A. S.; RAO, M. G. S.; SHARMA, G. S. Current structure in the upper layers of the Arabian sea during southwest monsoon. Indian J. Agar. Sci., v..11, p. 1-6, 1982.
NIXON, S. W. Physical energy inputs and the comparative ecology of lake and marine ecosystems. Limnol. Oceanogr., v. 33, p. 1005-1025, 1988.
PANDA, S. S.; DHAL, N. K.; PANDA, C. R. Phytoplankton diversity in response to abiotic factors along Orissa coast, Bay of Bengal. Int. J. Environ. Sci., v. 2, p. 1818-1832, 2012.
PARIKH, A.; VISHAL SHAH, V.; MADAMWAR, D. Cyanobacterial flora from polluted marine shores. Environ. Monit. Assess., v. 120, p. 407–414, 2006. PERUMAL, N. V.; RAJKUMAR, M.; PERUMAL, P.;
RAJASEKAR, K. T. Seasonal variations of plankton diversity in the Kaduviyar estuary, Nagapattinam, South east coast of India. J. Environ. Biol., v. 30, p. 1035 -1046, 2009.
PIELOU, E. C. Species diversity and pattern diversity in the study of ecological succesion. J. Theor. Biol., v. 10, p. 370-383, 1966.
PILLAI, V. N.; PILLAI, V. K.; GOPINATHAN, C. P.; NANDAKUMAR, A. Seasonal variations in the physico-chemical and biological characteristics of the eastern Arabian Sea. J. Mar. Biol. Ass. India, v. 42, p. 1-20, 2000.
POLAT, S.; SARIHAN, E.; KORAY, T. Seasonal changes in the phytoplankton of the northeastern Mediterranean (Bay of Iskenderun).Turk. J. Bot., v. 24, p. 887-906, 2000.
POMEROY, C. R.; SMITH, E. E.; GRANT, C. M.The exchange of phosphate between estuarine water and sediments. Limnol. Oceanogr.,v. 10, p. 167-172, 1965. PURUSHOTHAMAN, A.; VENUGOPALAN, V. K.
Distribution of dissolved silicon in the Vellar estuary. Indian J. Mar. Sci., v. 1, p. 103-105, 1972.
PUTHIYA S. C.; POONGOTHAI, S.; NEELAKANTAN, M. A. Impact of industrial pollution on the physico-chemical characteristics of sea water in Thoothukudi coastal area. Rasayan J. Chem., v. 2, p. 912-919, 2009.
RAINA, U.; SHAH, A. R.; AHAMAD, S. R. Pollution studies on river Jhelum: an assessment of water quality. Indian J. Environ. Health, v. 26, v.107-120, 1984. RAJASEGAR, M. Physico-chemical characteristics of the
Velar estuary in relation to shrimp farming. J. Environ. Biol., v. 24, p. 95-101, 2003.
RAJASEKAR, K. T.; RAJKUMAR, M.; JUN, S.; PRABU, A.; PERUMAL, P. Seasonal variations of phytoplankton diversity in the Coleroon coastal waters, Southeast coast of India. Acta Oceanol. Sin., v. 29, p. 97-108, 2010. RAJESHWARI, K. R.; RAJASHEKHAR, M. Diversity of
cyanobacteria in some polluted aquatic habitats and a sulfur spring in the Western Ghats of India. Algol. Stud., v. 138, p. 37-56, 2012.
RAMAMURTHY, S. Studies on the plankton of the North Kanara coast in relation to the pelagic fishery. J. Mar. biol. Ass. India, v. 7, p.127-149, 1965.
REDEKAR, P. D.; WAGH, A. B. Planktonic diatoms of the Zuari estuary, Goa (West coast of India). Seaweed Res. Utilin., v. 22, p. 107-112, 2000.
ROCHFORD, D. J. Studies in Australian estuarine hydrology, Introductory and comparative features. Aust. J. Mar. Fresh. Res., v. 2, p. 1-116, 1951.
ROELKE, D. L.; ELDRIDGE, P. M.; CIFUENTES, L. A. A model of phytoplankton competition for limiting and nonlimiting nutrients: implications for development of estuarine and nearshore management schemes. Estuaries, v. 22, p. 92-104, 1999.
SAHU, G.; SATPATHY, K. K.; MOHANTY, A. K.; SARKAR, S. K. Variations in community structure of phytoplankton in relation to physico-chemical properties of coastal waters, Southeast coast of India. Indian J. Mar. Sci., v. 41, p. 223-241, 2012.
SAKSHAUGH, E.; BRICAUD, A.; DANDONNEAU, Y.; FALKOWSKI, P. G.; KIEFER, D. A.; LEGENDRE, L.; MOREL, A.; PARSLOW, J.; TAKAHASHI, M. Parameters of photosynthesis – definitions, theory and interpretation of results. J. Plankton Res., v. 19, p.1637-1670, 1997.
SATHEESHKUMAR, P.; KHAN, B. A. Seasonal variations in physico-chemical parameters of water and sediment characteristics of Pondicherry mangroves. Afr. J. Basic Appl. Sci., v. 1, p. 36-43, 2009.
SATPATHY, K. K. Seasonal distribution of nutrients in the coastal water of Kalpakkam, East coast of India.Indian J. Mar. Sci., v. 25, p. 221-224, 1996.
SATPATHY, K. K.; MOHANTY, A. K.; NATESAN, U.; PRASAD, M. V. R.; SARKAR, S. K. Seasonal variation in physico-chemical properties of coastal waters of Kalpakkam, East coast of India with special emphasis on nutrients. Environ. Monit. Assess., v. 164, p. 153-171, 2010.
SAWANT, S.; MADHUPRATAP, M. Seasonality and composition of phytoplankton in the Arabian Sea. Curr. Sci., v. 71, p. 869-873, 1996.
SELLNER, K. G. Physiology, ecology and toxic properties of marine cyanobacteria blooms. Limnol.Oceanogr., v. 42, p. 1089-1104, 1997.
SHANNON, C. E. A mathematical theory of communication.Bell Syst. Tech. J., v. 27, p. 379–423, 1948.
SHETYE, S. R.; GOUVEIA, A.; SHENOI, S. S. C.; SUNDAR, D.; MICHAEL, G. S.; ALMEIDA, A. M.; SANTHANAM, K. Hydrography and circulation off west coast of India during the southwest monsoon. J. Mar. Res. v. 48, p. 359-378, 1994.
SIMPSON, E. H. Measurement of diversity. Nature, v. 163, p. 683-688, 1949.
SIVASANKAR, R.; PADMAVATHI, G. Species composition, abundance and distribution of phytoplankton in the harbour areas and coastal waters of
Port Blair, South Andaman. Int. J. Oceanogr. Mar. Ecol. Sys., v. 1, p. 76-83, 2012.
SOMAN, M. K.; KRISHNAKUMAR, K.Some aspects of daily rainfall distribution over India during the South-west monsoon season. Int. J. Climatol. v. 10, p. 299-311, 1990.
RAJASHEKHAR AND RAI: SEASONAL STUDY ON HYDRO-BIOLOGICAL VARIABLES 289
SRIDHAR, R.; THANGARADJOU, T.; SENTHIL KUMAR, S.; KANNAN, L. Water quality and phytoplankton characteristics in the Palk Bay, Southeast coast of India. J. Environ. Biol., v. 27, p. 561-566, 2006.
STOWE, K. Exploring Ocean Science. John Wiley and Sons Inc., 1996.p. 426.
STRICKLAND, J. D. H.; PARSONS, T. R.A Practical Handbook of Seawater Analysis.2nd ed. Fisheries
Research Board of Canada, Ottawa. 1972. 310 p. SUSHANTH, V. R.; RAJASHEKHAR, M. Seasonal
variation in diatoms in response to physico-chemical characteristics of coastal waters of Uttara Kannada district, West Coast of India, Int. J. Environ. Sci., v. 2, p. 1543-1552, 2012.
SUSHANTH, V. R.; SHRUTHI, M. S.; RAJASHEKHAR, M. Seasonal variation in physico-chemical properties and phytoplankton in the coastal waters of Dakshina Kannada, Karnataka, The Ecoscan, v. 6, p. 189-194, 2011.
TAYLOR, F. J. R. General features of dinoflagellate material collected by the Anton Bruun during IIOE. In: ZEITZSCHEL, B. (Ed.). The Biology of the Indian Ocean: Biological Studies, Springer Verlag, Berlin, 1973. 155-169 p.
THAJUDDIN, N.; SUBRAMANIAN, G. Cyanobacterial biodiversity and potential applications in biotechnology, Curr. Sci., v. 89, p. 47-57, 2005.
TOMAS, C. Identifying Marine Phytoplankton. Academic Press, San Diego, 1997. p. 856.
TOULIABAH, H.; SAFIK, H. M.; GAB-ALLAH, M. M.; TAYLOR, W. D. Phytoplankton and some abiotic features of El-Bardawil lake, Sinai, Egypt. Afr. J. Aquat. Sci., v. 27, p. 97-105, 2002.
WETSTEYN, L. P. M. J.; KROMKAMP, J. C. Turbidity, nutrients and phytoplankton primary production in the Oosterschelde (the Netherlands) before, during and after a large-scale coastal engineering project (1980–1990): structure and functioning of the pelagic system. Hydrobiologia, v. 282, p. 61-78, 1994.
WOLFHARD, S.; REINHARD, B.The heterogeneity of runoff and its significance for water quality problems. Hydrol. Sci. J., v. 43, p. 103-113, 1998.
YOO, K. I. Population dynamics of dinoflagellate community in Masan bay with a note on the impact of environmental parameters. Mar. Poll. Bull., v. 23, p. 185-188, 1991. ZEPP, R. G. Interactions of marine biogeochemical cycles
and the photodegradation of dissolved organic carbon and dissolved organic nitrogen. In: GIANGUZZA, A.; PELIZZETTI, E.; SAMMARKANO, S. (Eds.). Marine Chemistry, Kulwer, London, 1997. 329-352 p.