Article
J. Braz. Chem. Soc., Vol. 26, No. 3, 490-497, 2015. Printed in Brazil - ©2015 Sociedade Brasileira de Química 0103 - 5053 $6.00+0.00
A
*e-mail: [email protected]
Cadmium and Lead Determination in Freshwater and Hemodialysis Solutions by
Thermospray Flame Furnace Atomic Absorption Spectrometry Following Cloud
Point Extraction
Samara Garcia,a Fabiana Gerondi,b Thiago R. L. C. Paixão,c Marco A. Z. Arrudab and Ivanise Gaubeur*,a
aCentro de Ciências Naturais e Humanas, Universidade Federal do ABC,
Av. dos Estados, 5001, 09210-971 Santo André-SP, Brazil
bDepartamento de Química Analítica, Instituto de Química, Universidade Estadual de Campinas,
Rua Monteiro Lobato, s/n, 13082-970 Campinas-SP, Brazil
cDepartamento de Química Fundamental, Instituto de Química, Universidade de São Paulo,
Av. Prof. Lineu Prestes 748, 05508-000 São Paulo-SP, Brazil
Cloud point extraction was employed for the separation and preconcentration of cadmium and lead prior to the determination by thermospray flame atomic absorption spectrometry. Di-2-pyridyl ketone salicyloylhydrazone (DPKSH) was used as complexing agent and the cadmium and lead complexes were extracted from the aqueous phase by the Triton X-114 surfactant. The variables associated with the preconcentration (pH as well as DPKSH, surfactant and electrolyte concentration) were optimized by using a full factorial design with two levels, four variables and a central composite. Under the optimized conditions, a sample volume of 100 µL was introduced into a hot Ti tube at a flow rate of 0.6 mL min−1 and the integrated absorbance was measured. Calibration curves were obtained with linear ranges of 0.075-2.0 µg L−1 (Cd) and 2.5-100 µg L−1 (Pb). The
detection limits of 0.04 µg L−1 (Cd) and 1.3 µg L−1 (Pb) (99.7% confidence level) were obtained.
The proposed method was applied to hemodialysis solutions and water samples. The accuracy of the method was evaluated by analyzing a certified reference material (NIST CRM 1643e) and the results were in agreement with the certified values at a 95% confidence level according to t-test.
Keywords: cloud point extraction, cadmium, lead, DPKSH, TS-FF-AAS
Introduction
Even at very low concentrations, cadmium is highly
toxic, causing damage to the kidneys, liver and lungs.1,2
Anthropogenic contamination source of soil, air and water results from the production of cadmium from the burning of oil and coal, as well as from waste incineration. Exposure to cadmium by means of the ingestion of contaminated water and soil, inhalation of contaminated dust, or smoking habits of cigarettes, for instance, may result in a variety of
harmful effects to health.3,4 The National Environmental
Council-Brazil (CONAMA)5 resolution 357 in 2005 and
World Health Organization (WHO)6 in 2008 established
maximum limits of 1 µg L−1 and 3 µg L−1, respectively, for
cadmium in natural waters.
Lead is particularly used for the production of lead-acid
batteries, solder and alloys.6 Tetraethyl and tetramethyl lead
have also been used as antiknock and lubricating agents in petrol. However, the use of such compounds for these
purposes is being phased out in some countries.6,7 Due to
the reduced use of lead containing additives in gasoline and lead-containing solder in the food processing industry, the concentration levels of lead in air and food are dropping, and the lead intake from drinking water constitutes a greater proportion of the total intake. This element can affect
the development of children’s intelligence.6,8 CONAMA
resolution 357 and WHO established a maximum limit of
10 µg L−1 for lead ions in natural waters.5,6
The determination of potentially toxic metals such as cadmium, copper, lead, zinc, and others has been investigated
in hemodialysis solutions,9-11 although aluminum has been
considered to be responsible for causing major problems
Contamination with chemicals, bacteria or toxins from the water used to prepare the solution for hemodialysis has been considered the main risk factor for injury and
the death of patients under this treatment.13 However,
commercially available concentrated saline, which is mixed for hemodialysis, may have traces of potentially toxic metals making it an important source of contamination.
Lead and cadmium are two of the most dangerous elements to human health and their concentrations in samples are generally low. Therefore, analytical techniques with high sensitivity for the simultaneous determination of both are necessary. Procedures for extraction and preconcentration, in addition to increasing detectability, eliminate or minimize the sample matrix effect, such as the hemodialysis solutions that have high salt concentration leading serious interference in the
simultaneous determination of these metals.11
Cloud point extraction (CPE) is an environmentally friendly alternative sample pretreatment method for separation and preconcentration. CPE has been used for enhancing the sensitivity in organic and inorganic analyses, and it can be applied for the extraction of analytes from environmental and biological samples with complex matrixes. For the determination of metals, a reaction with a hydrophobic complexing agent is usually required. Many ligands have been used in CPE, and among others,
pyridylazo and thiazolylazo stand out.14 Galbeiro et al.,15
using Triton X-114 [(1,1,3,3-tetramethylbutyl) phenyl-polyethylene glycol] as the surfactant and 1-(2-pyridilazo)-2-naphthol (PAN) as a complexing agent in CPE developed a method for the selective preconcentration of trace amounts of Cd, Ni and Zn by flame atomic absorption spectrometry (FAAS). Using Triton X-114 and di-2-pyridyl ketone salicyloylhydrazone (DPKSH) as the surfactant and
complexing agent, respectively, Garcia et al.16 developed a
method for the selective preconcentration of trace amounts of Ni by atomic and molecular spectrometric methods. Due to certain characteristics such as low cloud point temperature, low cost and low toxicity, Triton X-114 has been broadly used in CPE procedures for the extraction of
hydrophobic complexes.14,17 The evaluation of the pH value,
so important in the stage where hydrophobic complexes are formed, and the addition of an electrolyte, which in many cases allows the elimination of the heating step making it fastest procedure, are other variables to consider in the efficiency of the CPE procedure.
Owing to its robustness, selectivity and low running costs when compared to electrothermal atomic absorption spectrometry (ETAAS) and inductively coupled plasma mass spectrometry (ICP-MS), FAAS is widely used
for the routine determination of elements at the mg L−1
concentration range.18 However, FAAS detection limits are
incompatible with determination at sub-µg L−1 levels.19 A
means of increasing the sensitivity of the technique is the thermospray flame furnace atomic absorption spectrometry
(TS-FF-AAS), developed by Gáspár and Berndt in 2000,20
which improved the sensitivity of FAAS by increasing the
efficiency of the aerosol generation.18,21 The association
of CPE procedures and TS-FF-AAS has been used in the
direct determination of some metals in liquid samples.19,22-24
In this context, the aim of this work was, on one hand, to propose a CPE method based on the use of Triton X-114 for extraction of Cd and Pb as DPKSH complexes and, on the other hand, to evaluate the combination of the proposed CPE procedure with TS-FF-AAS (i.e., CPE-TS-FF-AAS) for trace elemental analysis. To this end, the main experimental factors affecting the CPE were optimized using a multivariate analysis. Under optimum CPE conditions, analytical figures of merit of CPE-TS-FF-AAS method were estimated. Accuracy of the proposed method was evaluated from the analysis of Certified Reference Material (drinking water). Finally, freshwater and hemodialysis solutions were analyzed in order to assess the applicability of the methods to real samples analysis.
Experimental
Instrumentation
A pH meter model 713 Metrohm (Herisau, Switzerland) with a combined glass electrode was used for the pH measurements, and a Quimis Q222TM (São Paulo, Brazil) centrifuge was used to accelerate the phase separation.
Analytical signals were obtained using a ContrAA 300 high-resolution continuum source flame atomic absorption spectrometer (HR-CS FAAS Analytik Jena AG, Jena, Germany) equipped with xenon lamp continuum radiation source short-arc (XBO 301, 300 W, GLE, Berlin, Germany) operating in a hot-spot mode. Measurements were carried out at 228.80 nm and 217.00 nm, the principal lines, for Cd and Pb, respectively. A high-resolution double-echelle grating monochromator supplies a
spectral bandwidth 2 pm per pixel. The other operational
instrumental conditions were air flow rate 490 (L min−1),
acetylene flow rate 55 and 65 (L min−1), for Cd and Pb
respectively, and burner height 13 mm.
A system comprised of a peristaltic pump (Ismatec, Labortechnik Analytik, Glattbrugg-Zürich, Switzerland)
furnished with Tygon® tubes coupled with a sliding-bar
injector-commutator, and a thermospray flame furnace unit,
consisting of a ceramic Al2O3 capillary (0.5 mm i.d., 2.0 mm
and a Ti tube25,26 (10 mm i.d., 12 mm o.d., 100 mm in
length) was used for the TS-FF-AAS determinations. The tube was located on the burner, laid on a lab-made stainless steel support and could be moved in and out of the flame. To reach the proper atomization temperature for Cd and Pb inside the tube, six 2-mm diameter holes were drilled in the
bottom of the tube.23,24 Another hole was drilled at 90° to the
bottom holes to insert the ceramic Al2O3 capillary, which
was set approximately 1 mm inside the tube furnace. The manifold was assembled with 0.5-mm i.d. PTFE tubing.
Reagents and solutions
All of the solutions were prepared with analytical grade chemicals and deionized water. DPKSH was synthesized
according to a procedure reported in a previous paper,27
and a 0.01 mol L−1 DPKSH stock solution was prepared
by dissolving the appropriate amounts of the reagent in anhydrous ethanol (Carlo Erba, Milan, Italy). Solutions of the nonionic surfactant Triton X-114 (Sigma, St. Louis, MO, USA) were prepared at a 5% (m/v) concentration. The NaCl solution (Merck, Darmstadt, Germany) was prepared at a 25% (m/v) concentration. Buffer solutions
CH3COONH4, pH values of 6.0 and 7.0; (OHCH2)3CNH2/
(OHCH2)3CNH3+ (Tris/HTris+), pH values of 8.0 and 8.3
and NH4Cl/NH4OH, pH values of 9.0 and 10 were used
for pH adjustment. Cadmium and lead analytical solutions
were prepared by suitable dilutions of a 1000 mg L−1 stock
solution (Ultra Scientific, USA).
Samples
Freshwater samples were collected from the Billings dam, São Paulo, Brazil. The sample collection was carried out in different locations and depths. Sample A was collect on the surface and sample B was collect at a depth of 5 m. All of the samples were acidified to a pH 2.0 with nitric acid, immediately after sampling, and were filtered with 0.25 µm cellulose acetate membranes. The hemodialysis solutions were prepared according to a procedure
previously described.28
For the evaluation of the accuracy of the method, a certified reference material (CRM) of water (NIST 1643e Trace Elements in Water), supplied by the National Institute of Standards and Technology (Gaithersburg, MD, USA) was used.
Cloud point extraction procedure
Different amounts of the samples or standard solutions,
990 µL of 5% m/v Triton X-114, 506 µL of 0.01 mol L−1
DPKSH, 500 µL of Tris/HTris+ buffer (pH 8.3) and 3.6 mL
of 25% m/v NaCl were transferred to 15 mL graduated tubes, which were filled with deionized water. The mixture was centrifuged (840 × g) for 20 min to induce phase separation by centrifugation. The aqueous phase was removed with a Pasteur pipette, and to decrease its viscosity, the surfactant-rich phase was diluted with a mixture
of ethanol and 0.1 mol L−1 HNO
3 to 1000 µL. Sample
introduction was performed by using a monosegmented flow injection system.
A blank solution obtained by the same procedure described above was measured before to the samples or standard aqueous solutions.
Optimization procedure for the Cd and Pb cloud point extraction
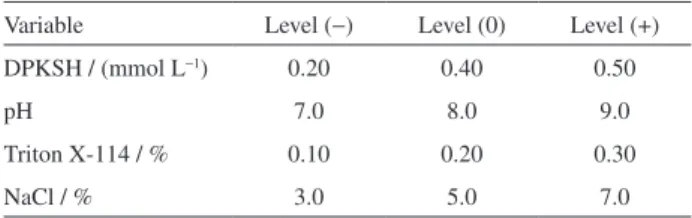
To evaluate the significance of the variables of the CPE preconcentration procedure, a full factorial design with two levels, four variables and central composite (27 experiments, 3 replicates for the central point) was carried out. Additionally, with the aim of determining a critical point, a quadratic model was used to describe the system studied. The variables optimized in the design were the pH as well as the DPKSH, Triton X-114 and NaCl concentrations. The
Statistica 10® program (StatSoft Inc., USA) was used for
evaluating the experimental data obtained. Table 1 shows the factors studied and their respective levels, and Table S1 [see Supplementary Information (SI) section] shows the full factorial design matrix.
Optimization of the sample introduction
A monosegmented flow system,29 Figure 1, was used
to prevent dispersion of the sample aliquot solution. In this system, sample loop was filled up via syringe aspiration. Water, used as carrier, passed through the injector-commutator valve and proceeded to the ceramic capillary, while the propulsion of air filled up two side loops. The injector-commutator valve was commuted and the sample was placed between two air bubbles, being propelled by peristaltic pump, reaching the ceramic tube, and then the titanium tube, where thermospray was
Table 1. Variables and levels evaluated using the 24 factorial design
Variable Level (−) Level (0) Level (+) DPKSH / (mmol L−1) 0.20 0.40 0.50
pH 7.0 8.0 9.0
Triton X-114 / % 0.10 0.20 0.30
formed. By using HR-CS FAAS, which allows changing wavelength within a short period of time, the detection of analytes was sequential, and a sample aliquot was added to detect cadmium and then another sample aliquot to detect lead.
In TS-FF-AAS development methods, there are some inherent sample introduction and chemical parameters to be optimized. For this reason, sample volume and flow rate, as well as type of eluent and acid added to the rich phase were evaluated.
Results and Discussion
Optimization of the CPE procedure
To find the optimal conditions for the CPE procedure for Cd and Pb, the factors that affect the complexation and extraction procedure, such as the pH as well as the Triton X-114, DPKSH and NaCl concentrations, were
evaluated by a 24 full factorial design (Tables 1 and S1).
The concentrations of Cd and Pb used in each experiment
were 1.3 µg L−1 and 25 µg L−1, respectively. The significance
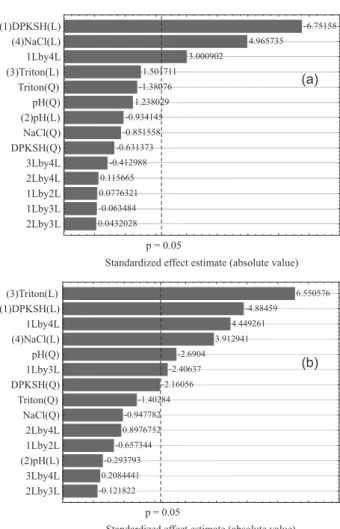
of the effects of the variables and possible interactions between them were checked based on Pareto charts (Figure 2) at a 95% significance level.
According to the Pareto chart (Figure 2a), a higher efficiency of the CPE procedure or the analytical responses can be achieved by decreasing the DPKSH concentration and increasing the NaCl concentration, indicating that the DPKSH and NaCl concentrations were significant for cadmium complexation and extraction. Notwithstanding, it was necessary to increase the Triton X-114 concentration, decrease the DPKSH concentration and increase the NaCl concentration to achieve the best conditions for lead complexation and extraction (Figure 2b). The interactions between most of the factors were also significant, as estimated from the significance value (95%) of the interactions of various factors.
The DPKSH concentration added must be enough to ensure the quantitative complexation of analytes. Generally, adding excess is necessary, ensuring a sufficient quantity for
the complexation of subject analytes even in the presence of interfering species. However, the excess must be controlled to avoid that complexes and complexing agent compete for
surfactant micelles in the extraction phase.15,16
The electrolyte concentration is an important parameter in CPE. Adding electrolytes will result in dehydration of surfactant hydrophobic chains, thus enhancing interaction between micelles and consequently allowing the phase separation of analyte at room temperature or lower
temperatures.23,30
Another important parameter in the cloud point extraction for the preconcentration of metal complexes is the surfactant concentration. Accuracy, precision and sensitivity can be affected if the surfactant concentration is not enough to guarantee a quantitative extraction [above the surfactant critical micellar concentration (CMC)]. However, the volume ratio of the phases should also be noted because an increase in the surfactant concentration can decrease the analytical signal due to the dilution of the analyte in the
surfactant-rich phase.16,31,32
Peristaltic pump (0.6 mL min-1)
Sample (rich phase diluted in
HNO3/EtOH )
Water
Air Ceramic capillary
(0.5 mm i.d., 2 mm o.d., 100 mm in length)
100 μL
Figure 1. Monosegmented flow system for cadmium and lead
determination.
0.0432028 -0.063484 0.0776321 0.115665
-0.412988 -0.631373
-0.851558 -0.934145
1.238029 -1.38076
1.501711 3.000902
4.965735
-6.75158
p = 0.05
Standardized effect estimate (absolute value) 2Lby3L
1Lby3L 1Lby2L 2Lby4L 3Lby4L DPKSH(Q) NaCl(Q) (2)pH(L) pH(Q) Triton(Q) (3)Triton(L) 1Lby4L (4)NaCl(L) (1)DPKSH(L)
-0.121822 0.2084441
-0.293793 -0.657344
0.8976752 -0.947782 -1.40284
-2.16056 -2.40637
-2.6904 3.912941
4.449261 -4.88459
6.550576
p = 0.05
Standardized effect estimate (absolute value) 2Lby3L
3Lby4L (2)pH(L) 1Lby2L 2Lby4L NaCl(Q) Triton(Q) DPKSH(Q) 1Lby3L pH(Q) (4)NaCl(L) 1Lby4L (1)DPKSH(L) (3)Triton(L)
(a)
(b)
Metal complexation with DPKSH is very dependent on the pH of the solution, as this complexing agent can attract a proton to its pyridine nitrogen atom in an acidic medium
(pK1 = 3.5 at 25 °C and can dissociate its o-hydroxy group
in a basic medium (pK2 = 6.85 at 25 °C).33 The efficiency
of the CPE procedure was not affected by the pH range evaluated in this study as reported in Figure 2a for the Cd quantification. However, for the Pb quantification, it is important to highlight a negative effect for variable pH indicating a more favorable complexation of the Pb ion with the neutral form of DPKSH, since DPKSH being predominantly in its neutral and deprotonated form at pH
values from 6.0 to 9.0.34 Based on this discussion and due
to the results obtained by the Pareto charts (Figures 2a and 2b), second-order polynomial regression equations 1 and 2 for Cd and Pb, respectively, were obtained to fit the experimental values from Table S1 (SI section).
AbsCd = 1.995 – 0.6772 DPKSH + 0.5011 NaCl + 0.3610
DPKSH × NaCl (1)
AbsPb = 1.356 – 0.2854 DPKSH − 0.16587 pH2 + 0.3851
Triton X-114 + 0.2301 NaCl – 0.1686 DPKSH × Triton
+ 0.3118 DPKSH × NaCl (2)
Tables S2 and S3 (SI section) show by ANOVA analysis for the models that the predicted models reasonably represented the experimental values. A p value for selected parameters of equations 1 and 2 confirmed that the models
were suitable for use in the current experiment. The R2
values of the predicted model for Cd and Pb were 0.89 and 0.91, respectively, indicating that the predicted models could explain 89% and 91% of the response variability.
Hence, it was possible to plot response curves,
Figures S1 and S2 (SI section), using Statistica 10®
software. Based on the response surface methodology and critical values, the following were considered as the
conditions: 3.4 × 10⁻⁴ mol L−1 DPKSH, pH 8.3, 0.33% (m/v)
Triton X-114 and 6% (m/v) NaCl.
Flow injection optimization
Sample flow rate
The carrier flow rate is directly related to the formation of the thermospray and, consequently, the efficiency of
the sample injection and atomization of the analyte.35
The range studied was 0.2-0.8 mL min−1. For cadmium
and lead, the analytical signal is the highest at a flow rate
of 0.6 mL min−1, due to slow arrival of the sample in the
titanium tube allowing adequate time for the promotion of adequate heat transfer, the formation of the thermospray,
and, consequently, the atomization of the analyte. However,
flow rates above 0.9 mL min−1 caused a leak in the ceramic
tube, preventing the use of higher flow rates. Therefore, the
flow rate of 0.6 mL min−1 was chosen.
Sample volume
The sample volume was studied throughout a range of 25 to 200 µL. The results showed an almost linear increase in the analytical signals for both of the analytes by increasing the sample volume to 100 µL. Because 100 µL of sample presents a significant analytical signal at low concentrations of the metals and low rich phase consumption for both of the analytes, this volume was chosen.
Type of acid and solvent used for rich phase dilution The type of solvent and acid added to the rich phase was studied. The solvent reduces the viscosity of the rich phase, and the acid improves the volatilization of the
analytes.36 The solvents studied were methanol, ethanol
and acetonitrile, and the acids studied were HNO3, H2SO4,
H3CCOOH (HAc) and HCl. The integrated absorbance
and standard deviation are shown in Figures 3a and 3b, for cadmium and lead, respectively.
For the cadmium determination (Figure 3a), rich phase dilution with nitric acid in an acetonitrile medium results in higher absorbance values, which can be explained by the lower viscosity of this solvent. In the determination of lead (Figure 3b), it was observed that rich phase dilution with nitric acid in an acetonitrile medium results in less intense analytical signals. Still in determining lead, it was noticed that the acetic acid and acetonitrile mixture exhibited a higher analytical signal, but with a high standard deviation. Furthermore, for both metals, similar signals were obtained with nitric acid in methanol and ethanol. Therefore, due to small differences in the analytical signals and the toxicity of acetonitrile and methanol, nitric acid in an ethanol medium
(0.1 mol L−1) was chosen as the dilution solution.
Analytical characteristics
Analytical curves were obtained in triplicate by the preconcentration of 15 mL of standard solutions
containing known Cd2+ and Pb2+ ions under the optimized
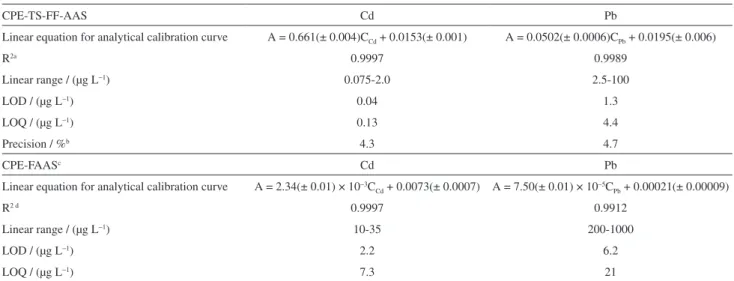
CPE conditions. Table 2 summarizes the analytical characteristics of the optimized procedure. The detection and quantification limits were estimated according to
IUPAC recommendations at the 99.7% confidence level.37
The relative standard deviations were estimated for 12
independent measurements with a 1.0 µg L−1 Cd(II) solution
and a 50 µg L−1 Pb(II) solution.
(Table 2), significant increases in the sensitivities of 282 and 669 times for Cd and Pb, respectively, were observed. These sensitivity increases allow the determination of cadmium and lead in samples such as natural waters, in which the
maximum limits established by WHO are 3 µg L−1 (Cd)
and 10 µg L−1 (Pb).5,6
Accuracy and determination of the cadmium and lead in dam water and hemodialysis solutions
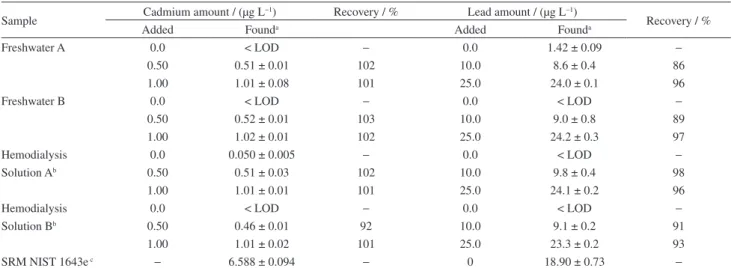
The accuracy of the method was assessed through the analysis of a water certified reference material
(CRM NIST 1643e). According to a t-test and a F-test
performed at a 95% confidence level, there is no difference between the determined and certified values, as shown in Table 3.
The developed procedure was applied to the determination of Cd and Pb in freshwater and hemodialysis solution samples. Different amounts of cadmium and lead were also spiked into the samples, and the resulting solutions were submitted to the CPE procedure. Recoveries ranging between 86 and 103% (Table 3) were obtained. It was found that for Pb in freshwater (sample A) and Cd in hemodialysis solution (sample A), the low values of the standard deviations of the measurements allow them to be considered acceptable; although such values are between the limit of quantification (LOQ) and limit of detection (LOD) of the proposed CPE procedure.
Table 4 shows a comparison of some analytical features with those attained in procedures for cadmium and lead determination after or not CPE procedure using FAAS and
TS-FF-AAS detection.19,22,23,38-40
HSO - MeOH
2 4
HSO - MeOH
2 4
HSO - EtOH
2 4
HSO - EtOH
2 4
HSO - ACN
2 4
HSO - ACN
2 4
HNO - MeOH
3
HNO - MeOH
3
HNO - EtOH
3
HNO - EtOH
3
HNO - ACN
3
HNO - ACN
3
HAc - MeOH
HAc - MeOH HAc - EtOH
HAc - EtOH HAc
-ACN
HAc -ACN
HCl - MeOH
HCl - MeOH HCl - EtOH
HCl - EtOH HCl
-ACN
HCl -ACN 0.000
0.100 0.200 0.300 0.400 0.500 0.600 0.700 0.800 0.900 1.000 1.100
1.200 (a)
Integrated absorbance
Acid-solvent mixture
0.000 0.500 1.000 1.500 2.000
2.500 (b)
Integrated absorbance
Acid-solvent mixture
Figure 3. Influence of the acid-solvent mixture to rich phase dilution on the analytical signal to (a) Cd and (b) Pb. Conditions: 0.5 µg L−1 Cd(II),
50 µg L−1 Pb(II), 3.4 × 10⁻⁴ mol L−1 DPKSH, Triton X-114 0.33% (m/v),
Tris/HTris+ buffer 0.055/0.033 mol L−1 (pH 8.3) and NaCl 6% (m/v).
Table 2. Analytical characteristics for Cd and Pb measurements by CPE-TS-FF-AAS and CPE-FAAS
CPE-TS-FF-AAS Cd Pb
Linear equation for analytical calibration curve A = 0.661(± 0.004)CCd + 0.0153(± 0.001) A = 0.0502(± 0.0006)CPb + 0.0195(± 0.006)
R2a 0.9997 0.9989
Linear range / (µg L−1) 0.075-2.0 2.5-100
LOD / (µg L−1) 0.04 1.3
LOQ / (µg L−1) 0.13 4.4
Precision / %b 4.3 4.7
CPE-FAASc Cd Pb
Linear equation for analytical calibration curve A = 2.34(± 0.01) × 10−3C
Cd + 0.0073(± 0.0007) A = 7.50(± 0.01) × 10−5CPb + 0.00021(± 0.00009)
R2 d 0.9997 0.9912
Linear range / (µg L−1) 10-35 200-1000
LOD / (µg L−1) 2.2 6.2
LOQ / (µg L−1) 7.3 21
aNumber of calibration points, n = 8; brelative standard deviation, n = 12, Cd 1.0 µg L−1 and Pb 50 µg L−1; cafter CPE procedure and surfactant-rich phase
dilution the sample introduction, 150 µL, was performed by using a micro pipette tube coupled directly to the nebulizer of the ContrAA 300 spectrometer;
The proposed method displayed a lower detection limit when compared to other methods using the CPE procedure or TS-FF-AAS detection, showing some advantage by determining cadmium and lead via TS-FFAAS after cloud point extraction. In this work, the cloud point induction was done by adding an electrolyte, NaCl, eliminating the heating phase, increasing the analytical frequency. The complexing agent, DPKSH, used for the first time to develop the analytical method for determining cadmium and lead, shows fast complex formation with the subject analytes, different
from other complexing agents, such as PAN.15
Conclusions
The preconcentration and determination of Cd and Pb using DPKSH as the complexation agent for cloud point extraction presented interesting features. The proposed method has the advantages of the simultaneous CPE preconcentration of cadmium and lead ions with low reagent consumption (1.6 mg of DPKSH and 49.5 mg
of Triton X-114 per determination) and reduced waste
disposal. Optimization of the CPE method using a factorial design resulted in the determination of suitable extraction conditions, contributing to the development of a simple, rapid and sensitive procedure for the determination of
Cd and Pb at µg L−1 levels. Sample introduction using
a monosegmented system proved to be a good system to prevent leakage and sample contamination. The combination of CPE and TS-FF-AAS allowed for significant increases in sensitivity, 282 and 669 times for Cd and Pb, respectively, when compared to CPE-FAAS, allowing the proposed method to be applied for different samples with low concentrations of metals, such as natural waters and hemodialysis solutions among others.
Supplementary Information
Supplementary data (tables and three dimensional response surface figures) are available free of charge at http://jbcs.sbq.org.br as PDF file.
Table 4. Comparison of the proposed method with other methods procedures for cadmium and lead determination
Analyte Detection system Complexing agent Sample volume / mL
Cloud point
induction LOD / (µg L−1) Precision / % Reference
Cd; Pb FI-CPE TAN 15 NaCl 0.75; 4.5 1.6-3.2 38
Cd; Pb TS-FF-AAS − − − 1.8; 5.3 2.1; 2.6 39
Cd CPE-TS-FF-AAS APDC 10 Heatinga 0.04 2.9 22
Cd CPE-TS-FF-AAS PAN 7 NaCl 0.0178 4.1 23
Cd; Pb CPE-TS-FF-AAS Br-PADAP 10 Microwave oven 4.0; 13.0 / (µg kg−1) 3.1; 0.7 19
Cd; Pb CPE-TS-FF-AAS PAN 40 NaCl and heatinga 0.025; 0.43 6.1; 5.2 40
Cd; Pb CPE-TS-FF-AAS DPKSH 15 NaCl 0.04; 1.3 4.3; 4.7 This method
a40 oC, 10 min;FI-CPE: flow injection; TAN: 1-(2-thiazolylazo)-2-naphthol; APDC: ammonium pyrrolidinedithiocarbamate; PAN:
1-(2-pyridilazo)-2-naphthol; Br-PADAP: 2-(bromo-2-pyridylazo)-5-diethyl-amino-phenol; LOD: limit of detection.
Table 3. Mean values and uncertainties for cadmium and lead determination in different kind of samples
Sample Cadmium amount / (µg L
−1) Recovery / % Lead amount / (µg L−1)
Recovery / %
Added Founda Added Founda
Freshwater A 0.0 < LOD − 0.0 1.42 ± 0.09 −
0.50 0.51 ± 0.01 102 10.0 8.6 ± 0.4 86
1.00 1.01 ± 0.08 101 25.0 24.0 ± 0.1 96
Freshwater B 0.0 < LOD − 0.0 < LOD −
0.50 0.52 ± 0.01 103 10.0 9.0 ± 0.8 89
1.00 1.02 ± 0.01 102 25.0 24.2 ± 0.3 97
Hemodialysis 0.0 0.050 ± 0.005 − 0.0 < LOD −
Solution Ab 0.50 0.51 ± 0.03 102 10.0 9.8 ± 0.4 98
1.00 1.01 ± 0.01 101 25.0 24.1 ± 0.2 96
Hemodialysis 0.0 < LOD − 0.0 < LOD −
Solution Bb 0.50 0.46 ± 0.01 92 10.0 9.1 ± 0.2 91
1.00 1.01 ± 0.02 101 25.0 23.3 ± 0.2 93
SRM NIST 1643e c
− 6.588 ± 0.094 − 0 18.90 ± 0.73 −
aValue ± standard deviation, n = 3; bCd(II) and Pb(II) spiked to diluted hemodialysis concentrate (10%); ccertified value SRM NIST 1643e:
Acknowledgements
The authors acknowledge fellowships and financial support from the following Brazilian agencies: Coordenação de Aperfeiçoamento de Pessoal de Nível Superior (CAPES) and Fundação de Amparo à Pesquisa do Estado de São Paulo (FAPESP) 2011/19730-3. The authors also acknowledge monosegmented flow system suggestions of Professor Fábio Rodrigo P. Rocha (Centro de Energia Nuclear na Agricultura, Universidade de São Paulo).
References
1. Shimamura, T.; Iijima, S.; Hirayama, M.; Iwashita, M.; Akiyama, S.; Takaku, Y.; Yumoto, S.; J. Trace Elem. Med. Biol. 2013, 27, 12.
2. Maranhão, T. A.; Martendal, E.; Borges, D. L. G.; Carasek, E.; Welz, B.; Curtius, A. J.; Spectrochim. Acta, Part B2007,62,
1019.
3. Tavallali, H.; Boustani, F.; Yazdandoust, M.; Aalaei, M.; Tabandeh, M.; Environ. Monit. Assess.2013, 185, 4273. 4. Juhasz, A. L.; Weber, J.; Naidu, R.; Gancarz, D.; Rofe, A.;
Todor, D.; Smith, E.; Environ. Sci. Technol.2010,44, 5240. 5. Conselho Nacional do Meio Ambiente (CONAMA), Resolução
No. 357, http://www.mma.gov.br/port/conama/res/res05/ res35705.pdf, accessed in December 2014.
6. World Health Organization (WHO); Guidelines for Drinking-Water Quality, http://www.who.int/water_sanitation_health/
dwq/fulltext.pdf, accessed in December 2014.
7. Lemos, V. A.; Carvalho, A. L.; Environ. Monit. Assess.2010, 171, 255.
8. Er, C.; Senkal, F.; Yaman, M.; Food Chem. 2013,137, 55.
9. Colleoni, N.; Arrigo, G.; Gandini, E.; Corigliano, C.; D’Amico, G.; Am. J. Nephrol.1993,13, 198.
10. Bohrer, D.; Nascimento, P. C.; Guterres, M.; Trevisan, M.; Seibert, E.; Analyst1999,124,1345.
11. Nascimento, P. C.; Schneider, A. B.; Bohrer, D.; Carvalho, L. M.; Jost, C. L.; J. Braz. Chem. Soc.2011, 22, 820.
12. Navarro, J. A.; Granadillo, V. A.; Salgado, O.; Rodríguez-Iturbe, B.; Garcia, R.; Delling, G.; Romero, R. A.;
Clin. Chim. Acta1992, 211, 133.
13. Payne, G. M.; A Surveyor’s Perspective: Water Quality for Hemodialysis, Advancing Safety in Medical Technology, http://www.aami.org/publications/hh/Water.quality.Payne.pdf, accessed in December 2014.
14. Pytlakowska, K.; Kozik, V.; Dabioch, M.; Talanta2013,110,
202.
15. Galbeiro, R.; Garcia, S.; Gaubeur, I.; J. Trace Elem. Med. Biol. 2014, 28, 160.
16. Garcia, S.; Galbeiro, R.; Silva, S. G.; Nomura, C. S.; Rocha, F. R. P.; Gaubeur, I.; Anal. Methods2012, 4, 2429.
17. Mukherjee, P.; Padhan, S. K.; Dash, S.; Patel, S.; Mishra, B. K.;
Adv. Colloid Interface Sci.2011, 162, 59.
18. Miranda, K.; Dionísio, A. G. G.; Neto, O. D. P.; Gomes, M. S.; Pereira-Filho, E. R.; Microchem. J.2012, 100, 27.
19. Andrade, F. P.; Nascentes, C. C.; Costa, L. M.; J. Braz. Chem. Soc.2009, 20, 1460.
20. Gáspár, A.; Berndt, H.; Spectrochim. Acta, Part B2000, 55, 587.
21. Gerondi, F.; Arruda, M. A. Z.; Talanta2012, 97, 395. 22. Wu, P.; Zhang, Y.; Lv, Y.; Hou, X.; Spectrochim. Acta, Part B
2006, 61, 1310.
23. Rezende, H. C.; Nascentes, C. C.; Coelho, N. M. M.;
Microchem. J.2011, 97, 118.
24. Donati, G. L.; Nascentes, C. C.; Nogueira, A. R. A.; Arruda, M. A. Z.; Nóbrega, J. A.; Microchem. J. 2006, 82, 189. 25. Petrucelli, G. A.; Stocco, P. K.; Bueno, M. I. M. S.;
Pereira-Filho, E. R.; J. Anal. At. Spectrom. 2006, 21, 1298.
26. Gomes, M. S.; Pereira-Filho, E. R.; Microchem. J.2009, 93, 93.
27. Gaubeur, I.; Ávila-Terra, L. H. S.; Masini, J. C.; Suárez-Iha, M. E. V.; Anal. Sci.2007, 23, 1227.
28. Gonzáles, A. P. S.; Firmino, M. A.; Nomura, C. S.; Rocha, F. R. P.; Oliveira, P. V.; Gaubeur, I.; Anal. Chim. Acta2009, 636, 198.
29. Matos, G. D.; Arruda, M. A. Z.; Talanta2008, 76, 475.
30. Zain, N. N. M.; Bakar, N. K. A.; Mohamad, S.; Saleh, N. M.;
Spectrochim. Acta, Part A2014, 118, 1121.
31. Silva, S. G.; Oliveira, P. V.; Rocha, F. R. P.; J. Braz. Chem. Soc. 2010, 21, 234.
32. Paleologos, E. K.; Giokas, D. L.; Karayannis, M. I.; TrAC, Trends Anal. Chem.2005, 24, 426.
33. Garcia-Vargas, M.; Belizón, M.; Hernández-Artiga, M. P.; Martinez, C.; Pérez-Bustamante, J. A.; Appl. Spectrosc.1986, 7, 1058.
34. Garcia, S.; Gaubeur, I.; J. Braz. Chem. Soc.2011, 22, 501.
35. Brancalion, M. L.; Sabadini, E.; Arruda, M. A. Z.; Anal. Chem. 2007, 79, 6527.
36. Welz, B.; Sperling, M.; Resano, M.; Atomic Absorption Spectrometry, 3rd ed.; Wiley-VCH: Weinheim, Germany, 1999.
37. Committee, A. M.; Analyst1987,112, 199.
38. Silva, E. L.; Roldan, P. S.; J. Hazard. Mater.2009, 161, 142.
39. Schiavo, D.; Neira, J. Y.; Nóbrega, J. A.; Talanta2008, 76, 1113. 40. Coelho, L. M.; Bezerra, M. A.; Arruda, M. A. Z.; Bruns, R. E.;
Ferreira, L. S. C.; Sep. Sci. Technol.2008, 43, 815.
Submitted: August 25, 2014
Published online: January 20, 2015