Article
Printed in Brazil - ©2015 Sociedade Brasileira de Química 0103 - 5053 $6.00+0.00
A
*e-mail: [email protected], [email protected]
Investigation of the Interaction of 2-(2’-Hydroxyphenyl)-benzoxazoles and their
Derivatives with B-DNA by Docking and Molecular Dynamics
Fábio dos S. Grasel,* Tiago E. de Oliveira and Paulo A. Netz*
Instituto de Química, Universidade Federal do Rio Grande do Sul, Avenida Bento Gonçalves, 9500, 91501-970 Porto Alegre-RS, Brazil
In this work we carried out a study covering conformational analysis, docking calculations and molecular dynamics (MD) simulations of six excited state intramolecular proton transfer (ESIPT)-fluorescent 2-(2’-hydroxyphenyl)-benzoxazoles, interacting with the Dickerson-Drew (d(CGCGAATTCGCG)2) dodecamer in B-DNA conformation. In the analysis of the molecular docking calculations, the derivatives with the -NH2 group in the phenolic ring presented the most favorable interaction energies with the DNA, and the scores were even more favorable for the ligands containing the -NO2 group as substituent in the benzoxazolic ring. In the analysis of the MD simulations, the complexes showed stable interactions, with minimal induced structural distortions in the DNA, being the largest increase of the Rise parameter when the ligands were intercalated, and also the unwinding of Twist. During all simulations, the ligands showed stable interactions with the oligonucleotide, without denaturation. Considering these interactions and the peculiar photophysical properties of this class of molecules, they could be used as biological probes.
Keywords: benzazoles-derivatives, molecular docking, molecular dynamics, B-DNA
Introduction
Benzazoles belong to a class of molecules with interesting photophysical properties. The heterocyclic derivatives of the 2-(2’-hydroxyphenyl)benzoxazole show an intense fluorescence emission due to the phenomenon of excited state intramolecular proton transfer (ESIPT) with high Stokes shift (difference between the wavelength of maximum absorption and of maximum emission), and high thermal stability. They are widely used as synthetic materials to obtain new photoluminescent materials, including precursors: polymer matrices,1,2 silica,3,4
cellulosic compounds,5 fluorescent sensors6 and chemical
sensors.7
This class of molecules has, in addition to unique photophysical properties, also interesting pharmacological properties, such as: bactericidal activity,8 anti-inflammatory,9
anti-glycan,10 anticancer11,12 and antimicrobial.9,13,14
Elzahabi11 synthesized thirteen benzazole derivatives, new
potential anti-cancers agents, which were tested at the National Cancer Institute (NCI), USA, against sixty types of cancer cells. The new compounds showed moderate to high activity on a good percentage of ill cells. In recent
work, Zablotskaya et al.9 synthesized a series of new benzazoles derivatives and studied their anti-inflammatory and psychotropic activities in vivo and evaluated the cytotoxicity in vitro. These compounds showed sedative action, high anti-inflammatory activity having selective cytotoxic effects, and some of them show antimicrobial activity. In another study, Hussein et al.15 synthesized two Ln(III) 2-thioacetate benzothiazole complexes with europium or terbium and thioacetate benzothiazole acid. For these complexes, affinity for DNA, antimicrobial activity and cytotoxicity were studied. Based on a photophysical study, the authors concluded that the new compounds have high affinity for DNA. Additionally, they displayed antibacterial and antitumor activity, confirming the initial hypothesis of the authors.
The use of organic fluorescent probes in techniques of biochemistry and biophysics microscopy and fluorescence spectroscopy continues to increase.16 Due to its outstanding
sensitivity, the fluorescence probes replaced radioactive probes in many biochemical applications. Moreover, fluorescence has grown significantly in popularity as a tool to investigate the structure and dynamics of nucleic acids, proteins and other biological macromolecules.17-20
besides the technological advance to allow super-resolution images without precedent in biological systems.16
In the present work, we use computational methods to study the interactions of 2-(2’-hydroxyphenyl)-benzoxazoles derivatives as ligands with the Dickerson-Drew dodecamer d(CGCGAATTCGCG)2 in B-DNA form.
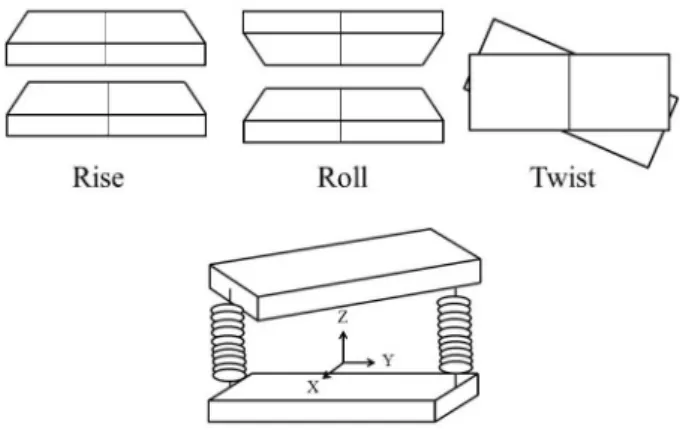
We studied the mechanism of interaction of the ligands with the DNA in the complexes, evaluating the interaction energies and investigating the structural stability, hydrogen bonds and some DNA structural parameters such as Rise, Roll and Twist (Figure 1). The employed methods ranged from quantum mechanical calculations and molecular docking to molecular dynamics simulations.
Methodology
Ligand building
Six 2-(2’-hydroxyphenyl)-benzoxazoles derivatives (Figure 2), which are ESIPT-fluorescent, were constructed using the GaussView program.23 As shown in Figure 2,
these compounds bear substituents of different electronic effects linked to the benzoxazole ring, some of them with an amine substituent linked to the 4’-position of the phenolic ring. The geometries were optimized with B3LYP DFT calculations using the 6-31G(d) basis set with the Gaussian98 program.24
The conformational analysis of the ligands was carried out performing a 180° rotation with increments of 10° around the bond between the phenolic and the oxazolic rings, also with B3LYP DFT calculations using the 6-31G(d) basis set. This choice of methods is shown in the literature25 to yield accurate estimates for geometries26 and
zero-point energies, failing only for optimization energies or for the description of van der Waals complexes.27 The
software used was Spartan ‘08, version 1.2.0,28 and the
continuum solvation model used to evaluate the effect of the solvent was SM8.29
Receptor building
The receptor used was a canonical DNA oligomer in the B-DNA form, generated using the X3DNA program22
with the same sequence of the Dickerson-Drew dodecamer, d(CGCGAATTCGCG)2.30 This oligomer was modified
with the same program, in order to obtain an artificial gap (ca. 6.5 Å) in the base-pair step AATT (the 5th and the 6th
base-pairs from the A strand 5’ extremity).31
Molecular docking
The docking calculations were performed with the AutoDock 4.2 program, with an empirical scoring function based on binding energy changes, using the stochastic algorithm Lamarckian genetic algorithm (LGA), which combines the genetic algorithm (global search algorithm) and the algorithm of Solis and Wets (local search algorithm). According to Huey et al.,32
AutoDock’s score function could be considered a free energy estimate, as it takes into account the enthalpic contributions due to the interactions and an entropic contribution related to the changes in the conformational degrees of freedom upon binding. Nevertheless, we will refer to this score function as “binding energy” or “interaction energy”, since there are more accurate methods to actually estimate free energies, but they are beyond the scope of the present work.
Using the program AutoDockTools (ADT) an affinity mesh with 96 × 96 × 110 points and a resolution of 0.375
Å was constructed.33 The receptor was placed in the center
of the affinity mesh and the affinity maps between the atoms of the ligand and the receptor were generated using the AutoGrid 4.0 module. The parameters used for the docking were 100 runs with 5 × 10⁷ energy assessments,
maximum number of 27000 generations, mutation factor of 0.02, crossing-over factor of 0.80, translational step of 0.2 Å, rotational step 5°, torsional step 5° and for the
Figure 1. Three selected parameters that describe DNA structure.
The base-pairs are shown schematically by solid rectangles linked by springs.21,22
Z
O N
HO
R1
R2
1a- R1= H, R2= NO2, Z = CH 1b- R1= H, R2= H, Z = N 1c- R1= H, R2= Me, Z = CH 2a- R1= NH2, R2= NO2, Z = CH 2b- R1= NH2, R2= H, Z = N 2c- R1= NH2, R2= Me, Z = CH
remaining parameters were used the default values.33 The
final conformations were classified in clusters according to the geometric similarity with a resolution of 2.0 Å and ranked based on the energy of interaction. Moreover, the clusters were also classified according to the type of interaction (minor groove or intercalation).
Molecular dynamics simulation
The choice of reliable starting structures for the molecular dynamics simulations is an important issue that has been discussed in the literature.34-36 The molecular
dynamics simulations were carried out using a simulation protocol that was already successfully applied to similar systems,37-39 such as oligonucleotides with ligands or
without ligands.
As starting structure for the molecular dynamics (MD) simulations we selected, for each ligand, two low energy conformations from the molecular docking: one complex where the ligand acts as an intercalator and the other one with the ligand interacting with the minor groove.37 The
interactions were described using the AMBER03 force field,40 the topology of the ligand was built using the
ACPYPE script.41 The complexes (receptor + ligand) were
placed in cubic boxes with a minimum distance between the solute molecule and the walls of 18 Å. Sodium counter ions were added and, after a vacuum position restrained simulation, the systems were solvated with TIP3P water molecules, and minimized using the steepest descent method. To simulate physiological conditions, ions of sodium and chloride (0.154 mol L−1) were added. After that,
a new simulation of 20 ps was carried out, using the full system, in which the initial positions of DNA and ligand were restrained. After these simulations, the systems were linearly heated by 5 ns of 50 K until 300 K, followed by further 20 ns NPT simulation at 310 K and 1 atm, with Parrinello-Rahman barostat (τp = 2 ps ) and Nose-Hoover
thermostat. For data analysis, modules GROMACS, X3DNA and homemade scripts were used.38 A MD
simulation was also carried out, with the same protocol as described above, but considering the oligonucleotide solvated under physiological conditions without ligand in order to obtain reference values for canonical B-DNA geometric parameters.
Molecular docking with the relaxed structure
After the molecular dynamics simulations, molecular docking calculations were performed using the same protocol described before, but using, as receptors, structures (snapshots) obtained after the 25 ns simulations, for each system.
Results and Discussion
Conformational analysis of the ligands
Derivatives of the 2-(2’-hydroxyphenyl)benzoxazole have a substantial torsional barrier around the bond between the phenolic ring and the oxazole ring. The origin of this barrier is the electronic dislocation between the two rings, giving a partial character of double bond between them. Additionally, there is also a contribution of an intramolecular hydrogen bond, as shown in Scheme 1. The strength of the interaction between a ligand and DNA, in the intercalation binding mode, is mainly related to the ligand’s planarity. The higher the value of the torsional barrier between the phenolic and oxazolic rings, the higher the rotational stability of the ligand. That results in a better planarity, leading to a favorable geometry for intercalation interaction with DNA.
On the other hand, the effect of the solvent should be taken into account.42-44 It is known that the strength of the
intramolecular hydrogen bond depends on the solvation. Protic polar solvents, such as water, tend to solvate the ligand through hydrogen bonds. The bigger the influence of the solvent, the lower the energy barrier for interconversion between rotamers due to weak intramolecular hydrogen bonding. In Figure 3, the cis-to-trans interconversion profiles are shown and the effect of the solvent for the ligands 1a and 2a.The profiles for the other ligands can be found in the Supplementary Information (SI) section.
The values of the interconversion barrier between the rotamers cis and trans (Table 1) were between 14.80 to 16.78 kcal mol−1 in vacuum and between 11.38 to
14.73 kcal mol−1 considering the effect of the solvent.
Analyzing the cis to trans interconversion barrier (Table 1), it is observed that there is a decrease of the solvent effect on the barrier from 3.1-3.8 kcal mol−1 for
O N R O NH2 7 O 5 N 4 R 1 2 3 O NH2 H H A B
Scheme 1. Schematic representation of the main canonical structures of ligands 2a, 2b and 2c.
ligands 1a, 1b and 1c to 2.1-3.0 kcal mol−1 for ligands
2a, 2b and 2c.Moreover, the group 2 ligands (R1 = NH2)
always have the biggest interconversion barriers and the smallest solvent effects.
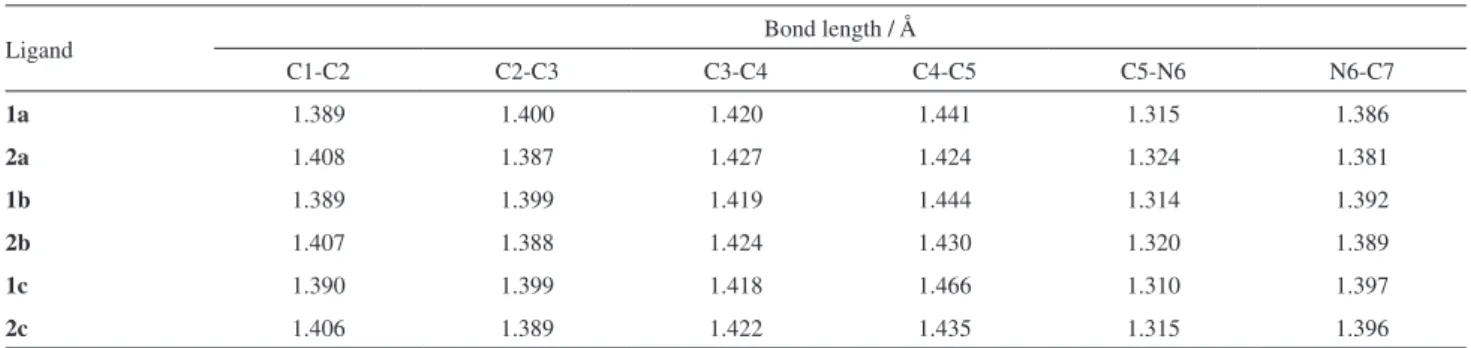
The interconversion barriers are smaller for the 1a, 1b and 1c ligands because they lack the amino group at the 4’-position of the phenolic ring, which is responsible for the increased basicity of the azole nitrogen, as already shown for the canonical form B in Scheme 1. This effect can be clearly observed considering the lengths of the bonds, according to Table 2.
As shown in Table 2, the presence of the amino group enhances the weight of the canonical structure B (Scheme 1). With the presence of the amino group, we can observe the increase of the bonds C1-C2 (0.016-0.018 Å), C3-C4 (0.004-0.007 Å) and C5-N6 (0.005-0.009 Å) and the decrease of the bonds C2-C3 (0.010-0.013 Å), C4-C5 (0.014-0.031 Å) and N6-C7 (0.001-0.005 Å). Thus, it can be suggested that, for the ligands of the group 2, the canonical form B in the resonance structures (Scheme 1) has a stronger contribution, due to the displacement of the electronic cloud of the amino group at position 4’. As a further effect, increasing the basicity of the amino group of the azole ring results in a stronger hydrogen bond and, therefore, bigger interconversion barriers, even in the presence of the solvent.
Molecular docking
Table 3 shows the results of the molecular docking calculations of the benzoxazoles-derivatives (1a, 1b, 1c, 2a, 2b and 2c) with the Dickerson-Drew dodecamer with one artificial gap between the 5th and 6th base-pairs (AATT). On
the same table, it can be seen the fraction of conformations with intercalation and minor groove binding modes, the average interaction energy32 for each mode and the average
overall interaction (notwithstanding the binding mode). The clusters of the docked conformations are shown in the SI section (Figure S2 and Table S1).
The ligands with nitro substituents in the benzoxazole ring (1a and 2a) showed the most favorable interactions with DNA in the molecular docking calculations, compared to their analogues (ligands 1b, 1c, 2b and 2c), with average binding energy −6.91 kcal mol−1. Except for
2b,
the binding energy was slightly more negative for minor groove interactions. Comparing the ligands 1b and 2b (both ligands with pyrimidinic ring), the later, which bears an amino group as substituent, showed more favorable energy of interaction (−6.37 kcal mol−1) compared to
the first (1b, −5.16 kcal mol−1), probably due to the
0 30 60 90 120 150 180
0 3 6 9 12 15 18 ∆ ET / (kca l m o l -1 )
Torsional angle / degrees
vacuum 1a water 1a vacuum 2a water 2a
Figure 3. Relative energy (kcal mol−1) × dihedral angle (degrees)
obtained for the ligands 1a and 2a in vacuum and the aqueous medium (DFT/B3LYP with the basis set 6-31G (d)).
Table 1. Values of interconversion barrier of the rotamers cis to trans
in kcal mol−1
Ligand Vacuum Water ∆ET / (kcal mol−1)
1a 15.25 12.16 3.09
2a 16.78 14.73 2.05
1b 15.50 11.68 3.82
2b 16.70 13.74 2.96
1c 14.80 11.38 3.42
2c 15.79 12.95 2.84
Table 2. Bond lengths of the ligands 1a, 1b, 1c, 2a, 2b and 2c (the numbering corresponds to Scheme 1)
Ligand Bond length / Å
C1-C2 C2-C3 C3-C4 C4-C5 C5-N6 N6-C7
1a 1.389 1.400 1.420 1.441 1.315 1.386
2a 1.408 1.387 1.427 1.424 1.324 1.381
1b 1.389 1.399 1.419 1.444 1.314 1.392
2b 1.407 1.388 1.424 1.430 1.320 1.389
1c 1.390 1.399 1.418 1.466 1.310 1.397
2c 1.406 1.389 1.422 1.435 1.315 1.396
0 30 60 90 120 150 180
0 3 6 9 12 15 18 ∆ ET / (kca l m o l -1 )
Torsional angle / degrees
possibility of additional hydrogen bonds. The ligand 2b showed more favorable interactions as intercalator, while its precursor (1b) showed more favorable interactions as minor groove binder. Comparing the ligands 1c and 2c, the latter, which contain one amino group, showed slightly more favorable interactions with DNA than the first (−5.86 and −5.93 kcal mol−1, respectively), similar to the
ligands 1b and 2b. The ligands 1c showed more favorable interactions as minor groove binder, while the ligand 2c showed no preference. Comparing the binding strength, the following order was observed for group 1 (without the amino group) 1b < 1c < 1a. For group 2 the order was as follows: 2c < 2b < 2a.
There are no experimental data concerning the binding mode of the benzoxazoles discussed in the present work. However, the DNA binding modes of benzazoles and similar molecules have been investigated experimentally by several groups. It is known that some hybrid molecules (netropsin + bithiazoles),45 bisbenzimidazoles,46-47 derivatives of
BOXTO,48 copper (II) benzimidazole complexes49 and
6,6’-disubstituted benzothiazole trimethine cyanines50
interact with DNA preferentially as minor groove binders, whereas benzoxazoles and benzimidazoles analogues of the bis(benzoxazole) natural anticancer product UK-1,51 as well
as some transition metal complexes with benzoxazoles52
and Cu(II) complexes of Schiff base of benzimidazole53
display intercalative binding mode.
It was even found54 that two very similar benzoxazole
analogues of Hoechst 33258 differing only by the position of nitrogen and oxygen atoms in the oxazole ring presented different binding modes (minor groove binder and intercalator). The presence of different binding modes for similar analogues was also recently observed for phenylene-bisbenzothiazoles55 and for substituted benzimidazoles.56
These results show us that the a priori prediction of the binding mode for a given molecule based solely on its structure is far from certain, and therefore computational methods are very helpful.
Molecular dynamics simulation
Twelve MD simulations were carried out as described in the methodology section. The input coordinates (ligand + DNA) for the MD simulations were obtained from the molecular docking. For each ligand, two systems were built: the lowest energy conformation with intercalation (I) and the lowest energy conformation with minor groove (G) binding mode. In the following text, the systems are coded as: structure-mode. For instance, 1aI means simulations with the ligand 1a (see Figure 2) docked as an intercalator (I) in the oligonucleotide.
Based on the trajectories generated by molecular dynamics simulations, the following parameters were analyzed: root mean square deviation (RMSD), number of hydrogen bonds, the distance of the ligand in relation to the base-pair steps of oligonucleotide and structural changes in the oligonucleotide (Rise, Twist and Roll, see Figure 1). The RMSD was calculated with respect to the initial relaxed structure (after the docking, minimization and position restrained simulations). The hydrogen bonds were calculated using the default GROMACS method based on the geometrical definition of the hydrogen bond.57
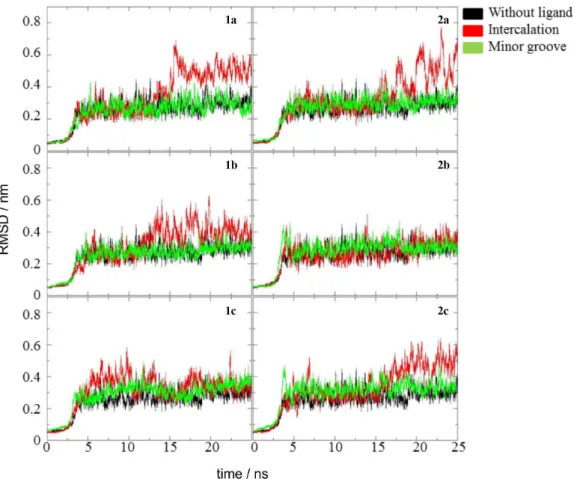
The calculation of the RMSD along the simulation allows us to check the stability and structural equilibrium of the system and to estimate roughly the magnitude of the structural changes (i.e., the occurrence of denaturation).
Figure 4 shows the results of RMSD analysis for the complexes (ligand and DNA) in intercalation (I) and minor groove binding modes (G) compared with the oligonucleotide without the ligand. The average values and their standard deviations sampled in the interval 5-25 ns are shown in the SI section, Table S2.
The ligands, when intercalated, induced large structural changes on the oligonucleotide: the intercalation binding mode complexes showed structural deviations bigger than those found for the oligonucleotide without ligand
Table 3. The interaction types (binding modes) with the corresponding
fraction of docked conformation (interaction %) and interaction energy are shown
Ligand Interaction type Interaction / % Eaverage / (kcal mol−1)
1a
Minor groove 48 −7.08 ± 0.02 Intercalation 52 −6.75 ± 0.10
Average interaction − −6.91 ± 0.19
2a
Minor groove 36 −6.97 ± 0.29 Intercalation 64 −6.87 ± 0.22
Average interaction − −6.91 ± 0.26
1b
Minor groove 38 −5.35 ± 0.17 Intercalation 62 −5.04 ± 0.11
Average interaction − −5.16 ± 0.17
2b
Minor groove 28 −6.18 ± 0.19
Intercalation 72 −6.44 ± 0.13 Average interaction − −6.37 ± 0.12
1c
Minor groove 54 −6.00 ± 0.16
Intercalation 46 −5.70 ± 0.06 Average interaction − −5.86 ± 0.07
2c
around the last 10 ns of the simulation, with the exception of the complexes with the ligand 2-(4’-amino-2’-hydroxyphenyl)-6-metilbenzoxazol (1cI) and 2-(4’-amino-2’-hydroxyphenyl)oxazole[4,5-b]pyridine (2bI). These complexes and all minor groove binding mode complexes showed RMSD values close to the oligonucleotide without ligand, as shown in Figure 4, a hint of only small structural changes.
Similar results were recently described by Netz,39 in a
study by docking and molecular dynamics of the interaction of 4-7-π-extended-2,1,3-benzothiadiazoles (BTDs) with the
Dickerson-Drew dodecamer.30 The author described that
the BTDs, when interacting as intercalators, induced more pronounced structural changes in the B-DNA than when interacting as minor groove binding mode ligands, however, without causing denaturation in either case.
After verifying the stability of the system, the base-pair steps (BPS) with which the ligands were interacting directly were identified, to later examine the possible changes therein. For all studied complexes, the BPS AATT was also analyzed, as this is the location of the artificial gap. The location of the ligand in the DNA was also used to choose the data that are relevant for further structural analysis (using the parameters
Rise, Twist and Roll). For all systems, the analysis was performed after the heating ramp, with the system already stabilized, in the range of 5 to 25 ns.
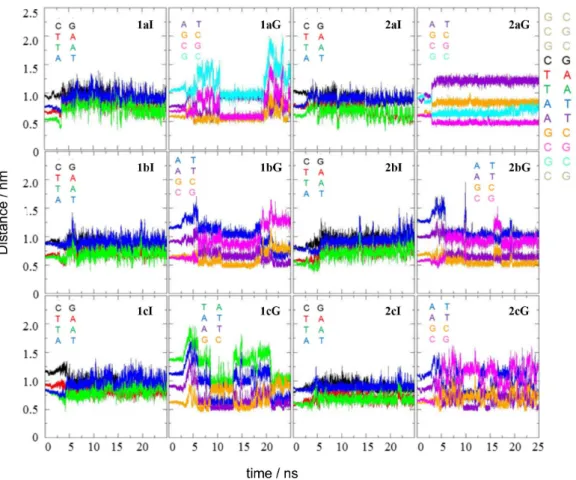
First, we analyzed the distance between the ligand’s center of mass and the center of mass of each of the twelve base-pairs of DNA, along the molecular dynamics simulations. In each case, the intercalation geometry was identified with (I) and the minor groove geometry with (G), according to the initial structure of the complex. For the intercalation binding mode complexes the distances do not change significantly throughout the simulations as shown in Figure 5.
The gap is located at the BPS AATT, and all the ligands intercalated remained close to the corresponding base-pairs (both AT, in red and green in Figure 5), with an average distance of 7.5 Å. This indicates that the complexes (ligand and DNA) were kept at a stable intercalation interaction for all simulations. According to Netz,39 molecular dynamics
simulations can be applied as a useful tool to rule out false intercalation binding modes obtained from the docking. Therefore, in the present case, we can conclude that the intercalation is indeed a favorable binding mode for our ligands.
Figure 4. Root mean square deviations (RMSD) of the oligonucleotide. In each case, three simulations were compared: oligonucleotide without ligand,
In the analysis of minor groove binding mode interactions, it was observed that the ligand 2-(2’-hydroxyphenyl) oxazole-[4,5-b]-pyridine (1bG) migrated from the tenth base-pair (CG) to the eighth base-pair (TA) during the simulation. The other ligands interacting with the minor groove also showed similar migrations, except 2-(4’-amino-2’-hydroxyphenyl)-6-nitrobenzoxazol (2aG). In all cases, the migration occurred in a stepwise way, maybe with some energy barriers for the sliding along the groove. When the ligand moves from the vicinity of a given BPS and proceeds to interact with the neighboring BPS, this change is observed by jumps and not gradually. As mentioned before, the exception was the ligand 2-(4’-amino-2’-hydroxyphenyl)-6-nitrobenzoxazole (2aG), which after the structural stabilization kept interacting with the tenth base-pair (CG) with an average distance of 5.0 Å of it during the entire simulation. This result is an indication of a stable interaction between this ligand and DNA, in agreement with the previously discussed results of molecular docking calculations. One possible reason for the strength of this interaction is the number of hydrogen bonds. The full analysis of the hydrogen bonds of the complexes throughout the simulations is shown in the SI section, but Table 4 shows
the average number of hydrogen bonds. The ligands bearing the amino group (2) displayed in average slightly more hydrogen bonds than the counterparts lacking the amino group (1). The minor groove complex 2aG was precisely the complex with the largest number of hydrogen bonds, thus confirming the strength of this interaction.
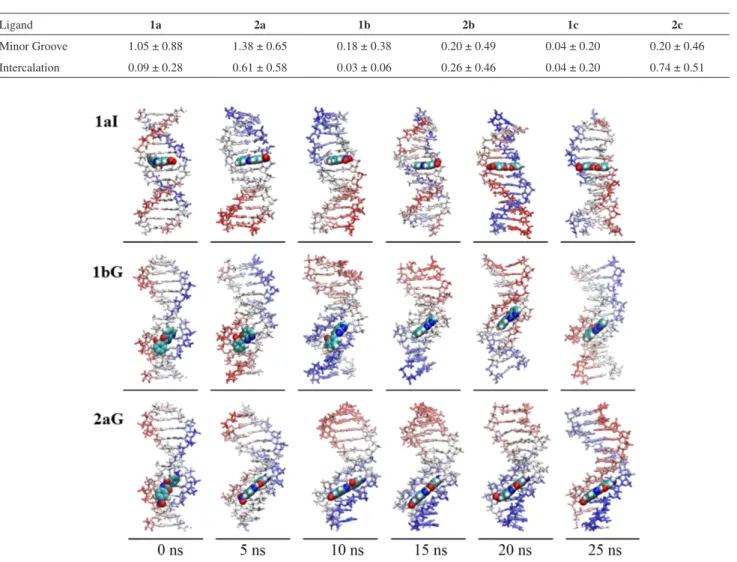
In Figure 6, some snapshots of the time evolution for the 1aI (intercalation binding mode), 1bG and 2aG (minor groove binding mode) complexes are shown.
Evaluating the snapshots, it can be seen that the ligands did not change the binding mode throughout the simulations. For the intercalation binding mode complexes, only small movements of the ligands in the gap (AATT) were observed, whereas for the minor groove binding mode complexes, some eventual migration of the ligands along the minor groove (see 1bG) was observed in some cases, in agreement with the findings regarding the distance between ligand and base-pairs (Figure 5). An interesting observation is that the 1a ligand, when intercalated, performed a 180° rotation within the gap as shown in Figure 6. The exact time of rotation of the 1a ligand can be estimated by the analysis of RMSD (Figure 4), which displays a jump after 15 ns reaching values up to 0.7 nm, which can be interpreted
Figure 5. Distance between the center of mass of the ligands and the center of the mass of some base-pairs along the simulations, for all systems. For
as a result of structural changes in the complex. The 2aG complex, which by the standards of distance (Figure 5) and number of hydrogen bonds (see SI section, Figure S3) exhibited strong interactions, also showed conservation of the interaction geometry.
From the results regarding the distance ligand-DNA, we chose which base-pair steps should be analyzed in each complex, in order to calculate the ligand-induced distortions, as it will be discussed later.
After a careful preliminary analysis, we found that, among all DNA structural parameters,30 the most relevant
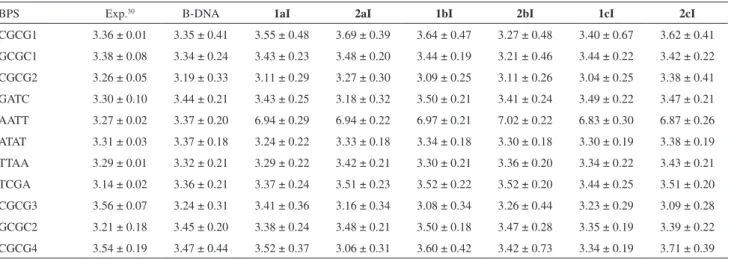
to describe the ligand-induced distortion of the DNA in our case are the Rise, Roll and Twist parameters (see Figure 1). The values of the Rise parameter for the intercalation binding mode complexes are shown in Table 5 (see also Figure S4 in SI section). The Rise values for the BPS AATT were between 6.8 and 7.0, while for the same BPS in the case of B-DNA, without the ligand, was 3.4 Å, very close to the experimental value (3.3 Å).30 These high Rise values indicate
that the ligands remained in the gap in all cases, confirming the stability of the intercalation binding mode, as already demonstrated in the analysis of distances of the ligands and the base-pairs of the DNA and analyzing the snapshots.
For the minor groove binding mode complexes, the initial gap located in the BPS AATT closed before 5 ns of simulation (see SI section, Figure S5), as expected. All Rise values remained very close to the canonical B-DNA and to the experimental data (see SI section). It is observed that the ligands remained interacting with the minor groove from the beginning to the end of the simulations, as discussed in the analysis of the snapshots of the simulation (Figure 6). In the analysis of the Roll parameter for the intercalation binding mode complexes, no clear trend was observed; only seemingly random changes between positive and negative Roll values during all simulations (see Figure S7 in SI section). Table 6 presents the average values of the Roll parameter for the B-DNA and for the intercalation binding mode complexes, with their respective standard deviations.
Table 4. Average number of ligand-DNA hydrogen bonds for the complexes
Ligand 1a 2a 1b 2b 1c 2c
Minor Groove 1.05 ± 0.88 1.38 ± 0.65 0.18 ± 0.38 0.20 ± 0.49 0.04 ± 0.20 0.20 ± 0.46 Intercalation 0.09 ± 0.28 0.61 ± 0.58 0.03 ± 0.06 0.26 ± 0.46 0.04 ± 0.20 0.74 ± 0.51
The data in Table 6 show a slight tendency to a negative Roll, except for the complex 2cI, which generated an average positive Roll in the BPS AATT and the BPS GATC, which exhibited no trend. Because of the gap, the BPS AATT endured the biggest structural changes during the simulations, with a large tendency to a negative Roll, which could be justified by the intercalation geometry of the ligand, as shown schematically in Figure 7. In this geometry, the intercalated ligand interacts with the oligonucleotide gap from the major groove side. These major structural changes during the simulations can be seen also in the large standard deviations (Table 6). Only the 2cI complex exhibited a positive Roll, but still below the B-DNA without ligand. The Roll values followed the order: 1aI < 2bI < 2aI < 1cI < 1bI < 2cI < B-DNA.
In the analysis of the Roll parameter for minor groove binding mode complexes, no clear trend was observed. All results were close to the B-DNA without the ligand, with minor variations. The results can be seen in Figure S8 and Table S4 in the SI section.
The results for the Twist parameter for the intercalation binding mode complexes are shown in Figure 8.
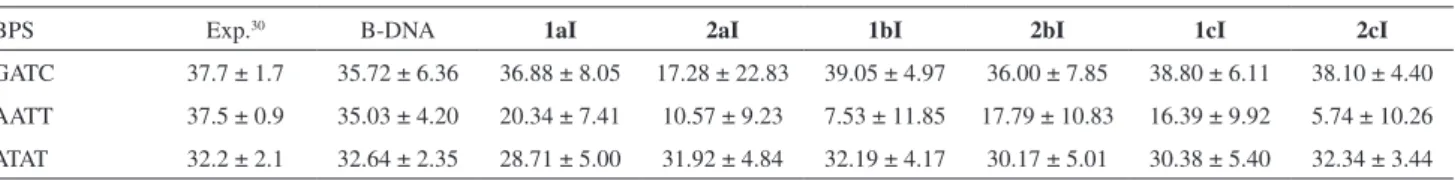
The twist parameter for the BPS GATC, located above the gap, did not change significantly, displaying values similar to the B-DNA without ligand (36.0 to 39.1° compared to 35.7°), with exception of the complex 2aI,
as shown in Figure 8 and Table 7. This later complex, after the stabilization, showed average Twist values of 39° up to 12 ns, but after that, an unwinding of the BPS was observed, reaching −13° in the last 5 ns. For AATT, the
intercalation BPS, significant changes were observed. For most cases (see Table 7), there was an unwinding of this BPS, with Twist values ranging from 5.74° to 20.34°. The 1aI complex had the smallest structural changes in this BPS, with an average Twist of 20.34°. In the case of the complexes 1cI and 2bI, there was an unwinding followed
Table 5. Average values of the Rise parameter for all base-pair steps (BPS). Sequence-dependent experimental results are shown, along with the simulation results for the oligonucleotide without ligand (B-DNA) and intercalation binding mode complexes
BPS Exp.30 B-DNA 1aI 2aI 1bI 2bI 1cI 2cI
CGCG1 3.36 ± 0.01 3.35 ± 0.41 3.55 ± 0.48 3.69 ± 0.39 3.64 ± 0.47 3.27 ± 0.48 3.40 ± 0.67 3.62 ± 0.41 GCGC1 3.38 ± 0.08 3.34 ± 0.24 3.43 ± 0.23 3.48 ± 0.20 3.44 ± 0.19 3.21 ± 0.46 3.44 ± 0.22 3.42 ± 0.22
CGCG2 3.26 ± 0.05 3.19 ± 0.33 3.11 ± 0.29 3.27 ± 0.30 3.09 ± 0.25 3.11 ± 0.26 3.04 ± 0.25 3.38 ± 0.41 GATC 3.30 ± 0.10 3.44 ± 0.21 3.43 ± 0.25 3.18 ± 0.32 3.50 ± 0.21 3.41 ± 0.24 3.49 ± 0.22 3.47 ± 0.21 AATT 3.27 ± 0.02 3.37 ± 0.20 6.94 ± 0.29 6.94 ± 0.22 6.97 ± 0.21 7.02 ± 0.22 6.83 ± 0.30 6.87 ± 0.26
ATAT 3.31 ± 0.03 3.37 ± 0.18 3.24 ± 0.22 3.33 ± 0.18 3.34 ± 0.18 3.30 ± 0.18 3.30 ± 0.19 3.38 ± 0.19 TTAA 3.29 ± 0.01 3.32 ± 0.21 3.29 ± 0.22 3.42 ± 0.21 3.30 ± 0.21 3.36 ± 0.20 3.34 ± 0.22 3.43 ± 0.21 TCGA 3.14 ± 0.02 3.36 ± 0.21 3.37 ± 0.24 3.51 ± 0.23 3.52 ± 0.22 3.52 ± 0.20 3.44 ± 0.25 3.51 ± 0.20
CGCG3 3.56 ± 0.07 3.24 ± 0.31 3.41 ± 0.36 3.16 ± 0.34 3.08 ± 0.34 3.26 ± 0.44 3.23 ± 0.29 3.09 ± 0.28 GCGC2 3.21 ± 0.18 3.45 ± 0.20 3.38 ± 0.24 3.48 ± 0.21 3.50 ± 0.18 3.47 ± 0.28 3.35 ± 0.19 3.39 ± 0.22
CGCG4 3.54 ± 0.19 3.47 ± 0.44 3.52 ± 0.37 3.06 ± 0.31 3.60 ± 0.42 3.42 ± 0.73 3.34 ± 0.19 3.71 ± 0.39
Table 6. Average values of the Roll parameter for some relevant BPS. Results for the oligonucleotide without ligand (B-DNA) and intercalation binding
mode complexes
BPS B-DNA 1aI 2aI 1bI 2bI 1cI 2cI
GATC 2.86 ± 3.89 0.96 ± 4.62 3.62 ± 5.90 −0.19 ± 4.30 0.91 ± 5.00 −1.32 ± 4.83 2.50 ± 3.91 AATT 1.91 ± 3.67 −6.00 ± 9.86 −4.64 ± 6.80 −2.91 ± 8.36 −4.99 ± 6.96 −3.24 ± 11.06 1.37 ± 3.96
ATAT −0.58 ± 3.31 −2.61 ± 4.78 −4.78 ± 4.11 −4.60 ± 4.57 −3.11 ± 4.18 −1.45 ± 5.87 −0.91 ± 3.40
Figure 7. The 2aI complex with the ligand intercalated in the DNA,
by a re-winding in the end of the simulation, probably due to a better accommodation of the ligand. The BPS ATAT showed only small changes for all complexes, the significant one was in the 1cI complex, where the ATAT twist reached an average of 28.7°, whereas for the canonical B-DNA was 32.6°, as can be seen in Table 7.
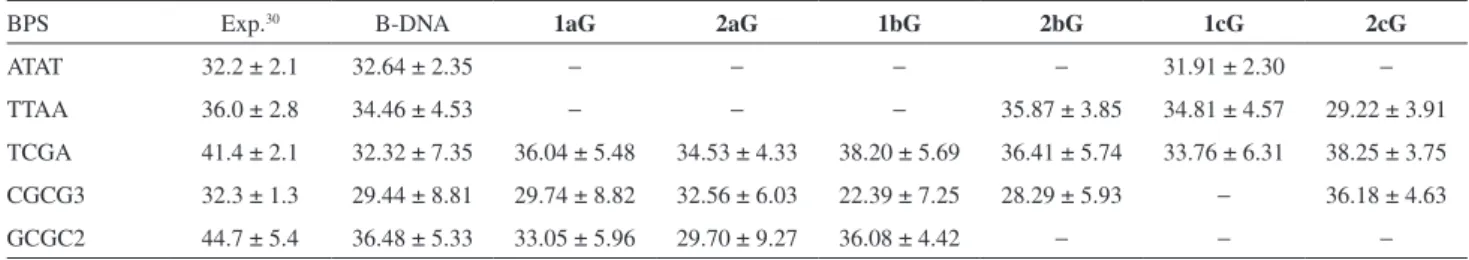
The results of the Twist parameter for the minor groove binding mode complexes are shown in Figure 9 and Table 8. Unlike the intercalation binding mode complexes, the ligands interacting in the minor groove did not induce large conformational changes in the oligonucleotide. The ligands in the complex 1bG and 2bG induced very subtle changes in the base-pair step TCGA, increasing the Twist to 36.0° for both, while for the canonical B-DNA, the value is 32.32°. In the 2aG complex, an unwinding of the base-pairs step GCGC2 is observed, showing an average value of 29.7°, whereas for the canonical B-DNA a value of 36.5° was found. For the 1bG complex, the winding of the base-pair step TCGA (38.2°) is followed by unwinding of the CGCG3
(22.4°) when compared with the canonical B-DNA (32.3° and 29.4°, respectively). For the 2cG complex, the winding to the base-pair steps TCGA and CGCG3 was observed, accompanied by the unwinding of TTAA, with results of 38.3°, 36.2º and 29.2°, respectively, while for the canonical DNA was observed 32.3°, 29.4° and 34.5°.
Table 8 shows the average values of the Twist parameters for the B-DNA minor groove binding mode complexes with their respective standard deviations and the experimental results.30
Molecular docking with the relaxed structure
When performing molecular docking studies of any ligand with a given macromolecule whose structure has been obtained from experimental data or constructed through software, sometimes the macromolecular structure does not correspond to the real conformation in biological systems, under physiological conditions.58-60 Thus, in
Figure 8. Twist parameter for some relevant base-pair steps for the intercalation binding mode complexes.
Table 7. Average values of the Twist parameter for some relevant BPS. Sequence-dependent experimental results are shown, along with the simulation
results for the oligonucleotide without ligand (B-DNA) and intercalation binding mode complexes
BPS Exp.30 B-DNA 1aI 2aI 1bI 2bI 1cI 2cI
GATC 37.7 ± 1.7 35.72 ± 6.36 36.88 ± 8.05 17.28 ± 22.83 39.05 ± 4.97 36.00 ± 7.85 38.80 ± 6.11 38.10 ± 4.40
some cases, structures obtained from molecular dynamics simulations may be more representative than the actual recrystallized structures. In this part of the work, we used the conformations obtained at the end of each molecular dynamics simulation as receptor structures in a molecular docking study. It is noteworthy that these structures are relaxed and, more importantly, already adapted to each ligand. Table 9 shows the average of 100 runs of molecular docking calculations of benzoxazole-derivatives (1a, 1b, 1c, 2a, 2b and 2c) with the Dickerson-Drew dodecamer compared with the initial results of docking. The receptor structure used was the final structure obtained after 25 ns molecular dynamics simulations. The dockings were performed for both intercalation and minor groove binding mode complexes.
According to the results shown in Table 9, the molecular docking calculations with the final structures showed
Table 8. Average values of the Twist parameter for some relevant BPS. Sequence-dependent experimental results are shown, along with the simulation
results for the oligonucleotide without ligand (B-DNA) and minor groove binding mode complexes
BPS Exp.30 B-DNA 1aG 2aG 1bG 2bG 1cG 2cG
ATAT 32.2 ± 2.1 32.64 ± 2.35 − − − − 31.91 ± 2.30 −
TTAA 36.0 ± 2.8 34.46 ± 4.53 − − − 35.87 ± 3.85 34.81 ± 4.57 29.22 ± 3.91
TCGA 41.4 ± 2.1 32.32 ± 7.35 36.04 ± 5.48 34.53 ± 4.33 38.20 ± 5.69 36.41 ± 5.74 33.76 ± 6.31 38.25 ± 3.75 CGCG3 32.3 ± 1.3 29.44 ± 8.81 29.74 ± 8.82 32.56 ± 6.03 22.39 ± 7.25 28.29 ± 5.93 − 36.18 ± 4.63
GCGC2 44.7 ± 5.4 36.48 ± 5.33 33.05 ± 5.96 29.70 ± 9.27 36.08 ± 4.42 − − −
Figure 9. Twist parameter for some relevant base-pair steps for the minor groove binding mode complexes.
Table 9. Molecular docking calculation results
Ligand Interaction type E Initial docking average / (kcal mol−1)
Final docking Eaverage / (kcal mol−1)
1a Minor groove (G)
−7.08 ± 0.02 −7.21 ± 0.28 Intercalation (I) −6.75 ± 0.10 −7.89 ± 0.16
2a
Minor groove (G) −6.97 ± 0.29 −8.03 ± 0.35
Intercalation (I) −6.87 ± 0.22 −7.96 ± 0.18
1b Minor groove (G)
−5.35 ± 0.17 −7.01 ± 0.22 Intercalation (I) −5.04 ± 0.11 −6.26 ± 0.04
2b Minor groove (G)
−6.18 ± 0.19 −6.26 ± 0.08 Intercalation (I) −6.44 ± 0.13 −6.49 ± 0.09
1c Minor groove (G)
−6.00 ± 0.16 −7.48 ± 0.08 Intercalation (I) −5.70 ± 0.06 −6.59 ± 0.09
2c Minor groove (G)
interactions 0.05 to 1.95 kcal mol−1 more favorable than the
dockings with the initial structures. This can be explained considering that the receptor is already conformationally adapted to the ligand, allowing a better interaction. With the group 1, the ligand with nitro grouping (1aI), presented more favorable interactions in intercalation with the dodecamer (−7.89 kcal mol−1), when compared
with the ligands 1bI and 1cI, (−6.26 and −6.59 kcal mol−1,
respectively). For the same group, analyzing the minor groove binding mode complexes, the ligand with methyl group (1cG) presented more favorable interactions than other ligands of the same group, with average energy of −7.48 kcal mol−1, whereas the ligands
1aG and 1bG showed −7.21 and −7.01 kcal mol−1, respectively. In the
overall average energies, the order of the most favorable interaction was as follows 1b < 1c < 1a, which is the same sequence that was observed in the initial molecular docking calculations. The ligands of group 2 showed more favorable energies when compared with their respective precursors of group 1, with the exception of 2b ligand as minor groove binder. For both binding mode complexes, the following order of stability was found: 2b < 2c < 2a. In the molecular docking calculations with the initial receptor structure, the 2b ligand showed more favorable interactions than the 2c. It was also observed that the intercalation binding mode in the docking with the final structures was the most favorable for the ligands 1a, 2b and 2c. In general, the ligands with nitro grouping showed more favorable interaction energy than the ligands with methyl grouping, which showed more favorable energies than the ligands with pyridine ring. This affinity is increased with the addition of an amino grouping, as observed in the analysis of molecular docking calculations in both initial and final structures.
Conclusions
Investigations using quantum mechanical calculations for conformational analysis, molecular docking calculations and molecular dynamics simulation of six 2-(2’-hydroxyphenyl)-benzoxazoles derivates with B-DNA were carried out. In the conformational analysis, the ligands with amino group (group 2) showed the highest rotational barriers in the interconversion of the cis to trans rotamer and the lowest influence of the solvent, when compared with their respective precursors (group 1). In the analysis by molecular docking, ligands with the amino group showed more favorable interactions when compared with their respective precursors, with the only exception being the ligands 1a and 2a, both showing the same average energy of interaction. The most important binding mode for ligands of this group
with the DNA was the minor groove binding mode, with the only exception being the ligand 2b, which showed a preference for intercalation binding mode interactions. In the molecular dynamics simulation, the RMSD analysis showed a higher structural stability for minor groove than for intercalation binding mode complexes. The migration of the ligand along the minor groove was characterized by a stepwise process, indicating the existence of energy barriers for the sliding of the ligand between a base-pair step and other. In all cases, the ligand remained bound to the receptor and no change in the binding mode was observed, contrary to the case of BTDs.39 Similarly to
the calculations with the initial structures, the docking calculations with the relaxed structures showed more favorable interaction for the ligands with nitro group than for ligands with methyl group, which on its turn showed more favorable energies than the ligands with pyridinic ring. This affinity is increased with the addition of an amino grouping. The molecular dockings with the relaxed structures did not show a clear trend of preference of interactions between the intercalation and minor groove. In the overall results, the ligand 2a (2-(4’-amino-2’-hydroxyphenyl)-6-nitrobenzoxazole) exhibited more favorable interactions with DNA than the other ligands for all methods. Overall, the results showed that all studied ligands can interact with the minor groove of the oligonucleotide, but are also able to interact as an intercalator. Because of the strong interactions, and also their unique photophysical properties, this class of molecules may act as potential biological probes for DNA, but further studies in vitro and in vivo are needed.
Supplementary Information
Supplementary data are available free of charge at http://jbcs.sbq.org.br as PDF file.
References
1. Becker, M. R.; Stefani, V.; Forte, M. M. C.; React. Funct. Polym.
2006, 66, 1664.
2. Rodembusch, F. S.; Campo, L. F.; Stefani, V.; Samios, D.; Silveira, N. P.; Polymer2005, 46, 7185.
3. Kober, U. A.; Campo, L. F.; Costa, T. M. H.; Stefani, V.; Ramminger, G. O.; Gallas, M. R.; J. Photochem. Photobiol., A
2007, 186, 24.
4. Hoffmann, H. S.; Stefani, V.; Benvenutti, E. V.; Costa, T. M. H.; Gallas, M. R.; Mater. Chem. Phys.2011, 126, 97.
6. Goswami, S.; Maitya, S.; Das, A. K.; Maitya, A. C.; Mandal, T. K.; Samanta, S.; Tetrahedron Lett.2013, 54, 5232.
7. Anbuselvan, C.; Jayabharathi, J.; Thanikachalam, V.; Tamilselvi, G.; Spectrochim. Acta, Part A 2012, 97, 125.
8. Kocı, J.; Klimesova, V.; Waisser, K.; Kaustova, J.; Dahsec, H.; Möllmannc, U.; Bioorg. Med. Chem. Lett. 2002, 12, 3275.
9. Zablotskaya, A.; Segal, I.; Geronikaki, A.; Eremkina, T.; Belyakov, S.; Petrova, M.; Shestakova, I.; Zvejniece, L.; Nikolajeva, V.; Eur. J. Med. Chem.2013, 70, 846.
10. Gautam, M. K.; Kant, S. N.; Priyanka, S.; Jha, K. K.; Int. J. ChemTech Res.2012, 4,640.
11. Elzahabi, H. S. A.; Eur. J. Med. Chem.2011, 46, 4025.
12. Havrylyuka, D.; Mosula, L.; Zimenkovsky, B.; Vasylenkoc, O.; Gzella, A.; Lesyk, R.; Eur. J. Med. Chem.2010, 45, 5012.
13. Yildiz-Oren, I.; Yalcin, I.; Aki-Sener, E.; Ucarturk, N.; Eur. J. Med. Chem.2004, 39, 291.
14. Padalkar, V. S.; Gupta, V. D.; Phatangare, K. R.; Patil, V. S.; Umape, P. G.; Sekar, N.; J. Saudi Chem. Soc.2013, 18, 262.
15. Hussein, B. H. M.; Azaba, H. A.; El-Azabb, M. F.; El-Falouji, A. I.; Eur. J. Med. Chem.2012, 51, 99.
16. Stennett, E. M. S.; Ciuba, M. A.; Levitus, M.; Chem. Soc. Rev.
2014, 43, 1057.
17. Lilley, D. M. J.; Wilson, T. J.; Curr. Opin. Chem. Biol. 2000, 4, 507.
18. Park, H.; Toprak, E.; Selvin, P. R.; Q. Rev. Biophys.2007, 40, 87.
19. Sengupta, P.; Balaji, J.; Maiti, S.; Methods2002, 27, 374. 20. Bezanilla, F.; Phys. Rev. 2000, 80, 555.
21. Ghorbani, M.; Mohammad-Rafiee, F.; Nucleic Acids Res.2011,
39, 1220.
22. Lu, X. -J.; Olson, W. -K.; Nucleic Acids Res.2003, 31, 5108.
23. GaussView, Version 4.1, Frisch, A.; Dennington II, R. D.; Keith, T. A. and Millam, J.; Semichem, Inc., Shawnee Mission, KS,
2007.
24. Frisch, M. J.; Trucks, G. W.; Schlegel, H. B.; Scuseria, G. E.; Robb, M. A.; Cheeseman, J. R.; Zakrzewski, V. G.; Montgomery Jr., J. A.; Stratmann, R. E.; Burant, J. C.; Dapprich, S.; Millam, J. M.; Daniels, A. D.; Kudin, K. N.; Strain, M. C.; Farkas, O.; Tomasi, J.; Barone, V.; Cossi, M.; Cammi, R.; Mennucci, B.; Pomelli, C.; Adamo, C.; Clifford, S.; Ochterski, J.; Petersson, G. A.; Ayala, P. Y.; Cui, Q.; Morokuma, K.; Salvador, P.; Dannenberg, J. J.; Malick, D. K.; Rabuck, A. D.; Raghavachari, K.; Foresman, J. B.; Cioslowski, J.; Ortiz, J. V.; Baboul, A. G.; Stefanov, B. B.; Liu, G.; Liashenko, A.; Piskorz, P.; Komaromi, I.; Gomperts, R.; Martin, R. L.; Fox, D. J.; Keith, T.; Al-Laham, M. A.; Peng, C. Y.; Nanayakkara, A.; Challacombe, M.; Gill, P. M. W.; Johnson, B.; Chen, W.; Wong, M. W.; Andres, J. L.; Gonzalez, C.; Head-Gordon, M.; Replogle, E. S.; Pople, J. A.; Gaussian 98, Revision A.1x, Gaussian Inc.: Pittsburgh, PA, 2001.
25. Bauschlicher Jr., C. W.; Chem. Phys. Lett.1995, 246, 40. 26. Grasel, F. S.; Oliveira, T. C.; Fontoura, L. A. M.; Rigotti, I. J. C.;
Netz, P. A.; Int. J. Quantum Chem.2012, 112, 1678.
27. Kruse, H.; Goerigk, L.; Grimme, S.; J. Org. Chem. 2012, 77,
10824.
28. Spartan ’08, Version 1.2.0; Wavefunction Inc.: Irvine, CA, 2008.
29. Marenich, A. V.; Olson, R. M.; Kelly, C. P.; Cramer, C. J.; Truhlar, D. G.; J. Chem. Theory Comput. 2007, 3, 2011.
30. Drew, H. R.; Wing, R. M.; Takano, T.; Broka, C.; Tanaka, S.; Itakura, K.; Dickerson, R. E.; Proc. Natl. Acad. Sci. U. S. A.
1981,78, 2179.
31. Ricci, C. G.; Netz, P. A.; J. Chem. Inf. Model.2009, 49, 1925.
32. Huey, R.; Morris, G. M.; Olson, A. J.; Goodsell, D. S.;
J. Comput. Chem.2007, 28, 1145.
33. Sanner, M. F.; J. Mol. Graphics Modell.1999, 17, 57. 34. Gonçalves, A. S.; França, T. C. C.; Figueroa-Villar, J. D.;
Pascutti, P. G.; J. Braz. Chem.Soc.2011, 22, 155.
35. Gonçalves, A. S.; Caffarena, E. R.; Pascutti, P. G.; J. Braz. Chem. Soc. 2009, 20, 1227.
36. Guimarães, A. P.; Oliveira, A. A.; Cunha, E. F. F.; Ramalho, T. C.; França, T. C. C.; J. Biomol. Struct. Dyn. 2011, 28, 455. 37. Ricci, C. G.; Netz, P. A.; J. Braz. Chem. Soc. 2012, 23, 1334.
38. Ricci, C. G.; Andrade, A. S. C.; Mottin, M.; Netz, P. A.; J. Phys. Chem. B2010, 114, 9882.
39. Netz, P. A.; Int. J. Quantum Chem.2012, 112, 3296.
40. Wang, J.; Wolf, R. M.; Caldwell, J. W.; Kollman, P. A.; Case, D. A.; J. Comput. Chem.2004, 25, 1157.
41. Silva, A. W. S.;Vranken, W. F.; BMC Res. Notes2012, 5, 367.
42. Anbuselvan, C.; Jayabharathi, J.; Thanikachalam, V.; Tamilselvi, G.; Spectrochim. Acta A2012, 97, 125.
43. Phatangare, K. R.; Gupta, V. D.; Tathe, A. B.; Padalkar, V. S.; Patil, V. S.; Ramasami, P.; Sekar, N.; Tetrahedron2013, 69,
1767.
44. Jayabharathi, J.; Thanikachalam, V.; Jayamoorthy, K.; Srinivasan, N.; Spectrochim. Acta, Part A2013, 105, 223. 45. Mrani, D.; Gosselin, G.; Bailly, C.; Houssin, R.; Rao, K. E.;
Zimmerman, J.; Balzarini, J.; De Clercq, E.; Henichart, J. P.; Imbach, J. L.; Lown, J. W.; Eur. J. Med. Chem. 1992, 27, 33l.
46. Turner, P. R.; Denny, W. A.; Mutat. Res. 1996, 355, 141. 47. Wang, X.; Yang, M.; Zhang, L.; Yao, T.; Chen, C.; Mao, L.;
Wang, Y.; Wu, J.; Chin. Chem. Lett.2014, 25, 589.
48. Eriksson, M.; Westerlund, F.; Mehmedovic, M.; Lincoln, P.; Westman, G.; Larsson, A.; Åkerman, B.; Biophys. Chem. 2006,
122, 195.
49. Arjmand, F.; Parveen, S.; Afzal, M.; Shahid, M.; J. Photochem. Photobiol., B2012, 114, 15.
50. Kovalska, V. B.; Volkova, K. D.; Losytskyy, M. Y.; Tolmachev, O. I.; Balanda, A. O.; Yarmoluk, S. M.; Spectrochim. Acta, Part A2006, 65, 271.
52. Jiang, J.; Tang, X.; Dou, W.; Zhang, H.; Liu, W.; Wang, C.; Zheng, J.; J. Inorg. Biochem.2010, 104, 583.
53. Song, W.; Cheng, J.; Jiang, D.; Guo, L.; Cai, M.; Yang, H.; Lin, Q.; Spectrochim. Acta, Part A.2014, 121, 70.
54. Lown, J. W. In Advances in DNA Sequence-Specific Agents, Graham, B. J., ed.; JAI Press: Greenwich, vol 3, 1997. 55. Racané, L.; Pavelic, S. K.; Nhili, R.; Depauw, S.;
Paul-Constant, C.; Ratkaj, I.; David-Cordonnier, M.; Pavelic, K.; Tralic-Kulenovic, V.; Karminski-Zamola, G.; Eur. J. Med. Chem. 2013, 63, 882.
56. Catalán, M.; Álvarez-Lueje, A.; Bollo, S.; Bioelectrochemistry
2010, 79, 162.
57. Luzar, A.; Chandler, D.; J. Chem. Phys.1993, 98, 8160.
58. Fuentes, G.; Dastidar, S. G.; Madhumalar, A.; Verma, C. S.;
Drug Dev. Res. 2011, 72, 26.
59. Mavromoustakos, T.; Durdagi, S.; Koukoulitsa, C.; Simcic, M.; Papadopoulos, M. G.; Hodoscek, M.; Grdadolnik, S. G.; Curr. Med. Chem. 2011, 18, 2517.
60. Gharaghani, S.; Khayamian, T.; Ebrahimi, M.; SAR QSAR Environ. Res. 2013, 24, 773.
Submitted: June 29, 2014 Published online: December 16, 2014