Artigo Original
André Augusto Spadotto1
Ana Rita Gatto2
Paula Cristina Cola3
Roberta Gonçalves da Silva4
Arthur Oscar Schelp2
Danielle Ramos Domenis5
Roberto Oliveira Dantas6
Descritores
Auscultação Deglutição Transtornos de deglutição Fluoroscopia Acústica Software
Keywords
Auscultation Deglutition Deglutition disorders Fluoroscopy Acoustics Software
Correspondence address:
André Augusto Spadotto
R. Alegria, 313, Recanto Azul, Botucatu (SP), Brasil, CEP: 18603-090. E-mail: spadotto@gmail.com
Received: 5/16/2011
Accepted: 5/10/2012
Study conducted at the Medical School of Ribeirão Preto, Universidade de São Paulo – USP – Ribeirão Preto (SP), Brazil, and at the Botucatu Medical School, Universidade Estadual Paulista “Júlio de Mesquita Filho” – UNESP – Botucatu (SP), Brazil.
(1) Physics Institute of São Carlos, School of Engineering, Universidade de São Paulo – USP – São Carlos (SP), Brazil.
(2) Department of Neurology and Psychiatry, Botucatu Medical School, Universidade Estadual Paulista “Júlio de Mesquita Filho” – UNESP – Botucatu (SP), Brazil.
(3) Dysphagia Laboratory, Marília College of Philosophy and Sciences, Universidade Estadual Paulista “Júlio de Mesquita Filho” – UNESP – Marília (SP), Brazil.
(4) Department of Speech-Language Pathology and Audiology, Marília College of Philosophy and Sciences, Universidade Estadual Paulista “Júlio de Mesquita Filho” – UNESP – Marília (SP), Brazil.
(5) Department of Ophthalmology, Otorhinolaryngology and Head and Neck Surgery, Medical School of Ribeirão Preto, Universidade de São Paulo – USP – Ribeirão Preto (SP), Brazil.
(6) Department of Medicine, Medical School of Ribeirão Preto, Universidade de São Paulo – USP – Ribeirão Preto (SP), Brazil.
preliminary study
Componentes do sinal acústico da deglutição: estudo
preliminar
ABSTRACT
Purpose: To analyze the components of the acoustic signal of swallowing using a specific software. Methods:
Fourteen healthy subjects ranging in age from 20 to 50 years (mean age 31±10 years), were evaluated. Data collection consisted on the simultaneous capture of the swallowing audio with a microphone and of the swallo-wing videofluoroscopic image. The bursts of the swalloswallo-wing acoustic signal were identified and their duration and the interval between them were later analyzed using a specific software, which allowed the simultaneous analyses between the acoustic wave and the videofluoroscopic image. Results: Three burst components were identified in most of the swallows evaluated. The first burst presented mean time of 87.3 milliseconds (ms) for water and 78.2 for the substance. The second burst presented mean time of 112.9 ms for water and 85.5 for the pasty substance. The mean interval between first and second burst was 82.1 ms for water and 95.3 ms for the pasty consistency, and between second and third burst was 339.8 ms for water and 322.0 ms for the pasty con-sistency. Conclusion: The software allowed the visualization of three bursts during the swallowing of healthy individuals, and showed that the swallowing signal in normal subjects is highly variable.
RESUMO
Objetivo: Analisar os componentes do sinal acústico da deglutição com o auxílio de software específico.
INTRODUCTION
Cervical auscultation is a noninvasive method used to assess the sounds of swallowing with an amplification instrument such as a stethoscope. Although it has been commonly used during the clinical assessment of oropharyngeal dysphagia, its clinical application as a reliable tool is still controversial, due to the subjectivity in the interpretation of results and the lack of methodological standardization(1,2). However, when associated with other parameters of clinical swallowing examination, its importance as an early warning system for identifying patients at high risk for aspiration/penetration has been shown by several investigators(1,3).
The videofluoroscopy of swallowing is currently conside-red the best method for qualitative and objective evaluation of the dynamics of swallowing, allowing visualization of all phases. Nevertheless, the exam has some limitations, such as patient exposure to radiation, the need to move the patient to the radiology service, and the high cost of the procedure. These factors limit the periodic assessment for monitoring swallowing therapy. In order to reduce the sub-jectivity of traditional cervical auscultation and to aid the assessment of swallowing dysfunction, a new and interes-ting instrument called digital cervical auscultation is being developed.
Even though the first studies with digital cervical ausculta-tion date back to 1965, several gaps still need to be filled due to the great irregularity and variability of the acoustic signal detected. Thus, for this instrument to gain credibility, a better understanding of the variables of the acoustic signal, of its normal patterns and of the generating sources is needed.
The purposes of recent research in this area are varied. While some investigators try to determine the optimum site for placing the acoustic detector(4,5), others wish to understand the generation of the signal(6-8), and others yet investigate the acoustic characteristics of the swallowing signal(8-13).
Regarding the acoustic characteristics of the swallowing signal, it has been reported that, in normal subjects, swallo-wing mainly consists of two distinct temporal components(14), identified by an audible double click, with a considerable individual variability. Another study(6) reported the presence of three swallowing sounds. Another research(8) quantified the major components of the swallowing signal of normal indivi-duals and their duration, using swallowing videofluoroscopy as a support. The authors identified six sound components with inter- and intra-individual variability, and only three of them were more systematic.
Along the same research line, another study(15) also detec-ted six sound components, and none of them occurred in all swallows. In addition, using swallowing nasolaryngoscopy during sound capture, these authors did not detect a consistent correlation between any of these components and a physiolo-gical event specific of swallowing.
In view of the above considerations, the purpose of the present study was to analyze the components of the acoustic signal of swallowing using a specific software.
METHODS Subjects
Fourteen healthy subjects – four men and ten women – with ages between 20 and 50 years (mean=31±10 years) were evaluated. Based on a questionnaire, subjects with previous or current difficulties in swallowing, digestive problems, or under treatment with medication that might cause swallowing difficulties were excluded from the sample.
The study project was approved by the Research Ethics Committee of the Medical School of Ribeirão Preto, Universidade de São Paulo (USP) (process number 10073/2008). All subjects included in the study protocol were fully informed and signed the free and informed consent term.
Procedures
The assessment consisted of simultaneous capture of the videofluoroscopic image of swallowing and of the sound of swallowing. The audio signal was captured using a dynamic microphone placed on the region of the cricoid cartilage (in-ferior lateral margin). The microphone was connected to a Wattsom sound board for pre-amplification and gain control. The audio output of the sound board was directly connected to the recorder.
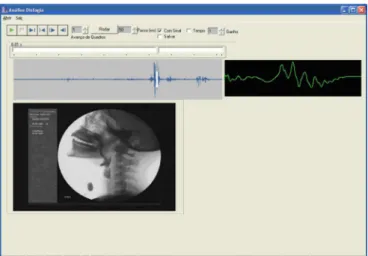
In order to increase the reliability of the identification and interpretation, the audio signal and the videofluoroscopy images were obtained simultaneously. The real-time capture and analy-sis of sound and image has enabled us to determine precisely the moment in physiology when the swallowing bursts occur, avoiding them to be confused with other local noises (Figure 1).
Both signals were digitized and stored on a Philips® DVD recorder model DVDR3455H/78. The digitization quality was 29.97 frames per second for the video and 44,100 samples per second for the acoustic signal, which was converted into 22,050 Hz by editing. The video signal came from the videofluoros-copy exam, which was performed using an Arcomax Philips®
instrument (Philips Medical Systems, model BV Pulsera, Veenpluis, The Netherlands). All exams were monitored by a speech-language pathologist with experience in videofluo-roscopy along with a bioengineer responsible for the perfect functioning of the sound capture equipment.
The following materials were used to prepare the samples of different consistencies: a disposable plastic cup, a disposa-ble 20 ml syringe, a disposadisposa-ble plastic spoon, water at natural temperature, food thickener, and barium. The liquid consis-tency sample consisted of liquid barium (100% barium sulfate, Bariogel®, Laboratório Cristália, Itapira, SP, Brazil), and the pasty consistency sample was prepared with 50 ml liquid ba-rium added of 4.5 g thickener (Thick & Easy®, Hormel Health Labs, Austin, MN, USA).
Each subject was observed while sitting on a chair positio-ned laterally to the image intensifier. The lateral images were obtained from the mouth, pharynx and proximal esophagus. The subjects were evaluated during six swallows, i.e. three in pasty consistency and three in liquid consistency. Three spoonfuls (7 ml each) of pasty consistency were offered first, followed by three swallows of liquid consistency offered in a disposable cup (10 ml in each cup). For analysis and later interpretation, a total of 84 swallows were divided into two groups: swallows of pasty consistency (G1) and swallows of liquid samples (G2).
Thirteen of the 84 swallows were discarded due to different factors, such as dislocation of the microphone causing inter-ference by external sounds or even reducing the amplitude of the signal in such a way that the noise present stood out in relation to the desired signal, or due to lack of synchronization between the RX technician and the operator of the digitizer, causing incomplete recording of some exams. Thus, a total of 71 swallows was analyzed, 39 for G1 and 32 for G2.
The acoustic signal and the videofluoroscopic exam were analyzed simultaneously in order to reduce subjectivity in the detection of the swallowing bursts. A software was developed for this purpose and, in addition to allowing analysis of the video frame by frame(16), it also provided tools for visuali-zation of each signal’s wave shape. The software functions in an integrated manner, synchronizing video and audio for each swallow. Advancing through each video frame makes it possible to determine the portion of the signal and the corres-ponding physiological event at that specific time. However, it should be emphasized that, in this study, we did not calculate the correlation with the physiology of swallowing, and the videofluoroscopic image was used only to facilitate the cor-rect location of the swallowing signal, preventing confusion with artifacts.
By using frame-by-frame advancement with the aid of the software, it was possible to correlate the videofluoroscopic image with the acoustic signal, and thus identify exactly the sound components (also called “bursts”) in the wave shapes of the signal and to measure the time interval between them.
Based on the tool, the times of the main bursts (bursts 1 and 2) were computed. The third burst could not be fully identified due to the difficulty demarcating the end of this component, which is often mixed with the signal generated by expiration; hence, only its beginning could be determined. Based on these
markings, it was possible to estimate the interval between bursts. Figure 1 presents a sample screen of the program with the videofluoroscopic image and the shape of the signal wave. The image shows the signal of the exam in its total time and also the specific portion (in white) of the video frame in question.
Figure 2 shows a hypothetical schematic swallowing signal, in order to illustrate and facilitate the understanding of the morphology of the signal.
Statistical analysis
The data obtained for different consistencies were statisti-cally analyzed using the Student t-test, with level of significance set at 0.05.
RESULTS
In five (7%) of the 71 swallows analyzed, only two sound components could be detected, whereas three sound compo-nents were detected in the remaining 66 swallows (93%). Times of the major bursts (burst 1 and burst 2) were computed, while only the beginning of the third burst was recorded.
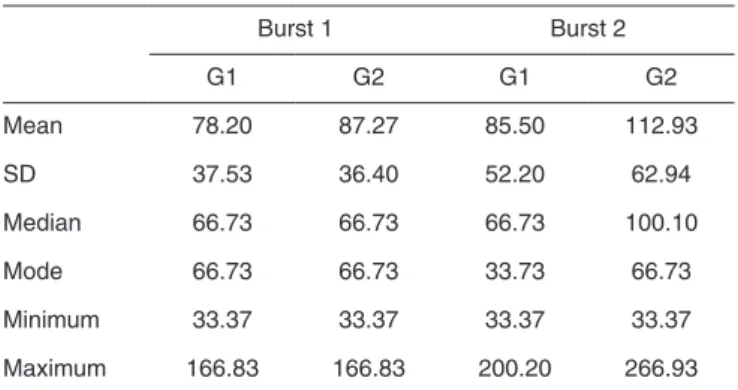
The durations computed for each time point did not di-ffer significantly between liquid and pasty consistency, with p=0.4817 for burst 1 and p=0.2590 for burst 2. The first sound component (burst 1) lasted 87.27±36.40 ms for the liquid consistency and 78.20±37.53 ms for the pasty consistency, and the second sound component (burst 2) had mean duration of 112.93±62.94 ms for the liquid consistency and of 85.50±52.20 ms for the pasty consistency (Table 1).
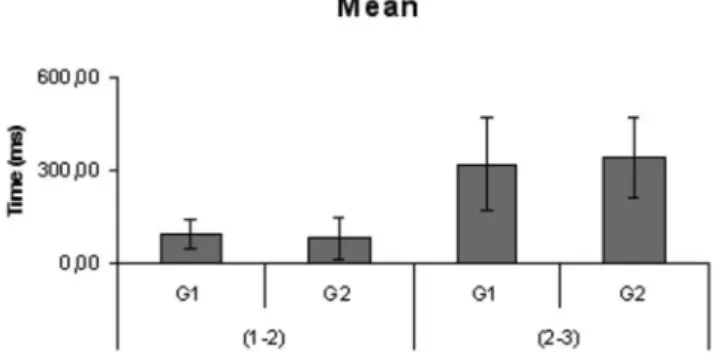
Two time intervals between signal components occurring
Figure 2. Schematic illustration of the sound bursts and their intervals
Table 1. Duration of swallows (milliseconds)
Burst 1 Burst 2
G1 G2 G1 G2
Mean 78.20 87.27 85.50 112.93
SD 37.53 36.40 52.20 62.94
Median 66.73 66.73 66.73 100.10
Mode 66.73 66.73 33.73 66.73
Minimum 33.37 33.37 33.37 33.37
Maximum 166.83 166.83 200.20 266.93
during swallowing were also identified and computed. These intervals (in milliseconds) correspond to the time between burst 1 and burst 2 (1-2) and between burst 2 and the beginning of burst 3 (2-3). The mean 1-2 interval was 82.13±66.22 ms for the liquid consistency and 95.33±48.66 ms for the pasty consistency, and the mean 2-3 interval was 339.84±127 ms for water and 322±145 ms milliseconds for the pasty consistency (Figure 3).
DISCUSSION
The first difficulty encountered in the present study was the choice of the capture method. According to authors(5), the most appropriate acoustic detector for capturing swallowing sounds is the accelerometer, because of its broad range of response and low level of attenuation. However, a revision of this methodology in another study obtained better results with the microphone, compared to the accelerometer(4). The latter authors justified the difference in results as being due to the fact that the authors of the former study(6) amplified only the signal of the accelerometer, thus causing a premature rejection to the microphone.
Based on these literature data, we started our data collection using an electret microphone, but met with many problems, such as signal saturation, which could be explained by the fact that the swallowing signal contains an abrupt variation of ampli-tude at any given time. Many analogue-to-digital converters are equipped with gain controls in order to minimize variations of this type but, in our case, these controls jeopardize the quality of the signal. For this reason, it was decided to use a dynamic microphone connected to a pre-amplifier of professional use and to the line entry of the digital-to-analogue converter (sound board or DVD recorder when used together with videofluoros-copy). Thus, it was possible to avoid saturation of the signal and to obtain a broad range of frequency response and a low level of attenuation.
The acoustic detector was fixed to the area close to the la-teral margin of the trachea immediately inferior to the cricoid cartilage. This has been considered to be an optimum region in previous studies(5,6), because it presents the highest mean magnitude of the signal and the lowest standard deviation of
the maximum peaks of swallowing sound.
The present study was innovative in terms of analysis. For the first time an integrated software specifically developed for working simultaneously with video and audio was used. Other studies have used separate commercial softwares for sound and video, performing an approximate synchrony based on the time recorded by each software.
The correlation of the acoustic wave and videofluoroscopic images provided greater reliability in the analysis of the swallo-wing sound, alloswallo-wing visualization of the act of swalloswallo-wing, avoiding, thus, assessment of artifacts.
In most of the 71 swallows evaluated, three sound compo-nents were identified, while in five swallows (7%) only two sound components were identified, in agreement with other literature reports(14,17,18). The lack of detection of all sound components is explained by the fact that the rapid passage of the food bolus causes the fusion of the minimum intervals between components.
Regarding the duration of each parameter analyzed, slightly lower values were obtained for the pasty consistency. Analysis of these data reveals wide signal variability, as well as absence of a significant difference in burst duration between different consistencies. Thus, it is not possible to state that consistency influences burst duration. A larger sample of individuals and swallows is needed in order to confirm this difference.
Although in the present study three sound components (three bursts) were observed in most swallows, it was possible to measure the duration of only two of them (Figure 3).
A study in literature(17) has also determined three acoustic bursts, but only quantified the first two. In the present study, the first two bursts showed a shorter interval than that observed in this other research (100 to 150 ms) and a longer interval be-tween the second and the third burst (300 to 400 ms). However, regarding the duration of components, the findings were not exactly the same, although the same pattern was followed, i.e., a shorter first component and a second longer one(11).
Although authors(8,18) have identified six sound components, they emphasized that only three of them occurred in a more systematic manner. Also, they did not detect similar values, but rather a considerable variability of the findings in each study. However, again, a temporal relation between studies was observed. As mentioned earlier, although the numbers are not equal, they follow a pattern, with a shorter first burst together with the first interval, and a longer second burst similar to the second interval.
Hence, it is observed that the swallowing signal is highly variable both in the present study and in previous literature reports. However, all studies present the same patterns, i.e., a short first burst and a longer second burst. A larger population needs to be evaluated for the standardization and utilization of these signals.
CONCLUSION
The software allowed the detection of swallowing com-ponents, and showed that the swallowing signal, in normal subjects, is highly variable.
Note: G1 = swallows of pasty consistency; G2 = swallows of liquid samples
REFERENCES
1. Eicher PP, Manno CJ, Fox CA, Kerwin ME. Impact of cervical auscultation on accuracy of clinical evaluation in predicting penetration/ aspiration in pediatric population. Minute – Second Workshop on Cervical Auscultation, McLean, Virginia, October 13, 1994.
2. Zenner PM, Losinski DS, Mills RH. Using cervical auscultation in the clinical dysphagia examination in long-term care. Dysphagia. 1995;10(1):27-31.
3. Borr C, Hielscher-Fastabend M, Lucking A. Reliability and validity of cervical auscultation. Dysphagia. 2007;22(3):225-34.
4. Cichero JA, Murdoch BE. Detection of swallowing sounds: methodology revisited. Dysphagia. 2002;17(1):40-9.
5. Takahashi K, Groher ME, Michi K. Methodology for detecting swallowing sounds. Dysphagia. 1994;9(1):54-62.
6. Cichero JA, Murdoch BE. The physiologic cause of swallowing sounds: answers from heart sounds and vocal tract acoustics. Dysphagia. 1998;13(1):39-52.
7. McKaig T. Auskultation gú zervikal und thorakal. In: Stanschus S, editor. Methoden in der klinischen dysphagiologie. Idstein: Schulz-Kirchner Verlag, 2002. p. 111-38.
8. Morinière S, Beutter P, Boiron M. Sound component duration of healthy human pharyngoesophageal swallowing: a gender comparison study. Dysphagia. 2006;21(3):175-82.
9. Cichero JA, Murdoch BE. Acoustic signature of the normal swallow: characterization by age, gender, and bolus volume. Ann Otol Rhinol Laryngol. 2002;111(7 Pt 1):623-32.
10. Youmans SR, Stierwalt JA. An acoustic profile of normal swallowing. Dysphagia. 2005;20(3):195-209.
11. Cichero JA, Murdoch BE. What happens after the swallow? Introducing the glottal release sound. J Med Speech Lang Pathol. 2003;11(1):33-41. 12. Santamato A, Panza F, Solfrizzi V, Russo A, Frisardi V, Megna M, et al.
Acoustic analysis of swallowing sounds: a new technique for assessing dysphagia. J Rehabil Med. 2009;41(8):639-45.
13. Almeida ST, Ferlin EL, Parente MA, Goldani HA. Assessment of swallowing sounds by digital cervical auscultation in children. Ann Otol Rhinol Laryngol. 2008;117(4):253-8.
14. Hamlet S, Nelson RJ, Patterson RL. Interpreting the sounds of swallowing: fluid flow through the cricopharyngeus. Ann Otol Rhinol Laryngol. 1990;99(9 Pt 1):749-52.
15. Leslie P, Drinnan MJ, Zammit-Maempel I, Coyle JL, Ford GA, Wilson JA. Cervical auscultation synchronized with images from endoscopy swallow evaluations. Dysphagia. 2007;22(4):290-8.
16. Spadotto AA, Gatto AR, Cola PC, Montagnoli AN, Schelp AO, Silva RG, et al. Software para análise quantitativa da deglutição. Radiol Bras. 2008;41(1):25-8.
17. Mackowiak RC, Brenman HS, Friedman MH. Acoustic profile of deglutition. Proc Soc Exp Biol Med. 1967;125(4):1149-52.