A
rti
g
o
*e-mail: [email protected]
DISTRIBUTION OF CHEMICAL COMPARTMENTS OF SOIL ORGANIC MATTER AND C STOCKS OF A CAMBISOL FROM SOUTH BRAZIL AS AFFECTED BY Pinus AFFORESTATION
Henrique Cesar Almeida, Deborah Pinheiro Dick*,Francielle Leonardelli Bertotto e Guilherme Silva Chitarra
Departamento de Físico-Química, Instituto de Química, Universidade Federal do Rio Grande do Sul, CP 15003, 91501-970 Porto Alegre – RS, Brasil
Recebido em 25/7/11; aceito em 29/2/12; publicado na web em 2/7/12
Distribution and stocks of soil organic matter (SOM) compartments after Pinus monoculture introduction in a native pasture area of a Cambisol, Santa Catarina, Brazil, were investigated. Pinus introduction increased soil acidity, content of exchangeable Al+3 and diminished soil nutrients. Nevertheless, soil C stock increased in all humic fractions of the 0-5 cm layer after Pinus afforestation. In the subsurface, the vegetation change only promoted SOM redistribution from the NaOH-extractable humic substances to a less hydrophobic humin fraction. Under Pinus, soil organo-mineral interactions were relevant up to a 15 cm depth, while in pasture environment, this mechanism occurred mainly in the surface layer.
Keywords: humic substances; humin fractions; chemical composition.
INTRODUCTION
Around 6 million hectares (ha) of Brazilian territory is currently occupied by planted forest and, off this area, around 1.8 million ha are planted with Pinus species.1 The State of Santa Catarina accounts for approximately 30% of the Pinus planted area, that were mainly established on areas originally under pasture.1
Afforestation and/or reforestation practices can alter the content and quality of soil organic matter (SOM).2 However, the results from studies on land use change are often conflicting, and the magnitude of the impact on SOM quality and quantity appears to depend on soil type, plantation age, forest species, geographical location and climate, among other factors.3,4 For instance, Balieiro et al.5 observed a decrease in soil C stock after 5 years of Eucalyptus introduction on a pasture area of a Planosol (RJ, Brazil). However, in subtropical highland soils under Pinus taeda plantation, both a rise in soil C stock in a Nitosol (SC, Brazil) after 20 years cultivation,6 as well as a depletion after 30 years of plantation in a Leptosol (RS, Brazil), was observed.2,7
Besides C stocks of whole soil, SOM chemical compartments may also serve as good indicators of the impact of afforestation on SOM dynamics.8,9Pinus plantation may decrease fulvic acid content,10 while Eucaplyptus can promote an elevation.11 Different results were obtained by Lima et al..8 The introduction of Eucalyptus in former degraded pasture areas promoted an increase in fulvic acids and humin stocks within the 0-10 cm layer of the Ferralsol located at a lower altitude, while an increase in humic acid stock up to a 20 cm depth was observed for the Ferralsol located at a higher altitude. The disparity in behaviour was attributed to different soil mineralogy (gibbsite and kaolinite proportions) and to the different microclimate in the two areas, with both factors affecting SOM decomposition rate and stabilization mechanisms.
Recently, further fractionation of the humin fraction has been proposed and the results obtained support the structural model of humic substances as supramolecular assemblages and micelar-like structures.12 After the extraction of humic and fulvic acids by means of alkaline solution, mixed solutions are used, such as NaOH + Urea, DMSO + H2SO4, DMSO + HCl and Acetone + HCl, and thereby different intra-aggregate organic bonds are broken stepwise.13-15
To date, most of the studies on the impact of exotic species plan-tation on SOM, comprising Brazilian regions, have focused mainly on its stocks or have emphasized Eucalyptus plantations. In a recent study investigating the impact of Pinus introduction on SOM of a Leptosol located in South Brazil, an increase in the chemical recal-citrance and carboxylic groups in the SOM structure was observed in addition to a decrease in C stocks, after 30 years of plantation.7 In order to complement the information about exotic species’ influence on SOM chemical composition of highland soils, we carried out this work, aiming to evaluate the impact of the introduction of Pinus taeda monoculture on the stocks of the different chemical compartments of SOM in a South Brazilian Cambisol. Soil chemical attributes and exchangeable cations were also evaluated.
EXPERIMENTAL Study area and sampling
samples were probed by means of a steel ring (2 cm high x 5 cm in diameter) to determine soil bulk density. Additionally, above ground grass material from the NP site and above ground pine needle litter from the pine sites were collected.
Chemical characteristics of soil and vegetation
All reagents employed were of p.a. grade. Soil chemical analyses were performed according to Tedesco et al..18 Soil pH was measured in distilled water (pHH2O) at a soil:solution ratio of 1:2.5. Exchangeable cations Ca+2, Mg+2 and Al+3 were extracted with 1.0 mol L-1 KCl so-lution (soil soso-lution ratio of 1:10; 30 min shaking) and quantified by atomic absorption spectroscopy (Perkin Elmer, 2380). Exchangeable K+ was extracted with Mehlich 1 solution (0.05 mol L-1 HCl + 0.0125 mol L-1 H
2SO4, at a pH from 2,0 to 3,0) by shaking the suspension (soil solution ration of 1:10) for 5 min and quantified in the extract by flame photometry (Digimed, NK 2000). The effective cation exchange capacity (CECE) was calculated by the sum of the four exchangeable cations and thereafter, the saturation of the CECE by Al (Alsaturation) was estimated. Potential acidity (H+ + Al+3) was estimated by titration with 0.025 mol L-1 NaOH solution after soil extraction with 0.5 mol L-1 Ca(CH
3COO)2 at pH 7.0. The chemical composition of vegetation samples was determined in acid extracts after sulfuric digestion of the dried samples employing the same equipment.18
Chemical fractionation of soil organic matter
Chemical fractionation of the SOM was adapted from the methods of Dick et al.19 and Song et al.14 employing p.a. grade reagents and performed in triplicate (Figure 1). For the removal of the particulate organic matter (POM) with density < 1.0 g cm-3 and simultaneous extraction of the non-humic substances, 50 mL of distilled water were added to 10 g soil and the system mechanically shaken for 2 h. The suspension was centrifuged (10 min, 15,000 g) and the supernatant filtered through a 0.45 µm paper membrane. This procedure was repeated three times. The POM retained in the filter was discarded and the extract containing the water-extractable non-humic substances (CW) was kept at 4°C, after the measurement of its total volume. The removal of POM was necessary since this SOM fraction contains partially decomposed vegetal residues that do not belong to the col-loidal fraction of SOM.
The remaining soil (POM free) was treated with 0.1 mol L-1 HCl
solution to remove the acid extractable non-humic substances (CHCL), following the same procedure described for water extraction. Both SOM fractions, CW and CHCl, are not considered part of the stabilized humic substances and most likely comprise a less recalcitrant SOM.14
Further fractionation of the humic substances was performed on the soil sample containing the colloidal SOM (CCO), i.e., soil sample free of POM and of non-humic substances. The separation of humic acid (AH) and fulvic acid (FA) was achieved by alkaline extraction, where 50 mL of NaOH 0.5 mol L-1 were added to 10 g of soil con-taining colloidal SOM (considered humified SOM here) sample and the suspension mechanically shaken for 3 h. The alkaline extract containing the extractable humic substances (CEHS) was separated by centrifugation (10 min, 15,000 g) and this procedure was repeated until the supernatant became limpid. Between 10 and 12 alkaline extractions were performed for the complete extraction of EHS. After measuring the total volume of the alkaline extract and removal of a 10 mL aliquot, the pH was adjusted to 2.0 with 4.0 mol L-1 HCl solution and the suspension allowed to rest for 24 h. Precipitated humic acid (HA) was separated from the fulvic acid (FA) by centrifugation (10 min, 15,000 g). The volume of FA extract was measured and kept at 4 °C for further analyses (CFA).
The fractionation of humin (HU) was performed on the remai-ning soil sample, by adding 50 mL of 0.1 mol L-1NaOH + 6.0 mol L-1 Urea (1:1 v/v) solution and shaking the suspension for 3 h. This mixed solution, employed after aqueous NaOH 0.5 mol L-1 extrac-tion, acts mainly on the H-bonds that aggregates the humin fraction. As a proton acceptor, urea interacts with the hydrogens of the HU aliphatic chains. Consequently, both the aggregation among organic structures and interactions between HU and the inorganic fraction due to H bonds are disrupted.15
The base/urea extract containing the less hydrophobic fraction of the HU (CHUI), namely, the humin fraction that has a hydrophobic intermediary nature between EHS (more hydrophilic) and HUH (more hydrophobic), was separated by centrifugation (10 min, 15.000 g). This procedure was repeated until the supernatant became limpid (6 extractions). The insoluble SOM after the urea/base extraction cons-titutes a more hydrophobic fraction of the humin (CHUH).
15 The HUI fraction is also referred to by some authors as the fraction comprising the “humic acid-like” and “fulvic acid-like” SOM.14
The residual soil containing the HUH fraction was washed three times with distilled water, dried at 60 °C and kept for further analyses. Soil demineralization with 10% HF solution
Demineralization of whole soil samples and of soil samples containing only the colloidal SOM was achieved by treating 10 g of sample with 30 mL of 10% (v/v) HF solution.20 The suspension was mechanically shaken for 2 h, centrifuged (10 min, 15,000 g), and the supernatant removed and appropriately discarded. This procedure was repeated seven times and thereafter the solid residue containing the enriched SOM (SOMHF) was washed three times with distilled water. This method is used to dissolve the inorganic matrix of the soil and thus to concentrate the organic fraction. Besides improving the resolution of the spectroscopic methods employed in the investigation of organic matter composition and structure, its results also provide some inferences about the organo-mineral association.7
Determination of C and N content in soil and chemical compartments and calculation of HF treatment indexes and C stocks
Contents of carbon and nitrogen in the vegetation residues, in whole soil (CT and NT), in SOMHF (CHF and NHF), in the sample Figure 1. Scheme of the chemical fractionation of the soil organic matter
containing only the colloidal organic matter (CCO andNCO), in the resi-due after EHS extraction (CHU) and in the residue after HUI extraction (CHUH), were determined by dry combustion (Perkin Elmer, 2400). Determination of CCO and NCO was carried out on dried soil samples which, in a separate experimental set, were previously extracted with distilled water and 0.1 mol L-1 HCl treatment (removal of POM and extraction of CW and CHCL) (Figure 1).
The concentration of C in water (CW), HCl (CHCl), alkaline (CEHS) and FA (CAF) extracts were determined by wet combustion, measuring the molecular absorption at 580 nm (PG Instruments) after 4 h of reaction at 60 °C with acid solution (K2Cr2O7 + H2SO4, 1.25 mol L
-1).21 The calibration curve was prepared with 6 solutions of D-fructose with concentrations ranging from 0 to 200 mg C L-1.
The amount of C contained as humic acid (CHA) was calculated by the difference: CEHS - CAF. The concentration of low molecular weight SOM (CLMW) was estimated by the sum: CW + CHCl. The C amount occurring in the form of the less hydrophobic humin (CHUI) was obtained by the difference: CHU - CHUH.
The ratios CT:NT and CHF:NHF were calculated and thereafter the R factor (R and RCO) was estimated. The R factor is the C:N ratio before and after HF treatment.22 The recovery of C after HF treatment (CR) was calculated using the Equation 1.
CR(%) = MR(%) x (CHF/CT) (1)
Here, MR is the proportion of mass remaining after HF treatment in oven dried samples at 60 °C. The enrichment in C and N after HF treatment of whole soil (CE and NE) and of the sample containing only colloidal SOM (CECO and NECO), was calculated by dividing the element content in the treated sample by its content in the untreated sample. The recovery of C after HF treatment of whole soil and of the sample containing only the colloidal SOM was calculated by Equation 2.
CR (%) = MR(%) x [CHF/ (CT or CCO)]. (2) The C and N stocks (Mg ha-1) in whole soil and the different chemical compartments were calculated according to Sisti et al.23 by Equation 3.
Element stock = Element concentration in the sample x BD x tl. (3) BD is the bulk soil density (Mg m-3) of the reference environment
(NP) and tl is the thickness of the analyzed layer (m). Data analyses
The data analyses were performed following a random factor using a split-plot design. The environments (NP, P10, P14) were con-sidered as treatments, i.e. main plots. The depths were concon-sidered as sub-treatments (sub-plots).7,24 The stock results of the different SOM chemical compartments (CT, NT, CCO, NCO, CFA, CHA, CHUI,CHUH and CLMW) and those of the C:N ratios were submitted to variance analyses (two-way ANOVA) to verify the differences between environments and soil depths and the occurrence of interactions among environ-ments and soil depths. The mean values obtained were analysed by the Bonferroni test at a 5% significance level. The results of the chemical properties of soil and vegetation and of the soil bulk density were analysed as mean values and standard deviation. The indexes obtained from the HF treatment were not submitted to statistical analyses, as the HF treatment was performed in composite samples.
RESULTS AND DISCUSSION
Chemical characteristics of soil and vegetation
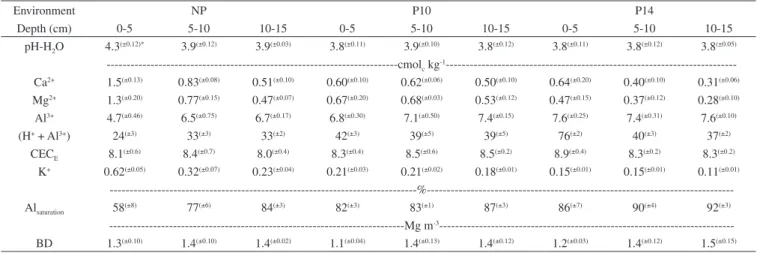
The studied soils were acidic and presented similar CECE re-gardless of the environment and soil depth (Table 1). Differences in chemical characteristics were found mainly in the 0-5 cm layer: in the NP environment, pH level was higher, contents of exchangeable Ca+2 and Mg+2 were greater and exchangeable Al+3 lower, than in P10 and P14. Consequently, Al saturation and potential acidity were lower in the surface layer under NP (Table 1). Acidification of the topsoil following pine afforestation has also been reported in other Brazilian subtropical highland regions.2
On the other hand, content of exchangeable K+ was affected in all soil layers by the change of in land use, with the lowest values found in Pinus environments. Soil bulk density ranged from between 1.1 and 1.5 Mg m-3 and did not differ among the studied environments (Table 1).
Regarding the above-ground vegetation, pine needles contained more C but were, in general, depleted in nutrients (Table 2). Besides the high nutrient exportation through wood harvesting,25 the low contents of exchangeable cations observed in P10 and P14 can also be attributed to the lower nutrient input by means of litter decompo-sition, in comparison to grassland vegetation.
Table 1. Soil pH, exchangeable cations, potential acidity (H+ + Al+3), effective cation exchange capacity (CECE), Al+3 saturation of the CECE and bulk density
(BD) of three soil layers of a Cambisol under native pasture (NP) and under Pinus taeda with 10 (P10) and 14 (P14) years of planting, Lages, SC, Brazil (n=3)
Environment NP P10 P14
Depth (cm) 0-5 5-10 10-15 0-5 5-10 10-15 0-5 5-10 10-15
pH-H2O 4.3
(±0.12)* 3.9(±0.12) 3.9(±0.03) 3.8(±0.11) 3.9(±0.10) 3.8(±0.12) 3.8(±0.11) 3.8(±0.12) 3.8(±0.05)
---cmolc kg
-1
---Ca2+ 1.5(±0.13) 0.83(±0.08) 0.51(±0.10) 0.60(±0.10) 0.62(±0.06) 0.50(±0.10) 0.64(±0.20) 0.40(±0.10) 0.31(±0.06) Mg2+ 1.3(±0.20) 0.77(±0.15) 0.47(±0.07) 0.67(±0.20) 0.68(±0.03) 0.53(±0.12) 0.47(±0.15) 0.37(±0.12) 0.28(±0.10) Al3+ 4.7(±0.46) 6.5(±0.75) 6.7(±0.17) 6.8(±0.30) 7.1(±0.50) 7.4(±0.15) 7.6(±0.25) 7.4(±0.31) 7.6(±0.10)
(H+ + Al3+) 24(±3) 33(±3) 33(±2) 42(±3) 39(±5) 39(±5) 76(±2) 40(±3) 37(±2)
CECE 8.1
(±0.6) 8.4(±0.7) 8.0(±0.4) 8.3(±0.4) 8.5(±0.6) 8.5(±0.2) 8.9(±0.4) 8.3(±0.2) 8.3(±0.2)
K+ 0.62(±0.05) 0.32(±0.07) 0.23(±0.04) 0.21(±0.03) 0.21(±0.02) 0.18(±0.01) 0.15(±0.01) 0.15(±0.01) 0.11(±0.01) ---%---Alsaturation 58
(±8) 77(±6) 84(±3) 82(±3) 83(±1) 87(±3) 86(±7) 90(±4) 92(±3)
C stocks and distribution of SOM chemical compartments With respect to whole soil, colloidal SOM and SOM chemical compartments, ANOVA showed interaction between environment and depth (Fischer’s test, p>0.01), and all variables will be discussed as a function of these two factors.
The soil under the older Pinus plantation (P14) presented greater soil C stock (CT) in the 0-5 cm layer compared to P10 and NP (Table 3), whereas in the deeper layers no difference in CT was observed between the environments. These results are in disagreement with those found for a Nitisol from the same physiographic region, where a depletion of C stocks up to a 15 cm depth following 30 years of Pinus taeda afforestation was observed.2 This discrepancy may stem from differences in soil type, microclimate, and even from the different forest management system, among the different studies.
After POM removal, C stocks in the soil decreased for all layers. Similarly to CT, stocks of C contained in colloidal SOM (CCO) from the surface layer varied in the order NP<P10<P14 (Table 3). It follows that soil C accumulation following afforestation occurred both as particulate SOM and as humified SOM (colloidal SOM). C stored as POM with density < 1.0 g cm-3 (C
T - CCO) in the 0-5 cm layer corresponded to 50 Mg C ha-1 in P14 and 17 Mg C ha-1 in NP. In the sub-surface layers the contribution of POM varied between 4 and 9 Mg C ha-1.
The greater C stock as particulate SOM found in the 0-5cm layer in P14 can be related to the lower decomposition rate of the pine litter,26 which likely derives from its high chemical recalcitrance (in-dicated by high C:N) and lower nutrient content (Table 2). However,
other local factors such as microclimate, soil type and harvest sys-tem25,27 may play an important role on soil C accumulation for land under exotic species plantations, since both increase and decrease in soil C stocks have been observed in highland areas within 180 km off the present study site after 12 and 8 years, respectively, of Pinus introduction.6 Nevertheless, the increase in C stocks as humified SOM (CCO) in P14 observed in the present study can be attributed to a higher C concentration in the aboveground vegetal residue (Table 2), from which the colloidal SOM originates.
After afforestation, N stocks (NT) decreased (P14) or increased (P10) and tended to be lower in the subsurface layer of the P14 en-vironment (Table 3). However, CT:NT ratio increased gradually from NP<P10<P14, indicating a relative impoverishment of N-containing groups in the SOM with increased afforestation time. After removal of POM, C:N values were lower in all environments (CCO:NCO) and did not differ amongst each other, suggesting that the disparity found in CT:NT ratio is caused mainly by POM composition. Considering that POM chemical composition most closely resembles the original vegetation residue (Table 2), the greater CT:NT values found under P14 (Table 4) were not surprising. In the older pine plantation, the gradual decrease in CCO:NCO ratio with depth indicates that the in-fluence of pine vegetation on the chemical composition of colloidal SOM occurred mainly in the surface layer. Our results are in line with the findings of Wiesmeier et al.2 in Cambisols from south Brazil, who confirmed, by means of δ13C isotope ratio determination, a significant contribution of pine residues to colloidal SOM only in the first 5 cm of soil after 30 years of Pinus taeda introduction. The relative N-depletion reported in the cited study was attributed
Table 2. Chemical composition of the vegetation samples collected on a Cambisol under native pasture (grass) and under Pinus taeda (pine needles), Lages,
SC, Brazil (n=3)
Vegetation C N P K Ca Mg C:N
---g kg-1
---Pine needles 465(±6)* 5.5(±0.5) 0.4(±0.06) 0.8(±0.1) 5.1(±0.6) 1.2(±0.2) 85(±7)
Grass 373(±10) 8.2(±3) 1.3(±0.3) 14(±3) 3.6(±0.5) 4.0(±0.3) 50(±19)
*: mean ± standard deviation.
Table 3. C and N stocks and C:N ratio of chemical compartments of SOM of three layers of a Cambisol under native pasture (NP) and under Pinus taeda with
10 (P10) and 14 (P14) years of planting, Lages, SC, Brazil (n=3)
Environment NP P10 P14
Depth (cm) 0-5 5-10 10-15 0-5 5-10 10-15 0-5 5-10 10-15
---Mg ha-1
---CT 46
Ba 34 Aab 29 Ab 38 Ba 36 Aa 34 Aa 109 Aa 37 Ab 36 Ab
NT 1.8 Aa 1.8 Aa 1.5 Aba 1.1 Bb 1.1 Cb 1.8 Aa 2.1 Aa 1.4 Bb 1.3 Bb
CLMW 0.6 Bc 1.3 Ab 1.5 Aba 1.3 Ab 0.9 Bc 1.8 Aa 1.1 Ab 0.7 Bc 1.4 Aa
CCO 29
Ca 28 Aab 25 Ab 35 Ba 30 Aa 29 Aa 59 Aa 29 Ab 25 Ab
NCO 2.2 Aa 1.3 Aa 1.2 Aa 2.7 Aa 1.4 Aa 2.0 Aa 2.3 Aa 1.4 Ab 1.8 Aab
CEHS 18
Ca 20 Aa 19 Aa 22 Ba 17 Aa 16Aa 31 Aa 14 Ab 4.0 Bc
CFA 7.2
Ba 6.4 Aa 5.2 Aba 10 Ba 6.5 Aa 6.6 Aa 15 Aa 6.9 Ab 1.9 Bb
CHA 11 Ba 13 Aa 14 Aa 12Aba 11 ABa 9.5 Aa 16 Aa 7.2 Bb 2.2 Bb
CHUI 3.3
Ba 2.5 Ab 2.4 Cb 1.7 Bb 4.0 Ab 8.6 Ba 15 Aa 6.2 Ab 13 Aa
CHUH 8.1 Ba 6.2 Aab 3.8 Ab 11Aba 9.3 Aa 3.1 Ab 13 Aa 8.9 Aa 7.6 Aa
---CT:NT 25
Ba 18 Ba 19 Ba 34 Ba 34 Aa 19 Bb 53 Aa 26 ABb 28 Ab
CCO:NCO 11 Aa 15 Aa 15 Aa 10 Aa 16 Aa 12 Aa 20 Aa 14 Ab 10 Ac
to a lower soil N-input through alteration of N-depleted litter and to suppression of N-fixing grassland legumes by the forest plantation. Decrease of soil N stocks due to vegetation change from pasture to forest Pinus has also been reported by Guo et al.3 in 10-year-old afforested areas.
The organic compounds extracted with distilled water and with 0.1 mol L-1 HCl are related to microbial activity, and this compartment (CW + CHCl) is usually assigned to organic compounds that present lower molecular weight than the HS (CLMW).
28 The C
LMW stocks in-creased with depth for NP (Table 3). This behavior may be caused by compound migration along the profile, promoted by the high precipitation in the region of around 1,550 mm year-1.16 Also, a higher turnover rate of these more labile structures by microorganism due to their greater activity in the upper layer may account for the lower CLMW stocks at the 0-5 cm layer in comparison to the deeper layers.
29
A different behavior was observed in both pine plantations, where lower CLMW stock was found in the 5-10 cm layer (Table 4). The thick litter layer usually found under pine plantations2 possibly partially blocks entry of rain water into the profile and thus decreases SOM percolation.
The change in SOM dynamics promoted by pine introduction to original grasslands areas was also evidenced in other SOM che-mical compartments. The C stocks of the NaOH-extractable humic substances (CEHS) under grassland were relatively uniform within the 15 cm depth and were around 18 Mg ha-1 (Table 3). Regarding the 0-5 cm layer of all environments, CEHS stock values increased in the order NP<P10<P14. A gradual decrease of CEHS stock with depth was observed under P14 with the lowest value was observed in the 10-15 cm layer (Table 3). The tendency for variation in CEHS stocks in P14 is due to changes in both HA and FA stocks: in the surface layer CHA and CFA were 16 and 15 Mg ha
-1, respectively; while in the 10-15 cm layer the observed values were as low as 2.2 and 1.9 Mg
ha-1. In contrast to P14, C stocks of HA and of FA under P10 and NP tended to remain constant along the profile.
In the 0-5 cm layer, stocks of the humin fractions, CHUI and CHUH, were greater in P14 compared to NP (Table 3), following the beha-vior shown by HA and FA in this layer. These results show that the increase in soil C stocks with time under Pinus at 5 cm occurs due to an increase in all humic fractions. Increases in C stocks of HA, FA and humin fractions at 0-5 cm in Pinus areas in relation to pasture were also observed by Lima et al.9 in Ferralsols located at different altitudes in the state of Minas Gerais.
In general, the lowest values for CHUI, humin fraction with an intermediary hydrophobic character between EHS and HUH, were found under NP where a slight decrease with depth was observed. Under P14, an enrichment of CHUI was observed both in the upper as well as deeper layers, while under P10 a gradual increase in CHUI with depth occurred. With respect to the more hydrophobic humin fraction (HUH), CHUH stocks decreased gradually with depth in NP and P10 environments, while under P14 the stocks did not differ within the analysed layers (Table 3). Considering the behavior of all humic fractions, the P10 environment seems to represent a transition between the influences of the two vegetation types on SOM chemical compartments.
While in the surface layer, Pinus afforestation promoted an incre-ase in soil C stock in both hydrophilic (HA + FA) and hydrophobic (HUI + HUH) humic fractions, in subsurface only, the distribution of chemical compartments was altered by the change in soil use. In the 10-15 cm layer, a decrease in the EHS fraction and a simultaneous increase in the HUI fraction after 14 years of Pinus introduction points to an enrichment of more hydrophobic structures to the de-triment of hydrophilic structures. This result might be related to a comparatively greater content of lignin and hydrophobic compounds in the Pinus residue.30
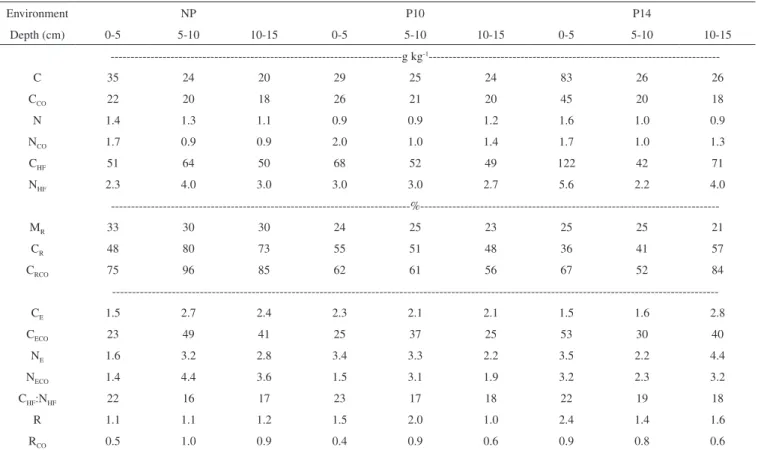
Table 4. C and N contents of whole soil (C and N), of samples containing only colloidal SOM (CCO and NCO) and of SOMHF, and indexes derived from the HF
treatment in three layers of a Cambisol under native pasture (NP) under Pinus taeda with 10 (P10) and 14 (P14) years of planting, Lages, SC, Brazil (n=3)
Environment NP P10 P14
Depth (cm) 0-5 5-10 10-15 0-5 5-10 10-15 0-5 5-10 10-15
---g kg-1
---C 35 24 20 29 25 24 83 26 26
CCO 22 20 18 26 21 20 45 20 18
N 1.4 1.3 1.1 0.9 0.9 1.2 1.6 1.0 0.9
NCO 1.7 0.9 0.9 2.0 1.0 1.4 1.7 1.0 1.3
CHF 51 64 50 68 52 49 122 42 71
NHF 2.3 4.0 3.0 3.0 3.0 2.7 5.6 2.2 4.0
---%---MR 33 30 30 24 25 23 25 25 21
CR 48 80 73 55 51 48 36 41 57
CRCO 75 96 85 62 61 56 67 52 84
---CE 1.5 2.7 2.4 2.3 2.1 2.1 1.5 1.6 2.8
CECO 23 49 41 25 37 25 53 30 40
NE 1.6 3.2 2.8 3.4 3.3 2.2 3.5 2.2 4.4
NECO 1.4 4.4 3.6 1.5 3.1 1.9 3.2 2.3 3.2
CHF:NHF 22 16 17 23 17 18 22 19 18
R 1.1 1.1 1.2 1.5 2.0 1.0 2.4 1.4 1.6
Organo-mineral interactions and SOM lability
Soil demineralization with 10% HF solution, besides concen-trating the SOM for further spectroscopic analysis, may also yield some relevant information about SOM liability and organo-mineral interactions. With the dissolution of the minerals due to HF treatment, the organic matter adsorbed on their surfaces enters solution and is removed from the system by the centrifugations procedures.22 This fraction is considered a more labile SOM since it is not self-associated in organic micelles, which behaves as a macromolecule. Therefore, C loss due to HF treatment is usually related to SOM associated to mineral surfaces.22,28
As expected, C and N contents of whole soil (C and N), in all three environments, increased after HF treatment (Table 4) indicating that the inorganic components were mostly dissolved.7
The recovered mass (MR) after HF treatment of whole soil ranged from between 21 and 33% and these results are related to the samples’ sand (granulometric fraction with diameter < 53 µm) content which was around 40%. Quartz grains occurring in the sand fraction are more resistant to HF treatment and tend to remain in the sample; while the minerals contained in clay (< 2 µm) and silt (2- 53 µm) fractions are preferentially dissolved.31 The recovery of C from whole soil (C
R) ranged from 36 to 80% and that of the POM free sample (CRCO) from 52 to 96% (Table 4). Values of CR greater than 95% indicate that no relevant C loss occurred during the HF treatment.22 These values are in line with previously reported CR values for Brazilian soils.
7,22 For a given sample, CR was always smaller than CRCO, and this result shows that during the HF treatment of the whole soil sample, a loss of POM by floatation and removal of CLMW by the centrifugations occurred.
The enrichment factor for C and N of the whole soil ranged from between 1.5 and 2.8 (CE) and from 1.6 to 4.4 (NE), respectively. Similarly to C recovery results, greater values were observed for the POM-free SOM (23 to 53 for CECO and 1.4 to 4.4 for NECO) (Table 4), corroborating a greater C loss in whole soil due to HF treatment. The R factor, yielding C:N ratio before and after HF treatment, ranged from between 1.0 and 2.4 for whole soil (Table 4). The greater values found in the upper layer of the Pinus environments in compa-rison to the grassland environment (Table 3) are a consequence of the relevant removal of particulate SOM by HF treatment in the former environments (Table 2), whose vegetation hads a higher C:N ratio than the grassland. However, the R factor of the POM-free SOM, RCO, was consistently less than or equal to 1. Considering that RCO stems almost exclusively from colloidal SOM, it follows that under the NP environment a preferential loss of nitrogen compounds due to HF treatment occurred in the upper layer. This result is indicative of the occurrence of a more labile SOM in this layer that is easily dissolved by acid treatment. At deeper layers, no preferential loss of either N or C compounds of colloidal SOM was observed under native pasture (Table 4). The opposite behavior was observed in the P14 environment: RCO was higher at the surface and decreased with depth, indicating preferential loss of N compounds in the deeper layer with the HF treatment (Table 4). It follows that in the P14 environ-ment the more labile organic compounds are found at the 10-15 cm layer and are probably adsorbed at the mineral surfaces. By contrast in the surface layer, the compounds are more recalcitrant and less associated to the minerals. These results are in line with the previous discussion about the enrichment of recalcitrant structures under Pinus plantation in the upper layer.
From the comparison of HF indexes obtained from whole soil with those obtained from POM-free soil, it follows that inferences from these indexes should be made with care, especially if the soil samples contain considerable amounts of particulate SOM.
CONCLUSIONS
The switch in land use from pasture to Pinus taeda monoculture modified soil chemical properties. The introduction of Pinus increased soil acidity and exchangeable Al+3 and impoverished the soil in terms of nutrients. The SOM dynamic was also affected: whole soil C stocks increased during 14 years of Pinus cultivation in the 0-5 cm layer. This increment was not selective for a given chemical compartment since it occurred for all humic fractions and in particulate organic matter. In subsurface layers, pine vegetation promoted a redistribution of SOM from a more hydrophilic to a more hydrophobic chemical compartment.
The introduction of Pinus in pasture areas also affected the inte-ractions of SOM in the soil. Under Pinus, the association of colloidal SOM with minerals was relevant in deeper layers, while at the surface, a self-association of the organic structures seems to predominate. By contrast, under the native pasture environment, organo-mineral association was relevant in the surface layer.
ACKNOWLEDGEMENTS
The authors thank FAPERGS, CNPQ and CAPES for fellowships and financial support. We are also grateful to Prof. Dr. C. B. da Silveira for the support in collecting soil samples and to Prof. Dr. A. Macedo for providing the study area, both from UDESC, SC.
REFERENCES
1. http: www.sbs.org.br/publicacoes.htm, accessed in May 2011. 2. Wiesmeier, M.; Dick, D. P.; Rumpel, C.; Dalmolin, R. S. D.; Hilscher,
A.; Knicker, H.; Eur. J. Soil Sci.2009,60, 347.
3. Guo, L. B.; Wang, M.; Gifford, R. M.; Plant and Soil2007,299, 251. 4. Djukic, I.; Zehetner, F.; Tatzber, M.; Gerzabek, M. H.; J. Plant Nutri.
Soil Sci.2010, 173, 30.
5. Balieiro, F. C.; Pereira, M. G.; Alves, B. J. R.; Resende, A. S.; Franco, A. A.; R. Bras. Ci. Solo2008, 32, 1253.
6. Mafra, A. L.; Guedes, S. F. F.; Klauberg-Filho, O.; Santos, J. C. P.; Almeida, J. A.; Rosa, J. D.; R. Árvore2008, 32, 217.
7. Dick, D. P.; Leite, S. B.; Dalmolin, R. S. D.; Almeida, H. C. A.; Knicker, H.; Sci. Agri. 2011, 68, 175.
8. Lima, A. M. N.; Neves, J. C. L.; Novais, R. F.; Barros, N. F.; Mendonça, E. S.; Smyth, T. J.; Moreira, M. S.; Leite, F. P.; F. Ecol. Manag. 2006, 235, 219.
9. Lima, A. M. N.; Silva, I. R.; Neves, J. C. L.; Novais, R. F.; Barros, N. F.; Mendonça, E. S.; Demolinari, M. S. M.; Leite, F. P.; R. Bras. Ci. Solo
2008,32, 1053.
10. Chen, C. R.; Xu, Z. H.; Mathersb, N. J.; Soil Sci. Soc. Am. J.2004,68, 282.
11. Schiavo, J. A.; Busato, J. G.; Martins, M. A.; Canellas, L. P.; Sci. Agri.
2009,66, 353.
12. Piccolo, A.; Adv. Agron. 2002, 75, 57.
13. Spaccini, R.; Mbaqwu, J. S. C.; Conte, P.; Piccolo, A.; Geoderma2006, 132, 9.
14. Song, G.; Novotny, E. H.; Simpson, A. J.; Clapp, C. E.; Hayes, M. H. B.; Eur. J. Soil Sci.2008, 59, 505.
15. Song, G.; Hayes, M. H. B.; Novotny, E. H.; Simpson, A .J.; Naturwis-senschaften2011,98, 9.
16. Bertol, I.; Schick, J.; Batistela, O.; Leite, D.; Visentin, D.; Cogo, N. P.; R. Bras. Ci. Solo2002, 26, 455.
17. Embrapa; Sistema Brasilero de Classificação de Solos, Embrapa Solos: Rio de Janeiro, 2006.
19. Dick, D. P.; Gomes, J.; Rosinha, P. B.; R. Bras. Ci. Solo1998, 22, 603. 20. Gonçalves, C. N.; Dalmolin, R. S. D.; Dick, D. P.; Knicker, H.; Klant,
E.; Koegel-Knabner, I.; Geoderma2003,116, 373.
21. Dick, D. P.; Burba, P.; Herzog, H.; J. Braz. Chem. Soc.1999, 10, 140. 22. Dick, D. P.; Gonçalves, C. N.; Dalmolin, R. S. D.; Knicker, H.; Klamt,
E.; Kögel-Knabner, I.; Simoes, M.L.; Martin–Neto, L.M.; Geoderma
2005, 124, 319.
23. Sisti, C. P. J.; Santos, H. P.; Kohhann, R.; Alves, B. J. R.; Urquiaga, S.; Boddey, R. M.; Soil Till. Research2004, 76, 39.
24. Ruiz-Navaro, A.; Barberá, G. G.; Navarro-Cano, J. A.; Albaladejo, J.; Castillo, V. M.; Geoderma2009,153, 353.
25. Hernández, J.; Pino, A.; Salvo, L.; Arrarte, G.; F. Ecol. Manag. 2009, 258, 92.
26. Jandl, R.; Lindner, M.; Vesterdal, L.; Bauwens, B.; Baritz, R.; Hagedorn, F.; Johnson, D. W.; Minkkinen, K.; Byrne, K. A.; Geoderma2007,137, 253.
27. Baritz, R.; Seufert, G.; Montanarella, L.; Ranst, E. V.; F. Ecol. Manag.
2010, 260, 262.
28. Potes, M. L.; Dick, D. P.; Dalmolin, R. S. D.; Knicker, H.; Rosa, A. S.; R. Bras. Ci. Solo2010,34, 23.
29. Gama-Rodrigues, E. F.; Gama-Rodrigues, A. C.; Barros, N. F.; R. Bras. Ci. Solo 1997, 21, 361.
30. Ciampa, A.; Benedetti, A.; Sequi, R.; Valentini, M.; Agrochimica2009, 53, 41.