Discrete Logic Modelling Optimization to
Contextualize Prior Knowledge Networks
Using PRUNET
Ana Rodriguez☯, Isaac Crespo☯, Ganna Androsova, Antonio del Sol *
Luxembourg Centre for Systems Biomedicine (LCSB), University of Luxembourg, Luxembourg ☯These authors contributed equally to this work.
Abstract
High-throughput technologies have led to the generation of an increasing amount of data in different areas of biology. Datasets capturing the cell’s response to its intra- and extra-cellular microenvironment allows such data to be incorporated as signed and directed graphs or influence networks. These prior knowledge networks (PKNs) represent our cur-rent knowledge of the causality of cellular signal transduction. New signalling data is often examined and interpreted in conjunction with PKNs. However, different biological contexts, such as cell type or disease states, may have distinct variants of signalling pathways, result-ing in the misinterpretation of new data. The identification of inconsistencies between mea-sured data and signalling topologies, as well as the training of PKNs using context specific datasets (PKN contextualization), are necessary conditions to construct reliable, predictive models, which are current challenges in the systems biology of cell signalling. Here we present PRUNET, a user-friendly software tool designed to address the contextualization of a PKNs to specific experimental conditions. As the input, the algorithm takes a PKN and the expression profile of two given stable steady states or cellular phenotypes. The PKN is iter-atively pruned using an evolutionary algorithm to perform an optimization process. This opti-mization rests in a match between predicted attractors in a discrete logic model (Boolean) and a Booleanized representation of the phenotypes, within a population of alternative sub-networks that evolves iteratively. We validated the algorithm applying PRUNET to four bio-logical examples and using the resulting contextualized networks to predict missing expression values and to simulate well-characterized perturbations. PRUNET constitutes a tool for the automatic curation of a PKN to make it suitable for describing biological process-es under particular experimental conditions. The general applicability of the implemented al-gorithm makes PRUNET suitable for a variety of biological processes, for instance cellular reprogramming or transitions between healthy and disease states.
a11111
OPEN ACCESS
Citation:Rodriguez A, Crespo I, Androsova G, del Sol A (2015) Discrete Logic Modelling Optimization to Contextualize Prior Knowledge Networks Using PRUNET. PLoS ONE 10(6): e0127216. doi:10.1371/ journal.pone.0127216
Academic Editor:Julio Vera, University of Erlangen-Nuremberg, GERMANY
Received:September 5, 2014
Accepted:April 13, 2015
Published:June 9, 2015
Copyright:© 2015 Rodriguez et al. This is an open access article distributed under the terms of the Creative Commons Attribution License, which permits unrestricted use, distribution, and reproduction in any medium, provided the original author and source are credited.
Data Availability Statement:All relevant data are within the paper, its Supporting Information files and athttp://prunet.sourceforge.net/
Funding:The authors received no specific funding for this work.
Introduction
The wealth of experimental data from high-throughput technologies in different areas of biolo-gy allows such data to be incorporated as networks of interactions. Gene regulatory networks (GRNs) can be reconstructed based on knowledge resources such as literature or specific data-bases, the so called prior knowledge (PKN,) or purely from specific experimental datasets by inferring functional interactions between statistically correlated levels of biological entities such as genes or proteins.
PKNs are inclusive by nature because they usually merge altogether interactions previously described in different biological contexts such as different cell types, tissues or experimental conditions in the attempt to collect all relevant biological events. In addition, they suffer from undetermined network incompleteness, which is biased due to historical reasons. PKNs are available in specific databases [1–3] or can be constructed using dedicated software tools. A number of both commercial and free software resources are available to assist with the recon-struction of PKNs, for example Pathway Studio (www.elsevier.com/online-tools/pathway-studio), Ingenuity Pathway Analysis (www.ingenuity.com), Metacore (www.thomsonreuters. com/metacore), Transfac (www.biobase-international.com/product/transcription-factor-binding-sites) and GenMania (www.genemania.org).
On the other hand, there are a number of methods to infer networks purely from data through reverse engineering based on statistical correlation or mutual information, such as the structural equation model (SEM) [4], the graphical Gaussian model (GGM) [5–7], the algo-rithm for the reconstruction of accurate cellular networks (ARACNE) [8,9] and context likeli-hood of relatedness (CLR) [10]. In general, these methods are comprehensive (to the same extent as the experimental technique used to collect the data) and strongly contextualized to the experimental conditions. However, these networks lack directionality and usually yield a number of‘false’interactions because of the statistical co-occurrence of events that are not due to cause-effect relationships and indirect correlations (if‘A’has an effect on‘B’and‘B’has an effect on‘C’, we may observe a statistical correlation between‘A’and‘C’which is not a direct cause-effect relationship). Despite the attempt to remove these indirect interactions exploiting partial correlations [5–7,11], conditional mutual information [12,13] or data processing in-equality [8,9], this important issue still hinders the elucidation of the underlying mechanisms (the causal network) and decreases the reliability of the predictions of models based on these networks. Some network inference methods tackle the problem of directionality. For example, Nested Effects Models (NEMS) [14–18] use the nested structure of phenotypic effects caused by different knockdowns to infer a hierarchy of genes under the assumption that the knock-down of a gene B produces a subset of the effects observed after the knockknock-down of gene A if gene B is downstream in the hierarchy. Consequently, an inferred interaction between these two genes has the direction from A to B. However, NEMs have severe limitations in regard to large networks and cannot handle combinatorial knockdowns and complex network topologies (with feedback and feed-forward loops). To address these limitations Deterministic Effects Propagation Networks (DEPNs) [19] were developed. DEPNs assume deterministic signaling in the underlying network and alternative network topologies are scored based on the measure-ment distribution of active and inactive proteins, which are estimated from data using maxi-mum likelihood inference or maximization of the posterior distribution. A limitation of DEPN models is that multiple incoming edges to a node are always integrated in‘AND’functions; the model does not consider other logic relationships.
relationship such as responses to single or multiple perturbations (for example, cellular re-sponses to specific growth factors, cytokines or transcription factors).
In an attempt to overcome the drawbacks mentioned above, methods that combine infor-mation from the literature and experimental data to reconstruct biological networks have been proposed [20–31]. Combinatorial optimization methods have been proposed to address the network inference problem from perturbation data and PKNs. Using an integer programming strategy, Ourfali et al. [26] proposed a method that combines expression measurements after knockout experiments with a PKN to reconstruct regulatory pathways in yeast. Similarly, Lan et al. [27] linked genetic and transcriptomics data with previously known interactions. Howev-er, Hashemikhabir et al. [28] recently showed that even with an almost correct PKN, finding the minimum number of network topology changes that makes the model consistent with ex-perimental data is an NP complete problem. The complete enumeration of the solution space becomes infeasible for n>6 [14,32]. Knapp et al [29] proposed a formulation of the network
in-ference problem as a non-integral linear program that can be solved with polynomial time solv-ers. Edges have continuous weights, and the decision about the inclusion of a given edge in the final network is based on a heuristic decision using a threshold discretization. Prior knowledge about known interactions or the nature of nodes (for example, if they are ligands or receptors) can be used to formulate additional constraints. However, these models always assume‘OR’
functions between multiple regulators of the same node, and the method cannot handle‘AND’
logic functions because the model becomes nonlinear.
Within the group of linear programming-based approaches, it is worth mentioning SigNet-Trainer [30], a freely available toolbox that uses integer linear programming on PKNs to en-code constraints on the qualitative behaviour of the nodes. SigNetTrainer looks for the optimal subgraph of the given PKN that best reflects the measurements from a set of experimental sce-narios. Within the Results and discussion section, SigNetTrainer is compared with the method proposed in this work.
Some heuristic approaches based on discrete logic modelling have been proposed to address the computational limitations of combinatorial optimization methods. These heuristic meth-ods can be roughly classified into those designed to model the dynamics of signalling pathways [20,21], and those oriented to the description of the stable steady-states of biological networks (attractors), for instance stable expression profiles of GRNs. The first group of methods, which includes freely available implementations such as CellNOptR [25] and MetaReg [24], requires multiple perturbation (stimulus-response) experiments to optimize and/or expand canonical signalling pathways. CellNOptR takes as the input a PKN that is translated to a superstructure of Boolean networks within which the optimal submodel fitting perturbation data at best is identified. CellNOptR was compared with the method proposed in this work (seeResults and discussionsection). The MetaReg platform offers a model refinement tool to enhance the fit-ness between experimental data and model predictions, but it is oriented to optimize just the logic functions and assumes a fixed network topology. Similarly, IRIS [31] uses an iterative ap-proach to map gene expression profile values (both steady-state and time course) into discrete states and a simple probabilistic method to infer the regulatory logic of a given PKN rather than the topology itself.
Methods in the second group (steady-states oriented) [22,23] usually require a smaller num-ber of experimental measurements of the attractor states, such as gene expression data or pro-tein levels, although their predictions are strongly contextualized to these states.
prescribed set of attractors without previous information about connectivity. This prescribed set of attractors is derived from experimental observations assumed as steady states.
Within the group of methods combining PKN and experimental data oriented to the de-scription of steady states, it is worth noting the strategy proposed by Layek et al. [22], which ex-ploits the agreement between observed and computed attractors to assess possible subnetworks in the original PKN, however this strategy lacks an optimization method to improve these sub-networks, whereas Crespo et al. [23] proposed an evolutionary algorithm for this purpose that has been successfully applied in several published works [35–37].
It is also worth mentioning here another related strategy that can be applied to combine PKNs and experimental data, the so-called probabilistic Boolean networks (PBNs) [38]. Basi-cally, PBN is a hybrid approach to describe the dynamics of biological networks that is placed intermediately between purely probabilistic methods, such as Bayesian networks [39], and Boolean networks. PBNs consider alternative Boolean functions for each node, which depend both on the topology and the relationships between co-regulators. The probability that a given subset of Boolean functions is applied when simulating the dynamics of the system is derived from experimental data in a variety of biological contexts. The main difference that distin-guishes the method presented in this work and PBNs is that the latter one attempts to integrate different biological contexts in a single model whereas the algorithm presented in this work yields a population of alternative models that are context-specific. These context-specific mod-els can be considered as a special case of the PBNs and require less experimental data and com-putation. These models cannot address the biological uncertainty but they can be considered as descriptors of the average behavior of the system in a particular biological context.
Here we present PRUNET, a user-friendly software tool to address the contextualization of PKNs using a Booleanized representation of observed expression profiles corresponding to sta-ble phenotypes. Consequently, PRUNET can be included among the heuristic methods based on discrete logic modelling and oriented to the description of the steady states (attractors) of a biological network.
PRUNET differs from its most closely related method, the one proposed by Crespo et al. [23], in that it uses a more efficient optimization strategy; instead of exploring the entire search space of attractors, PRUNET assigns the expression profiles as initial conditions and updates the system until it falls into an attractor, which is compared with the initial conditions. This strategy rests on the assumption that a network state belonging to the basin of attraction of a given attractor is more similar to this attractor (in Hamming distance terms) than to any other attractor in the attractor space. The validation of the utility of this central assumption is the main contribution of this work and it represents a significant improvement upon other previ-ously published algorithms. Following this strategy PRUNET avoids the construction of the reachability graph. In addition, PRUNET encodes the regulatory logic functions as a system of algebraic equations, instead of as a binary decision diagram (whose construction is very com-putationally demanding for big networks). Using this strategy, PRUNET reduces dramatically the computational time and contextualizes networks of thousands of nodes, whereas the imple-mentation of Crespo et al. [23] and other similar software, such as CellNOptR [25], are limited to a few hundred nodes or less, depending on the complexity of the connectivity.
PRUNET has been entirely implemented using Perl programming language in order to fa-cilitate its modification and its cross-platform use. In addition, PRUNET provides a graphical user interface (GUI) to facilitate the interaction with the user.
‘0’and‘1’in the initial and final phenotypes respectively. In other words, a single experiment comparing two stable phenotypes is enough to contextualize the PKN using PRUNET.
Once interactions inconsistent with the observed phenotypes have been removed the result-ing contextualized network can be used to predict missresult-ing expression values or to simulate transitions between attractors in response to perturbations.
In order to validate the algorithm and to show its general applicability and scalability, we applied PRUNET to four biological examples, namely the epithelial to mesenchymal transition (EMT), T-Helper lymphocytes transdifferentiation (Th1-Th2), the induction of pluripotent stem cells (iPSC) and the differentiation of human embryonic stem cells (hESC) into cardio-myocytes (hESC-cardiomyocyte).
The resulting contextualized networks were used to predict expression values given a set of validation and training genes. We challenged the algorithm through cross-validation using dif-ferent randomly generated training and validation sets. The results showed that even training sets with only 50% of the genes yield contextualized networks that performed better than ran-domly generated subnetworks in predicting missing expression values.
Finally, we simulated well-characterized perturbations to evaluate the dynamical behaviour of the best-contextualized networks for each example. The results showed that, although the models were only trained to explain the existence of specific stable states (corresponding to specific cellular phenotypes), a fraction of the contextualized networks also exhibited the ex-pected response under perturbation (20%, 80%, 32% and 36% for EMT, Th1-Th2, iPSC and hESC-cardiomyocyte respectively).
PRUNET constitutes a user-friendly tool conceived not only for bioinformaticians and computational biologists but also for experimentalists. Its general applicability and the balance between the amount of data required to train the models and the accuracy of the predictions makes it suitable in a variety of biological systems and research projects. It can be used to help in both experimental design and hypothesis generation in biological and medical research.
Methods
Problem formulation
Given a PKN and a training set of experimental data, find the subnetwork/s of the PKN that best describe the experimental data for an adopted dynamical model.
This model consists of a Boolean network where the state of nodeiis given by the Boolean variablexi2{0,1}, which corresponds to the gene product activity/concentration. The state of the network is given by the state of all nodesX= {x1,. . .,xn}, which is updated using a
synchro-nous updating scheme [40][40].
The training set consists on a Booleanized representation of the gene product activity/con-centration, where those genes considered active/inactive or up-/down-regulated have a value of
‘1’/’0’. For instance, the differential expression analysis between two conditions (corresponding to stable phenotypes) results in a list of up- and down-regulated genes, and two Booleanized phenotypes can be derived from this list with the activity of these differentially expressed genes for each condition, i.e., up-regulated genes are in‘0’at the initial condition and in‘1’at the final condition, and the opposite for down-regulated genes. The goodness of the model descrip-tion of the experimental data is evaluated as follows:
1. Booleanized phenotypes derived from experimental data are introduced in the model as initial states.
3. Reached attractors are compared with the initial states.
A perfect model should have a perfect match between the reached attractors and initial states (Booleanized phenotypes).
The fitness functionfderived from this proceed uses the normalized Hamming distanceh to compareNgBoolean gene expression values (x) between the known phenotypes (φ) and the
reached steady state (α) of a given subnetwork, and it can be represented as
f ¼ 1
X Np
i¼1
hφiai
! Np 0 B B B B @ 1 C C C C A
withhφa¼
1 Ng
X Ng
j¼1 jxφ
j x
a
jj, whereNprepresents the number of Booleanized phenotypes
Given that the fitness functionfis normalized by the number of Booleanized phenotypes
Np, the best and worst possible values are 1 and 0 respectively. The value offrepresents the
fraction of nodes that are correctly explained by the model for all considered Booleanized phenotypes.
Model formalism
The Boolean model is defined by a set of polynomial functions encoding the regulatory logic as follows:
• And (conjunction):x^y=x×y
• Or (disjunction):x^y=x+y-(x×y)
• Not (negation): ¬x= 1-x
For example, the following Boolean network
a¼b^c
b¼ :b
c¼a_b
is represented as the following system of polynomial functions
a0 ¼bc
b0¼1 b
c0¼aþb ðabÞ
Within the context of the method implemented in PRUNET, solving these expressions for a given set of initial statesa,bandc(Booleanized phenotype) yields the values in the next (a',b'
andc'). In the examples included in this work we applied a synchronous updating scheme,
for each subnetwork was explored in order to find the closest attractor to the Booleanized phe-notype, with the consequent increase in computation time and limited network size.
Boolean network construction from PKN. The Boolean model is derived from the PKN by adopting a synchronous updating scheme, which assumes that all nodes are updated at the same time (not in a defined or random sequence). The regulatory logic functions adopted to update the network state follow the next rule: a node is considered active if at least one of its ac-tivators and none of its inhibitors are active. The node is considered inactive otherwise. The system of regulatory logic functions of the PKN for each example is included in the supple-ments (S1 Table).
Model perturbations
Network perturbations were simulated as an instant network state change, where the states of the perturbed genes are changed either from‘0’to‘1’or from‘1’to‘0’depending of the initial state. For example, SNAI1, GATA3 and the combination KLF4/POU5F1/SOX2 for EMT, Th1-Th2 and iPSC respectively were swapped from their original inactive to a final active state, i.e., from‘0’to‘1’. In the hESC-cardiomyocyte example, SOX2 and MEF2C were swapped from‘1’to‘0’and from‘0’to‘1’respectively. For all cases the network state was freely updated afterwards using a synchronous updating scheme.
Algorithm
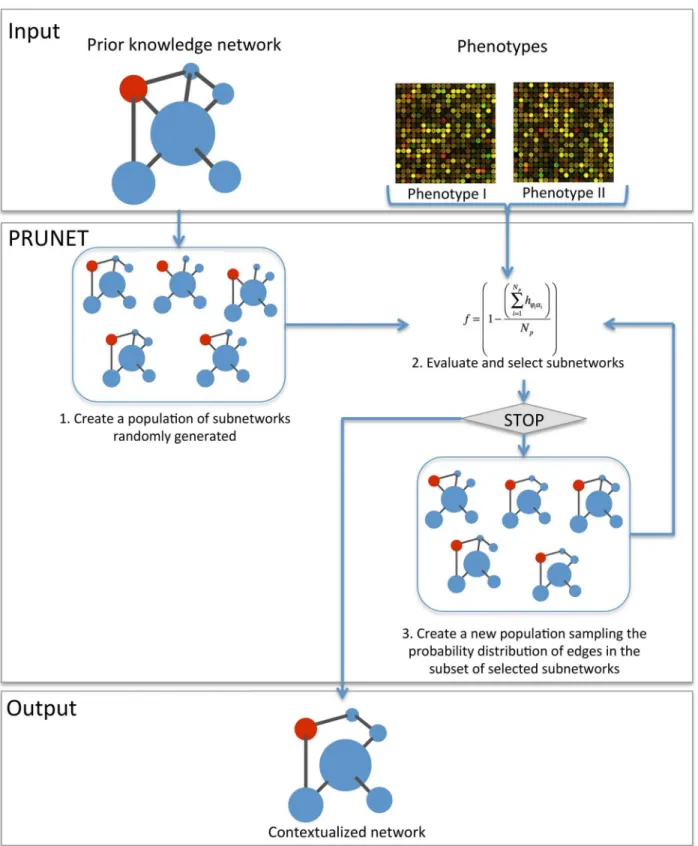
Finding a good model just by randomly generating subnetworks from the PKN is very unlikely. PRUNET includes an optimization algorithm to search for the best subnetwork. It consists of an estimation of distributions algorithm (EDA), a type of evolutionary algorithm that has been used for different bioinformatics problems [41]. The algorithm applies the fitness function de-scribed above (see Problem formulation in Methods section) to train the model in a process that can be described as follows (seeFig 1):
1. Create a population of randomly generated subnetworks. All edges and nodes in these net-works must exist in the PKN.
2. Evaluate the fitness function of each subnetwork and select those with the highest score.
3. Create a new population of subnetworks based on those selected in the previous step. To this end, PRUNET samples the probability distribution of each edge within the selected group of subnetworks and decides whether to include this interaction or not. For instance, let us suppose that a specific edge appears with a frequency of 0.80. PRUNET generates a random number be-tween 0 and 1 and uses this frequency as the threshold for making a decision. If the random number is lower or equal to 0.80, the edge is kept. Conversely, if the random number is higher than 0.80, the edge is removed.
4. Repeat step 2. The stop criterion is the maximum number of iterations previously defined by the user, but PRUNET allows the optimization to be stopped at any time and the current re-sults to be collected.
Complexity of the algorithm
Fig 1. Flow chart of the algorithm.PRUNET takes as the input a prior knowledge gene regulatory network and a Booleanized representation of the gene expression profiles of stable phenotypes. After an iterative network pruning, PRUNET delivers as the output a single (or several) contextualized network(s) optimized to describe the phenotypes according to an adopted dynamical model (Boolean). The fitness function is based on the matching between the predicted (α) and the known gene states (φ) for specific phenotypes.
bottleneck is the identification of the reached attractor from a given initial condition. Given a graphG(V, E), withVbeing the number of vertices andEthe number of edges, identifying all of the attractors inGcan be performed in linear timeO(|V|+|E|) by depth-first search algo-rithm. However, for Boolean functions, there can be an exponential number of vertices (i.e.|V| = 2N) in the graph forNBoolean variables, resulting in an exponential space complexity of the problem of identifying all of the attractors in the Boolean state space.
Despite PRUNET not searching for all of the attractors of the system, the worst-case analy-sis considers a scenario in which all of the states of the Boolean state space have to be evaluated. In other words, the trajectory from the initial conditions (phenotypes) to the final state (reached attractor) passes through all states of the Boolean state space, updating every node at each state, i.e.,O(Nx2N). This hypothetical situation is extreme and unlikely to occur in a real case. Moreover, the optimization itself is going to prevent this situation, which is more likely to occur at the first iterations of the algorithm. In order to avoid such a possibility, PRUNET is implemented in such a way that subnetworks resulting in trajectories longer than a given num-ber of steps (1,000 within this work) are discarded, so that the algorithm to calculate the reached attractor becomesO(Nx1000).
Examples: input networks and training sets
We have demonstrated the broad applicability and scalability of PRUNET using four examples corresponding to four different biological processes, namely the epithelial to mesenchymal transition (EMT), T-Helper lymphocytes transdifferentiation (Th1-Th2), the induction of plu-ripotent stem cells (iPSC), and the differentiation of human embryonic stem cells (hESC) into cardiomyocytes (hESC-cardiomyocyte).
The selected examples are not just ordinary PKNs, but are previously published network-based dynamical models manually constructed that correctly describe known phenotypes at the transcriptional level [42–45]. In these networks, nodes represent gene or gene products (such as proteins or microRNAs), and edges represent regulatory effects (up- or down-regula-tion for positive and negative interacdown-regula-tions respectively). These regulatory effects can consist ei-ther of direct molecular interaction, such as the effect of a transcription factor over its target, or indirect interactions, such as the observed change in the expression levels due to known or un-known signaling pathways. For validation purposes, these networks that nicely explain the phe-notypes used as training set in this work constitute the gold standard assumed correct. These networks were expanded with the addition of interactions between their constitutive genes con-tained in the ResNet mammalian database from Ariadne Genomics (http://www.
ariadnegenomics.com). Such interactions have been extracted from the biomedical literature using Ariadne MedScan technology [46,47], a text mining-based resource that processes sen-tences from PubMed abstracts. The interactions were collected blindfolded, without the biolog-ical context being filtered. Consequently, the interactions have been described in different cell types, biological processes and experimental conditions. It is worth noting here that this is a common practice during the reconstruction of GRNs in the attempt to capture all relevant events. The rationale behind this procedure is to collect as many true interactions as possible despite the fact that some context-dependent interactions may not be active in the specific bio-logical context under study. Consequently, some of the added interactions are consistent with the known phenotypes used to train the model, whereas other added interactions are not.
Binding”,“Expression”and“Direct Regulation”. Interactions in the“Promoter Binding” cate-gory indicate that the regulatory gene binds the promoter of the target genes and shows poten-tial regulation in the experiment.“Expression”represents the positive or negative regulatory effect of the regulator on the expression of the target. Finally,“Direct Regulation”indicates that the regulatory gene/protein alters the activity of the target gene/protein by means of physical binding, phosphorylation, methylation or other processes.
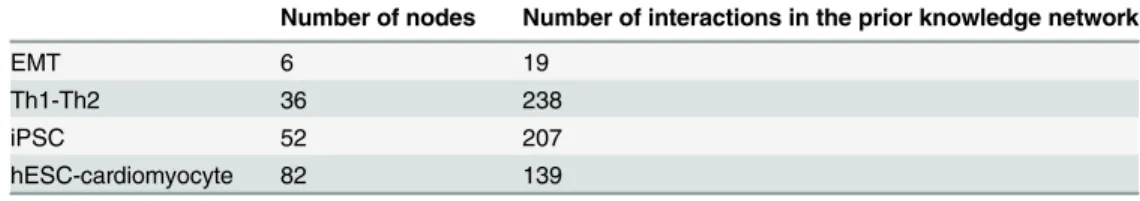
Follwing the network expansion described above, the four original networks of EMT, Th1-Th2, iPSC and hESC-cardiomyocyte with 16, 60, 123 and 126 interactions were expanded up to 19, 239, 207 and 141 interactions respectively (Table 1). Both the network topology and the set of regulatory logic functions used to construct the dynamical models have been included as supplementary information (S1 Table). References for added interactions from the ResNet mammalian database were additionally included inS1 Table.
The training sets used for the contextualization were taken from the same publications as the original GRNs [42–44] and have also been included in the supplements (S1 Table). Active and inactive genes were encoded as‘1’and‘0’, respectively, in a Booleanized representation of the corresponding phenotypes used. It is worth noting here that the current implementation of PRUNET it is restricted to a training set consisting on the Booleanized representation of the initial and final state of a biological process. Future development may include multiple steady states and transient states. For the latter case, time series data would be required.
Generating random subnetworks for validation of the algorithm
In order to validate the algorithm we compared for each included example the output of PRU-NET against a population of subnetworks. To generate this population of random subnetworks we ran PRUNET without sampling the probability distribution of edges when generating a new population of subnetworks during the optimization process, but scoring and transferring the best subnetworks to the next population of subnetworks (elitism). This procedure mimics the random search of a subnetwork to explain the expression data for a total number of evaluated subnet-works that equals the number of subnetsubnet-works evaluated by PRUNET across the total number of iterations. Consequently, the resulting population of networks compared against those obtained after the regular application of PRUNET (sampling the probability distribution of edges) consti-tutes a fair comparison and shows the contribution of PRUNET with respect to a random search.
General architecture
PRUNET is a cross platform tool with a graphical GUI developed entirely in Perl. The source code and executables for Windows, Mac OS and Linux are available online athttp://prunet. sourceforge.net/with versions for both 32 and 64 bit architecture.
Table 1. Applied case networks.
Number of nodes Number of interactions in the prior knowledge network
EMT 6 19
Th1-Th2 36 238
iPSC 52 207
hESC-cardiomyocyte 82 139
Three different examples were selected to validate PRUNET and illustrate its scalability and general applicability. The number of nodes and interactions for each applied example are included in the table.
Usage and parameters
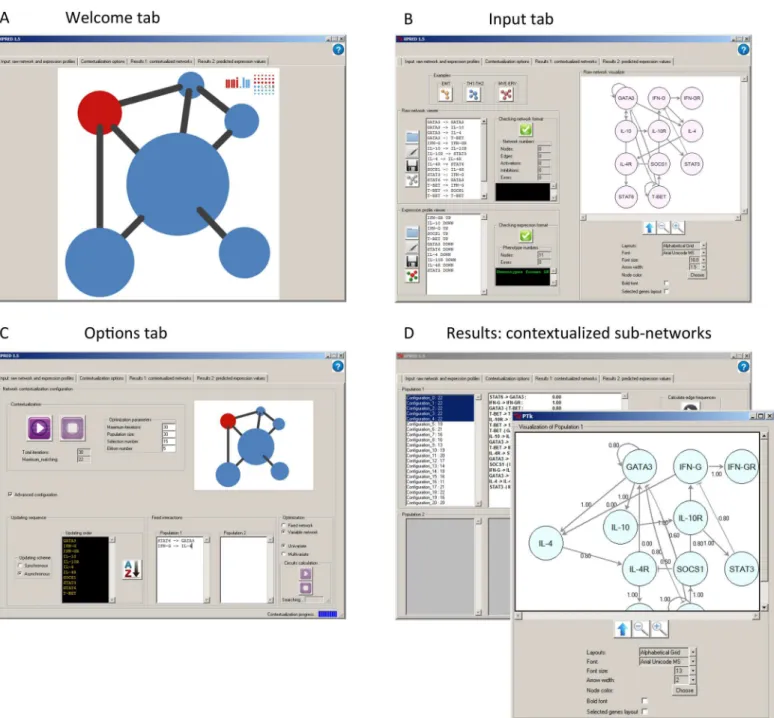
The GUI is organized into five tabs (seeFig 2): i) welcome, ii) input, iii) options, iv) results 1: contextualized networks, and v) results 2: predicted expression values. Users can intuitively fol-low the order from left to right to use the application.
The input information can be copied and pasted into the corresponding text-box or loaded when browsing the file system. The output can be visualized in PRUNET or saved as files.
Fig 2. PRUNET interface.The graphical user interface is organized in tabs, namely a welcome tab (A), input tab (B), options tab (C) and results tab (D). Both the input and results tab include a network visualizer to facilitate the interaction of the user with the program.
Basic configuration parameters
Maximum iterations. This parameter refers to the maximum number of times the algo-rithm is going to be recursively applied or, in evolutionary terms, the number of subnetwork generations that are going to be sampled, scored and selected in order to yield better networks. It is the maximum because, despite users being able to stop the optimization process at anytime and collect‘partial’results, the program keeps working until it reaches this iteration number. In general, a bigger population size requires a higher number of iterations to obtain conver-gence (a final population of similar subnetworks).
Population size. This parameter refers to the number of subnetworks generated in each it-eration. A high population size decreases the probability of a local optimum being reached but increases the computation time.
Selection number. This parameter refers to the number of top-scored subnetworks select-ed in each iteration. If the selection number is low the convergence to a population of similar subnetworks is quicker, but the optimization process could be slowed down due to the lack of variability.
Elitism number. This parameter refers to the number of the best historical subnetworks (in all iterations) that are directly transferred from one generation to the next to prevent the loss of best scoring subnetworks. We suggest using an elitism number not higher than half of the selection number in order to provide an optimization process with a degree of freedom.
Advanced configuration parameters
Advanced configuration parameters can be set up in the tab‘options’when the corresponding radio-button is active. A description of these parameters is included on the websitehttp:// prunet.sourceforge.net/.
Hardware used in the software comparison
For the comparison of PRUNET with CellNOptR, SigNetTrainer and XPRED we used a Mac-Book Pro with a processor of 2.4 GHz Intel Core i5 and memory of 8GB 1600 MHz DDR3.
Results and Discussion
In order to validate and illustrate the usage of PRUNET, we used four different biological ex-amples, namely EMT, Th1-Th2, iPSC and hESC-cardiomyocyte. For each of these four applied examples we performed two different tests: the prediction of missing expression values and the network response under specific perturbations.
Firstly, for the missing expression values prediction we performed a cross-validation analy-sis with repeated random sub-sampling validation; in other words, the datasets with the pheno-types expression profiles were randomly split into training and validation sets. The motivation behind this procedure was to evaluate how well networks were optimized using different train-ing sets to predict known phenotypes.
We ran PRUNET ten times for each example and for three different training set sizes, com-paring the predictions from the resulting population of optimized networks (N = 300) with predictions from a population of randomly generated subnetworks derived from the PKNs (see methods).
subnetworks and the population of optimized networks, with a p-value<0.01 for all the
exam-ples and training sizes (seeS2 Tablefor detailed results).
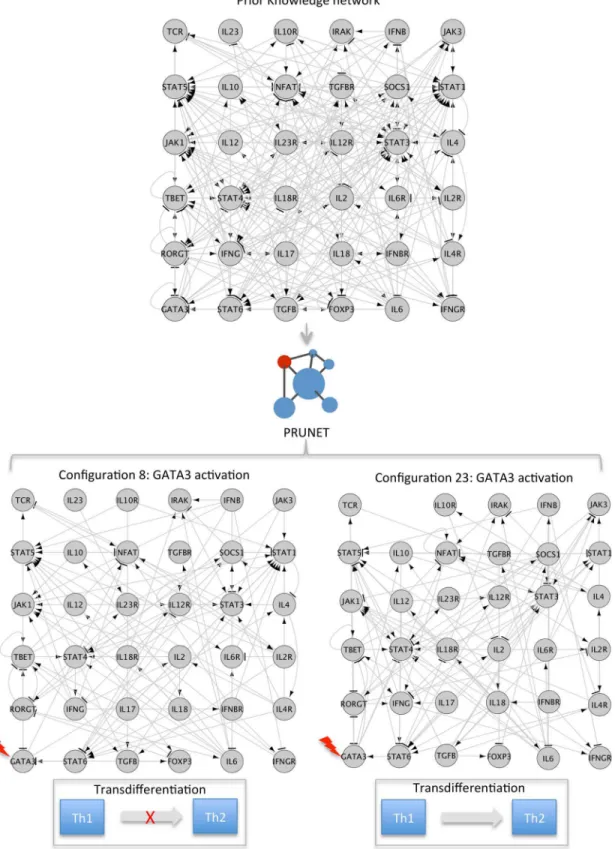
Secondly, in order to assess the suitability of the optimized networks for predicting the dy-namical behaviour of the model under well-characterized perturbations, we performed a simu-lation of such perturbations on the best five networks of each run (optimized using the complete phenotype to train the model) and compared the results obtained from these 50 net-works with the expected response.Fig 3shows an example on the Th1-Th2 case illustrating how the simulated perturbation (activation) of GATA3 was able to induce the transition from Th1 to Th2 in the contextualized network named as Configuration 23 but not in Configuration 8, where the system resulted in a cyclic attractor instead. The results for each applied example are described below.
Given that PRUNET is sensitive to the Booleanized phenotypes used for training the model, we have performed a sensitivity analysis for each biological example. In this analysis we have considered two situations: missing and wrong information about each single gene, and combi-nations of randomly-selected genes of different number. PRUNET generally demonstrated high tolerance for both missing and wrong information in all of the examples. The complete analysis is included in the supplements (S4 Table).
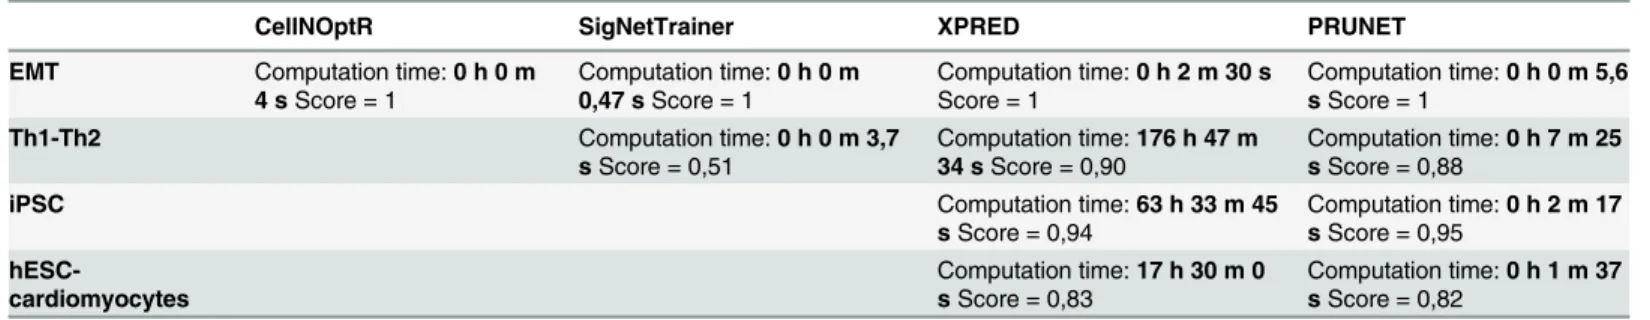
Finally, we compared PRUNET with other available software, namely CellNOptR[25], Sig-NetTrainer [30] and XPRED [23] (seeTable 2), using four biological examples. The results showed that for the smallest example (EMT) CellNOptR and SigNetTrainer were faster than PRUNET (4 s, 0.47 s and 5.6 s, respectively), whereas XPRED was slower (2 m 30 s). All the tools obtained a perfect score (1). This score refers to the match between predicted and real phenotypes; a score of 1 represents a full agreement, while a score of 0.5 reflects a correct de-scription of 50% of the genes for all the attractors. However, PRUNET displayed a better scal-ability for larger examples. CellNOptR was not able to run either the Th1-Th2 or the iPSC or the hESC-cardiomyocyte examples. SigNetTrainer obtained a worse score than PRUNET in the Th1-Th2 example (0.51 and 0.88, respectively) despite the fact that it was faster (3.7 s and 7 m 25 s, respectively), and it was not able to run the iPSC and hESC-cardiomyocyte examples. With respect to PRUNET, XPRED obtained similar scores for the four examples, although its computation time was much longer (seeTable 2).
Applied example I: EMT
A transient phenomenon called epithelial to mesenchymal transition (EMT) occurs during both regular embryonic development and as a part of the metastatic cascade initiated by the breakdown of epithelial cell homeostasis in carcinomas. During the EMT, cells change their transcriptional programs, which leads to phenotypic and functional alterations, including the loss of epithelial features like cell-cell adhesions and cell polarity and the gain of cell motility and mesenchymal and stem-like properties. EMT can be initiated by multiple pathways con-verging on the activation of EMT inducers. The EMT example consists of a regulatory core, with six genes and eighteen interactions. To contextualize the PKN we used the Booleanized re-presentation of the epithelial and mesenchymal phenotypes.
Fig 3. Simulated perturbations on alternative contextualized network may predict different response.In the case of Th1-Th2, 80% of the
contextualized subnetworks, optimized to describe phenotypes Th1 and Th2 also showed the expected response during the simulated activation of GATA3, with the transition from Th1 to Th2 phenotypes. The rest of the subnetworks (20%) either remained in the same attractor (phenotype) or were transited to another that was different from the expected one (Th2).
The EMT network includes SNAI1, a triggering factor for EMT, which has been validated by experimental perturbation of this gene [42]; the activation of SNAI1 was simulated and eval-uated for this example on the five best subnetwork from each run (fifty subnetworks in total). In this particular case, 20% (N = 12) of the subnetworks showed the expected response, with a transition from epithelial to mesenchymal phenotypes and a perfect match with the latter phe-notype. The remaining networks either stayed in the epithelial phenotype or became in cyclic attractors.
Applied example II: Th1-Th2
T lymphocytes are immune cells that can be roughly classified in two main categories: T-helper and T-cytotoxic. T-helper cells take part in cell- and antibody-mediated immune responses and they are sub-divided in Th0 (precursor), effector Th1, Th2, Th17 and Treg. To contextual-ize the PKN, including thirty-six genes and two hundred and thirty-nine interactions we fo-cused on the cellular transition between Th1 and Th2, using the Booleanized representation of Th1 and Th2 phenotypes in the optimization process.
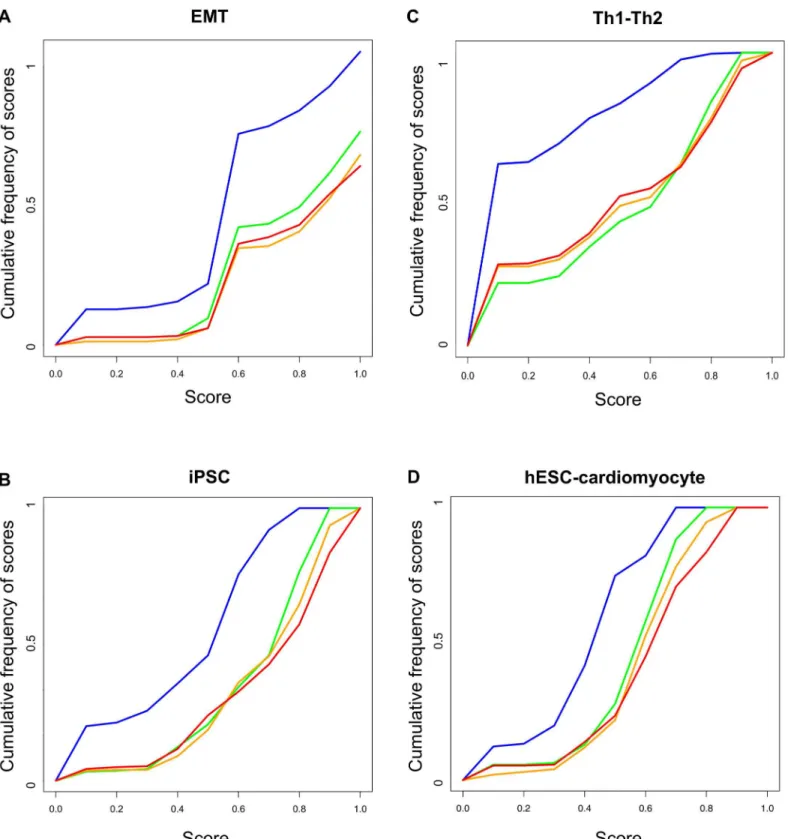
For the expression values prediction, we used ten randomly selected training sets of eigh-teen, twenty-seven and thirty-six genes.Fig 4Bshows a clear separation between the popula-tions of randomly generated subnetworks (blue line) and optimized networks (green, orange and red lines for eighteen, twenty-seven and thirty-six genes in the training set respectively). The mean of the scores of the different populations were 0.17, 0.48, 0.50 and 0.47 for randomly generated subnetworks and subnetworks trained with eighteen, twenty-seven and thirty-six genes respectively.
The perturbation of GATA3 has been reported as being capable of inducing the transdiffer-entiation from Th1 to Th2 [48]. We simulated and evaluated such a perturbation on the best five optimized subnetworks of each run (fifty subnetworks in total). In this case, 80% of the op-timized subnetworks (N = 40) showed a transition to a new attractor with a match with the Th2 phenotype of 75% or more.
Applied example III: iPSC
Somatic cells can be converted back to the stem cell states (the so called induced pluripotent stem cells or iPSC) by overexpressing three to four genes in the somatic cells essential for regu-lating pluripotency. We took a PKN, with 52 genes and 207 interactions, based on the GRN in-volved in regulating pluripotency and hESC differentiation proposed by Chang et al. [49] and
Table 2. Comparison of PRUNET with similar available software.
CellNOptR SigNetTrainer XPRED PRUNET
EMT Computation time:0 h 0 m 4 sScore = 1
Computation time:0 h 0 m 0,47 sScore = 1
Computation time:0 h 2 m 30 s
Score = 1
Computation time:0 h 0 m 5,6 sScore = 1
Th1-Th2 Computation time:0 h 0 m 3,7 sScore = 0,51
Computation time:176 h 47 m 34 sScore = 0,90
Computation time:0 h 7 m 25 sScore = 0,88
iPSC Computation time:63 h 33 m 45
sScore = 0,94
Computation time:0 h 2 m 17 sScore = 0,95
hESC-cardiomyocytes
Computation time:17 h 30 m 0 sScore = 0,83
Computation time:0 h 1 m 37 sScore = 0,82
Scores represent the match between predicted and real phenotypes; a score of 1 represents a full agreement between training set and model predictions, while a score of 0.5 reflects a correct description of 50% of the training set.
Fig 4. Validation of PRUNET using four biological examples.The scores obtained after the application of PRUNET to four biological examples, namely epithelial to mesenchymal transition (EMT), Th1-Th2 transdifferentiation (Th1-Th2), induced pluripotent stem cells (iPSC) and cardiomyocyte differention of human embryonic stem cells (hESC-cardiomyocyte), were compared with the scores obtained by a population of randomly generated subnetworks from the prior knowledge network. Green, orange and red lines represent the cumulative frequencies of scores obtained with training sets of a half, an intermediate number (different for each case) and all of the genes respectively, whereas the blue line represents the scores obtained from the population of subnetworks randomly generated from the prior knowledge network. The separation between blue and the other lines represents the contribution of PRUNET to the prior knowledge network in terms of describing the known phenotypes of different training set sizes.
used a Booleanized representation of the phenotypes corresponding to‘differentiated’and‘ plu-ripotent’to train the model.
Once again, for the expression values prediction, we used ten randomly generated traning sets of 26, 39 and 52 genes.
Fig 4Cshows a separation between the populations of randomly generated subnetworks (blue line) and optimized networks (green, orange and red lines for 26, 39 and 52 genes in the training set respectively). The mean of the scores of the different populations were 0.42, 0.64, 0.66 and 0.67 for randomly generated subnetworks and the subnetworks trained with twenty-six, thirty-nine and fifty-two genes respectively.
The combined perturbation of POU5F1, SOX2 and KLF4 is known to be capable of induc-ing pluripotent cellular states [50]. We simulated the activation of these genes on the best 50 optimized subnetworks from the iPSC example to evaluate the transition from‘differentiated’
to‘pluripotent’phenotypes. According to our simulations, 32% (N = 16) of the optimized sub-networks showed a transition to an attractor with at least 75% of matching with the expected
‘pluripotent’phenotype. The rest of the networks remained in the same initial attractor (‘ differ-entiated’) or became a new one that has lower matching with the expected phenotype.
Applied example IV: hESC-cardiomyocyte
Human embryonic stem cells (hESCs) can be differentiatedin vitrointo cells of different line-ages following specific cell culture protocols. Recently, several protocols have been developed to differentiate hESCs into cardiomyocytes [51–54], thereby providing an idealin vitromodel to study heart development and disease. Gu and co-workers constructed a GRN from literature connecting differentially expressed genes between hESC and cardiomyocytes differentiated by perturbation of the WNT pathway [54]. We contextualized the original raw GRN using PRU-NET and challenged the top five optimized subnetworks of ten different runs of the algorithm to reproduce the cellular transition from hESCs to cardiomyocyte triggered by the inhibition of SOX2 and activation of MEF2C resulting from the inhibition of the WNT pathway. The net-work was contextualized using the complete expression profile of hESCs and cardiomyocytes (83 genes) and 10 randomly-selected training sets of 42 and 63 genes.Fig 4Dshows the separa-tion between the scores of randomly-generated subnetworks and subnetworks obtained using Prunet for training sets of 42, 63 and 83 genes. The mean of the scores for the population of random subnetworks was 0.39, whereas for training sets of 42, 63 and 83 genes, the mean scores were 0.54, 0.58 and 0.59, respectively.
Concerning the combined perturbation of SOX2 (inhibited) and MEF2C (activated), our simulations showed that 36% (N = 18) of the best subnetworks exhibited a transition to an at-tractor with at least 50% matching with the expected‘cardiomyocyte’phenotype. The rest of the networks remained in the same initial attractor (‘hESC’) or reached another attractor by matching with the‘cardiomyocyte’phenotype lower than 50% of the genes.
predicted response to perturbations. This concept requires, of course, further investigation and development.
It is also worth mentioning here that only the network topology and not the logic functions are optimized by PRUNET. An inhibitory dominant system is assumed by default (see meth-ods); however, alternative regulatory systems are partially compensated by the optimization. For example, let us suppose that a given gene is inhibited by a second one and activated by a third one. If all genes are active in one of the phenotypes, PRUNET will remove the inhibition because it assumes that if an inhibitor is active its effect is dominant, and in the adopted Bool-ean formalism that implies that the regulated gene should be inactive. This mBool-eans that the net-work is not only contextualized to the biological context but also to the adopted set of
regulatory logic rules. Despite both the removal of dominant interactions inconsistent with the state of their targets and changing the regulatory rules that can equally explain the observed phenotypes, the predicted response to perturbations may be different; it is not equivalent that an inhibitory effect is not dominant in a particular case (a given steady state) and that an inhib-itory effect never happens. However, we have shown that a fraction of the resulting contextual-ized networks were able to correctly predict the response to specific perturbations in spite of the regulatory logic assumed by default in the biological examples included in this work.
If different regulatory rules are known they can be encoded by the addition of artificial nodes in the network, as proposed by Garg et al. [18]. Looking for optimal set of rules consti-tutes a natural expansion of the present implementation of PRUNET.
Other future developments may include the implementation of the same network contex-tualization strategy for a discrete system not Boolean, which should allow de the gene activity and network dynamics to be described more precisely, and the optimization algorithm to be adapted to work with cyclic attractors in order to make PRUNET suitable for contextualizing the underlying network of biological processes with oscillatory behaviour.
Conclusion
The last years have witnessed an increase in the size and complexity of PKN, partly due to auto-mated network creation techniques exploiting information from literature. These techniques tend to be inclusive rather than exclusive in an attempt to capture all relevant biological events. The resulting networks usually merge a number of context dependent interactions. This is part-ly due to the presence of such interactions as frequentpart-ly these networks cannot be used directpart-ly to simulate biological processes under specific biological contexts, defined by features like the cell type, tissue or experimental conditions.
PRUNET was conceived precisely to identify and remove such interactions in an attempt to adapt a general PKN to describe biological processes in specific conditions. The resulting con-textualized network(s) constitute an optimized model able to describe known phenotypes and can ben used to simulate transitions between them in response to perturbations. PRUNET as-sumes that the initial PKN is complete enough to describe the biological process under study; it is beyond its scope to address the problem of network incompleteness.
The application of PRUNET provides an added value to PKN and can be useful in assisting with the hypothesis generation and guiding researchers in the experiment design in biological and medical research.
Availability and Requirements
Home page
Operating system
Windows (32 and 64 bit), Mac OS and Linux (32 and 64 bit).
Requirements
In order to be able to run the Perl program ActivePerl 5.14 or later and the Perl package, Tk-804.027 should be installed. In addition, running the source code in Mac OS also requires the installation of X11.app.
License
PRUNET is free for academic purposes but requires a license from the authors for any com-mercial purposes. The software is available without user registration.
Further information. A quick start user’s guide and an explanation about advanced con-figuration are included on the application homepage.
Supporting Information
S1 Fig. Sensitivity analysis EMT.Boxplots summarize the distribution of scores of contextual-ized networks when either missing (in green) or wrong (orange) information is given to PRU-NET.A) Single genes.This analysis refers to missing or wrong information about specific genes. The results indicated that SNAI1 was the most sensitive gene of the model;B) Combina-tions of genes.This analysis refers to missing or wrong information about combinations of genes randomly selected.
(TIFF)
S2 Fig. Sensitivity analysis Th1-Th2 single genes.The boxplot summarizes the distribution of scores of contextualized networks when either missing (in green) or wrong (orange) informa-tion about specific genes is given to PRUNET. The results indicated that FOXP3, IL18R and TBET were the most sensitive gene of the model.
(TIFF)
S3 Fig. Sensitivity analysis Th1-Th2 combinations genes.The boxplot summarizes the distri-bution of scores of contextualized networks when either missing (in green) or wrong (orange) information about combinations randomly selected is given to PRUNET.
(TIFF)
S4 Fig. Sensitivity analysis iPSC single genes.The boxplot summarizes the distribution of scores of contextualized networks when either missing (in green) or wrong (orange) informa-tion about specific genes is given to PRUNET. The results indicated that NANOG the most sensitive gene of the model.
(TIFF)
S5 Fig. Sensitivity analysis iPSC combinations of genes.The boxplot summarizes the distri-bution of scores of contextualized networks when either missing (in green) or wrong (orange) information about combinations randomly selected is given to PRUNET.
(TIFF)
S6 Fig. Sensitivity analysis hESC-cardiomyocyte single genes.The boxplot summarize the distribution of scores of contextualized networks when either missing (in green) or wrong (or-ange) information about specific genes is given to PRUNET.The results indicated that POU5F1 was the most sensitive gene of the model.
S7 Fig. Sensitivity analysis hESC-cardiomyocyte combinations of genes.The boxplot sum-marize the distribution of scores of contextualized networks when either missing (in green) or wrong (orange) information about combinations randomly selected is given to PRUNET. (TIFF)
S1 Table. Prior knowledge networks, Boolean models and Booleanized phenotypes (train-ing set).
(XLSX)
S2 Table. PRUNET validation results. (XLSX)
S3 Table. Simulated perturbation results. (XLSX)
S4 Table. Sensitivity analysis results. (XLSX)
S1 Text. Sensitivity analysis of networks contextualized with PRUNET in four applied cases: EMT, Th1-Th2, iPSC and hESC-cardiomyocyte.
(DOC)
Author Contributions
Conceived and designed the experiments: AR IC AdS. Performed the experiments: AR IC GA. Analyzed the data: AR IC GA. Wrote the paper: AR IC AdS.
References
1. Joshi-Tope G, Gillespie M, Vastrik I, D'Eustachio P, Schmidt E, et al. (2005) Reactome: a knowledge-base of biological pathways. Nucleic Acids Res 33: D428–432. PMID:15608231
2. Cerami EG, Gross BE, Demir E, Rodchenkov I, Babur O, et al. (2011) Pathway Commons, a web re-source for biological pathway data. Nucleic Acids Res 39: D685–690. doi:10.1093/nar/gkq1039PMID: 21071392
3. Kanehisa M, Goto S (2000) KEGG: kyoto encyclopedia of genes and genomes. Nucleic Acids Res 28: 27–30. PMID:10592173
4. Xiong M, Li J, Fang X (2004) Identification of genetic networks. Genetics 166: 1037–1052. PMID: 15020486
5. Dempster AP (1972) Covariance selection. Biometrics: 157–175.
6. Whittaker J (2009) Graphical models in applied multivariate statistics: Wiley Publishing.
7. Kollar D, Friedman N (2009) Probabilistic graphical models: principles and techniques: The MIT Press.
8. Margolin AA, Nemenman I, Basso K, Wiggins C, Stolovitzky G, et al. (2006) ARACNE: an algorithm for the reconstruction of gene regulatory networks in a mammalian cellular context. BMC bioinformatics 7: S7. PMID:17254312
9. Basso K, Margolin AA, Stolovitzky G, Klein U, Dalla-Favera R, et al. (2005) Reverse engineering of reg-ulatory networks in human B cells. Nature genetics 37: 382–390. PMID:15778709
10. Faith JJ, Hayete B, Thaden JT, Mogno I, Wierzbowski J, et al. (2007) Large-scale mapping and valida-tion of Escherichia coli transcripvalida-tional regulavalida-tion from a compendium of expression profiles. PLoS biolo-gy 5: e8. PMID:17214507
11. De La Fuente A, Bing N, Hoeschele I, Mendes P (2004) Discovery of meaningful associations in geno-mic data using partial correlation coefficients. Bioinformatics 20: 3565–3574. PMID:15284096
12. Soranzo N, Bianconi G, Altafini C (2007) Comparing association network algorithms for reverse engi-neering of large-scale gene regulatory networks: synthetic versus real data. Bioinformatics 23: 1640–1647. PMID:17485431
14. Markowetz F, Bloch J, Spang R (2005) Non-transcriptional pathway features reconstructed from sec-ondary effects of RNA interference. Bioinformatics 21: 4026–4032. PMID:16159925
15. Markowetz F, Kostka D, Troyanskaya OG, Spang R (2007) Nested effects models for high-dimensional phenotyping screens. Bioinformatics 23: i305–312. PMID:17646311
16. Frohlich H, Fellmann M, Sultmann H, Poustka A, Beissbarth T (2008) Estimating large-scale signaling networks through nested effect models with intervention effects from microarray data. Bioinformatics 24: 2650–2656. doi:10.1093/bioinformatics/btm634PMID:18227117
17. Tresch A, Markowetz F (2008) Structure learning in Nested Effects Models. Stat Appl Genet Mol Biol 7: Article9. doi:10.2202/1544-6115.1359PMID:18312223
18. Frohlich H, Tresch A, Beissbarth T (2009) Nested effects models for learning signaling networks from perturbation data. Biom J 51: 304–323. doi:10.1002/bimj.200800185PMID:19358219
19. Frohlich H, Sahin O, Arlt D, Bender C, Beissbarth T (2009) Deterministic Effects Propagation Networks for reconstructing protein signaling networks from multiple interventions. BMC Bioinformatics 10: 322. doi:10.1186/1471-2105-10-322PMID:19814779
20. Saez-Rodriguez J, Alexopoulos LG, Epperlein J, Samaga R, Lauffenburger DA, et al. (2009) Discrete logic modelling as a means to link protein signalling networks with functional analysis of mammalian signal transduction. Molecular systems biology 5.
21. Gat-Viks I, Tanay A, Shamir R (2004) Modeling and analysis of heterogeneous regulation in biological networks. Journal of computational biology: a journal of computational molecular cell biology 11: 1034–1049. PMID:15662196
22. Layek RK, Datta A, Dougherty ER (2011) From biological pathways to regulatory networks. Molecular bioSystems 7: 843–851. doi:10.1039/c0mb00263aPMID:21161088
23. Crespo I, Krishna A, Le Bechec A, del Sol A (2013) Predicting missing expression values in gene regu-latory networks using a discrete logic modeling optimization guided by network stable states. Nucleic Acids Research 41: e8. doi:10.1093/nar/gks785PMID:22941654
24. Ulitsky I, Gat-Viks I, Shamir R (2008) MetaReg: a platform for modeling, analysis and visualization of bi-ological systems using large-scale experimental data. Genome Biol 9: R1. doi: 10.1186/gb-2008-9-1-r1PMID:18171474
25. Terfve C, Cokelaer T, Henriques D, MacNamara A, Goncalves E, et al. (2012) CellNOptR: a flexible toolkit to train protein signaling networks to data using multiple logic formalisms. BMC Syst Biol 6: 133. doi:10.1186/1752-0509-6-133PMID:23079107
26. Ourfali O, Shlomi T, Ideker T, Ruppin E, Sharan R (2007) SPINE: a framework for signaling-regulatory pathway inference from cause-effect experiments. Bioinformatics 23: i359–366. PMID:17646318
27. Lan A, Smoly IY, Rapaport G, Lindquist S, Fraenkel E, et al. (2011) ResponseNet: revealing signaling and regulatory networks linking genetic and transcriptomic screening data. Nucleic Acids Res 39: W424–429. doi:10.1093/nar/gkr359PMID:21576238
28. Hashemikhabir S, Ayaz ES, Kavurucu Y, Can T, Kahveci T (2012) Large-scale signaling network re-construction. IEEE/ACM Trans Comput Biol Bioinform 9: 1696–1708. doi:10.1109/TCBB.2012.128 PMID:23221085
29. Knapp B, Kaderali L (2013) Reconstruction of cellular signal transduction networks using perturbation assays and linear programming. PLoS One 8: e69220. doi:10.1371/journal.pone.0069220PMID: 23935958
30. Melas IN, Samaga R, Alexopoulos LG, Klamt S (2013) Detecting and removing inconsistencies be-tween experimental data and signaling network topologies using integer linear programming on interac-tion graphs. PLoS Comput Biol 9: e1003204. doi:10.1371/journal.pcbi.1003204PMID:24039561
31. Morganella S, Zoppoli P, Ceccarelli M (2009) IRIS: a method for reverse engineering of regulatory rela-tions in gene networks. BMC Bioinformatics 10: 444. doi:10.1186/1471-2105-10-444PMID:20030818
32. Kaderali L, Dazert E, Zeuge U, Frese M, Bartenschlager R (2009) Reconstructing signaling pathways from RNAi data using probabilistic Boolean threshold networks. Bioinformatics 25: 2229–2235. doi:10. 1093/bioinformatics/btp375PMID:19542154
33. Kim S, Li H, Dougherty ER, Cao N, Chen Y, et al. (2002) Can Markov chain models mimic biological regulation? Journal of Biological Systems 10: 337–357.
34. Pal R, Ivanov I, Datta A, Bittner ML, Dougherty ER (2005) Generating Boolean networks with a pre-scribed attractor structure. Bioinformatics 21: 4021–4025. PMID:16150807
35. Crespo I, Del Sol A (2013) A general strategy for cellular reprogramming: the importance of transcrip-tion factor cross-repression. STEM CELLS 31: 2127–2135. doi:10.1002/stem.1473PMID:23873656
37. Crespo I, Perumal TM, Jurkowski W, del Sol A (2013) Detecting cellular reprogramming determinants by differential stability analysis of gene regulatory networks. BMC Systems Biology 7: 140. doi:10. 1186/1752-0509-7-140PMID:24350678
38. Shmulevich I, Dougherty ER, Kim S, Zhang W (2002) Probabilistic Boolean networks: a rule-based un-certainty model for gene regulatory networks. Bioinformatics 18: 261–274. PMID:11847074
39. Zhou X, Wang X, Pal R, Ivanov I, Bittner M, et al. (2004) A Bayesian connectivity-based approach to constructing probabilistic gene regulatory networks. Bioinformatics 20: 2918–2927. PMID:15145802
40. Garg A, Di Cara A, Xenarios I, Mendoza L, De Micheli G (2008) Synchronous versus asynchronous modeling of gene regulatory networks. Bioinformatics 24: 1917–1925. doi:10.1093/bioinformatics/ btn336PMID:18614585
41. Larrañaga P, Lozano JA (2002) Estimation of distribution algorithms: A new tool for evolutionary com-putation: Springer.
42. Moes M, Le Béchec A, Crespo I, Laurini C, Halavatyi A, et al. (2012) A novel network integrating a miRNA-203/SNAI1 feedback loop which regulates epithelial to mesenchymal transition. PloS one 7: e35440. doi:10.1371/journal.pone.0035440PMID:22514743
43. Mendoza L, Pardo F (2010) A robust model to describe the differentiation of T-helper cells. Theory in Biosciences 129: 283–293. doi:10.1007/s12064-010-0112-xPMID:20922578
44. Chang R, Shoemaker R, Wang W (2011) Systematic search for recipes to generate induced pluripotent stem cells. PLoS Comput Biol 7: e1002300. doi:10.1371/journal.pcbi.1002300PMID:22215993
45. Gu Y, Liu G-H, Plongthongkum N, Benner C, Yi F, et al. (2013) Global DNA methylation and transcrip-tional analyses of human ESC-derived cardiomyocytes. Protein & Cell.
46. Novichkova S, Egorov S, Daraselia N (2003) MedScan, a natural language processing engine for MED-LINE abstracts. Bioinformatics 19: 1699–1706. PMID:12967967
47. Daraselia N, Yuryev A, Egorov S, Novichkova S, Nikitin A, et al. (2004) Extracting human protein inter-actions from MEDLINE using a full-sentence parser. Bioinformatics 20: 604–611. PMID:15033866
48. Lee HJ, Takemoto N, Kurata H, Kamogawa Y, Miyatake S, et al. (2000) GATA-3 induces T helper cell type 2 (Th2) cytokine expression and chromatin remodeling in committed Th1 cells. The Journal of ex-perimental medicine 192: 105–116. PMID:10880531
49. Chang R, Shoemaker R, Wang W (2011) Systematic search for recipes to generate induced pluripotent stem cells. PLoS computational biology 7: e1002300. doi:10.1371/journal.pcbi.1002300PMID: 22215993
50. Schmidt R, Plath K (2012) The roles of the reprogramming factors Oct4, Sox2 and Klf4 in resetting the somatic cell epigenome during induced pluripotent stem cell generation. Genome biology 13: 251. doi: 10.1186/gb-2012-13-10-251PMID:23088445
51. Yang L, Soonpaa MH, Adler ED, Roepke TK, Kattman SJ, et al. (2008) Human cardiovascular progeni-tor cells develop from a KDR+ embryonic-stem-cell-derived population. Nature 453: 524–528. doi:10. 1038/nature06894PMID:18432194
52. Lian X, Hsiao C, Wilson G, Zhu K, Hazeltine LB, et al. (2012) Robust cardiomyocyte differentiation from human pluripotent stem cells via temporal modulation of canonical Wnt signaling. Proceedings of the National Academy of Sciences 109: E1848–E1857. doi:10.1073/pnas.1200250109PMID:22645348
53. Willems E, Cabral-Teixeira J, Schade D, Cai W, Reeves P, et al. (2012) Small molecule-mediated TGF-βtype II receptor degradation promotes cardiomyogenesis in embryonic stem cells. Cell stem cell 11: 242–252. doi:10.1016/j.stem.2012.04.025PMID:22862949