Transcriptome and Phenotype of
Salmonella enterica
Serovar Typhimurium
Jessica M. A. Blair1, Grace E. Richmond1, Andrew M. Bailey1, Al Ivens2, Laura J. V. Piddock1*
1Antimicrobials Research Group, School of Immunity and Infection and Institute of Microbiology and Infection, University of Birmingham, Edgbaston, Birmingham, United Kingdom,2Centre for Immunity, Infection and Evolution, University of Edinburgh Ashworth Labs, King’s Buildings, Edinburgh, United Kingdom
Abstract
The type of bacterial culture medium is an important consideration during design of any experimental protocol. The aim of this study was to understand the impact of medium choice on bacterial gene expression and physiology by comparing the transcriptome of Salmonella enterica SL1344 after growth in the widely used LB broth or the rationally designed MOPS minimal medium. Transcriptomics showed that after growth in MOPS minimal media, compared to LB, there was increased expression of 42 genes involved in amino acid synthesis and 23 genes coding for ABC transporters. Seven flagellar genes had decreased expression after growth in MOPS minimal medium and this correlated with a decreased motility. In both MOPS minimal medium and MEM expression of genes from SPI-2 was increased and the adhesion ofS. Typhimurium to intestinal epithelial cells was higher compared to the levels after growth in LB. However, SL1344 invasion was not significantly altered by growth in either MOPs minimal media or MEM. Expression of SPI-2 was also measured using chromosomal GFP reporter fusions followed by flow cytometry which showed, for the first time, that the reduction in SPI-2 transcript after growth in different media related to a reduction in the proportion of the bacterial population expressing SPI-2. These data highlight the profound differences in the global transcriptome afterin vitro growth in different media and show that choice of medium should be considered carefully during experimental design, particularly when virulence related phenotypes are being measured.
Citation:Blair JMA, Richmond GE, Bailey AM, Ivens A, Piddock LJV (2013) Choice of Bacterial Growth Medium Alters the Transcriptome and Phenotype of Salmonella entericaSerovar Typhimurium. PLoS ONE 8(5): e63912. doi:10.1371/journal.pone.0063912
Editor:Andrew J. Roe, University of Glasgow, United Kingdom
ReceivedFebruary 18, 2013;AcceptedApril 7, 2013;PublishedMay 21, 2013
Copyright:ß2013 Blair et al. This is an open-access article distributed under the terms of the Creative Commons Attribution License, which permits unrestricted use, distribution, and reproduction in any medium, provided the original author and source are credited.
Funding:JB was funded by a Medical Research Council (MRC) DTG at the University of Birmingham, a Wellcome Trust VIP award and then by an MRC Programme grant (G0501415). The funders had no role in study design, data collection and analysis, decision to publish, or preparation of the manuscript.
Competing Interests:The authors have declared that no competing interests exist.
* E-mail: [email protected]
Introduction
Salmonella enterica is the cause of 93.8 million cases of gastroenteritis leading to 155,000 deaths annually worldwide [1]. Salmonella is an intracellular pathogen that invades the intestinal epithelia by inducing its own uptake into non-phagocytic enterocytes. This requires a type 3 secretion system (T3SS) encoded by a 40 Kb genomic region called Salmonella Pathoge-nicity Island (SPI) which is required for invasion of host cells [2]. This secretion mechanism injects effector proteins directly into the host cell cytoplasm which initiates rearrangement of the host actin cytoskeleton and destabilisation of host cell tight junctions [3,4]. A second T3SS, SPI-2, is required for intracellular survival [5,6,7,8,9]. This T3SS translocates effector proteins across the vacuolar membrane into the host cell allowing bacteria to modulate its external environment and survive within the hostile environment of the host cell. Expression of these T3SSs is bimodal; a proportion of the population express the system, while the remainder do not [10,11,12].
Expression of SPI-1 and SPI-2 is regulated by environmental cues that signal to the cell the appropriate time or place for expression. For example SPI-1 is expressed most in conditions that mimic the environment of the small intestine such as slight alkalinity, low oxygen and high osmolarity [13]. In contrast, SPI-2
is induced in conditions similar to the intracellular environment including acidic conditions [14,15], phosphate starvation [16] and low osmolarity [17,18]. Therefore, the medium in which bacterial strains are grown alters the expression of these important virulence genes and depending on the research question being investigated researchers are able to choose media which induce the expression of their system of interest. However, commonly the choice of bacterial growth medium in which to perform an experiment is chosen by convention rather than logic without understanding the full consequences of the choice and underestimating the impact of this decision on the outcome of experiments.
Materials and Methods Strains and Media Used
S. entericaserovar Typhimurium SL1344 was used throughout this study [19]. Strains containing chromosomal GFP fusions to prgH(SPI1),ssaG(SPI2) orrpsM(16S control) promoters have been previously described [10]. P22 transduction was used to transfer the GFP fusions into SL1344 giving L1307 (SL1344 ssaG’-gfp+, CmR) and L1309 (SL1344 prgH’-gfp, CmR). Three types of media were compared: LB (Sigma L3022) containing tryptone, yeast extract and NaCl, Minimum essential medium (MEM) (Sigma, M2279) containing inorganic salts, amino acids, vitamins, glucose, NaHCO3, Phenol red and added L-glutamine and NEAA, and MOPs minimal media (Teknova) [20] containing 3-(N-morpholino)propanesulfonic acid, potassium phosphate, glu-cose and the latter was supplemented with histidine as SL1344 is a histidine auxotroph.
Determination of Transcriptome
RNA was isolated from strains after growth to mid-logarithmic phase in either LB, defined MOPS minimal medium (Teknova, United States) or MEM (Sigma) at 37uC with shaking at 180 rpm as previously described [21]. Three cultures were grown for each media type, and two RNA preparations made from each culture, giving three biological and two technical replicates of each. RNA was isolated using the Promega SV40 total RNA preparation kit according to the manufacturer’s instructions and ad previously described [22]. The quantity and quality of RNA was determined using an Agilent 2100 Bioanalyser.
Microarray experiments were performed with pan-Salmonella generation IV microarray at the Sanger Genome Campus (Hinxton, United Kingdom) as described previously [22]. Results were analysed using Bioconductor and B values (log odds value of 0, and adjustedPvalue#0.05) of#0.05 were taken as significant. Microarray data deposited with ArrayExpress, http://www.ebi.ac. uk/arrayexpress/. Accession number E-MTAB-1135. Microarray data were visualised using the Pathway tools software (version 13.0) and theSalmonella database (Gemma Langridge, Wellcome Trust Sanger Institute) so that the metabolic genes could be viewed in their respective metabolic pathways enabling themes in the data to be easily identified.
Quantitative Real-time PCR
Comparative real-time reverse transcription (RT)-PCR was used to validate microarray data and determine the expression of genes of interest in different media types. Sample preparation and real-time RT-PCR was performed according to MIQE guidelines [23]. Technical duplicates of RNA were prepared from biological triplicates of SL1344 grown in LB, MOPs Minimal media and MEM. All samples were additionally treated with TurboDNAse (Ambion) and removal of all DNA was confirmed by a negative PCR result. RNA was quantified by nanodrop (Thermo-scientific). cDNA was synthesised from each RNA preparation using the superscript III cDNA synthesis kit (Invitrogen). Twelve represen-tative genes with a range of functions (biosynthesis, transport and SPI-2 genes) were selected to validate gene expression changes seen in microarrays between SL1344 grown in LB broth and minimal media. Primers were designed with an annealing temperature of 57.3uC using Beacon Designer 4.0 (Premier Biosoft, USA) (Table S1). PCR efficiency validation experiments were carried out using five cDNA standards of different concentrations (10, 1, 0.1, 0.01, 0.001 ng/ml) to determine PCR efficiency for the housekeeping gene 16S and each test gene. qRT-PCR reactions were set up in biological triplicate and technical
duplicate in a BIORAD PCR tray using 1ml neat cDNA for test genes and 1ml of a 1:1000 dilution cDNA for 16S. qRT-PCR was carried out in a CFX-96 Real-time machine (BIORAD, UK) and data was analysed using CFX Manager (BIORAD, UK). Expression ratios were calculated using theDDct method, taking into account the primer efficiencies and were normalised to expression of 16S.
Adhesion and Invasion Assays
SL1344 was grown overnight in either LB broth, MOPS minimal media (Teknova) or MEM (Sigma, M2279) at 37uC, with agitation and washed in PBS before being diluted in MEM supplemented with 1% NEAAs and 1% glutamine. Association and invasion assays with human intestinal epithelial cells (INT-407) were performed as previously described [24,25,26]. Briefly, washed monolayers of INT-407 cells were inoculated with 56107cfu bacteria and incubated for 2 h at 37uC in 5% CO2.
The infected monolayers were then washed and disrupted to allow the number of cfu/mL to be determined by serial dilution onto LB agar. Invasion assays were performed in parallel but after the initial 2 hour incubation the infected monolayers were washed and 2 ml of MEM containing 100 mg/L gentamicin was added to kill all external bacteria. Plates were incubated for a further 2 h and monolayers disrupted and the cfu/mL determined by serial dilution onto LB agar. Adhesion was calculated as the number of bacteria associated with the eukaryotic cells minus the number that had invaded. Each assay was repeated a minimum of three times, with each repeat including four technical replicates per bacterial strain. The results were analysed using Student’s t-test andPvalues of#0.05 were taken as significant.
Motility Assays
Swimming and swarming motility was measured as previously described [27].
Measurement of Salmonella Pathogenicity Island (SPI) Gene Expression in Single Cells Using GFP Reporters
Strains containing a chromosomal GFP reporter fused to the promoters of thessaGorprgHgenes were grown overnight in LB broth at 37uC with shaking. A 4% inoculum was added to 10 ml of either LB, MEM or minimal media and incubated at 37uC with shaking until mid-log phase (OD600 of 0.6). Cells were harvested from 500ml of culture by centrifugation and re-suspended in 1 ml PBS. 100ml of each cell suspension was added to a 96 well plate and bacteria were analysed by flow cytometry using an Accuri C6 cytometer. 10 000 data points were collected for each sample.
Results
The Transcriptome ofSalmonellais Medium Dependent
To determine the impact of medium choice, a microarray was carried out to compare the transcriptome ofS. Typhimurium after growth in LB broth and MOPS minimal medium. A total of 621 genes were differentially expressed between LB and MOPS minimal medium (B.0). Compared to growth in LB broth, 287 genes were increased in expression after growth in MOPS minimal medium (Table S2) whereas 334 were decreased in expression (Table S3). Quantitative real time RT-PCR confirmed gene expression changes for 11 genes whose expression was changed in the microarray (figure S1).
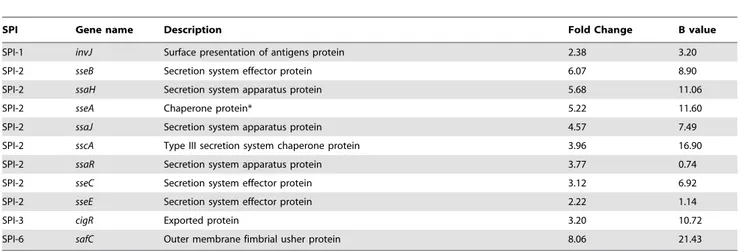
found in SPI-1,invJ, had altered expression (2.4 fold increase). In addition, one gene found in SPI-3, cigR, showed increased expression by 3.2 fold after growth in MOPS minimal medium and one gene from SPI-6,safChad expression increased by 8.06 fold. No SPI genes had reduced expression after growth in minimal media although two virulence related genes,sseJandychP, had decreased expression by 0.3 and 0.7 fold, respectively.
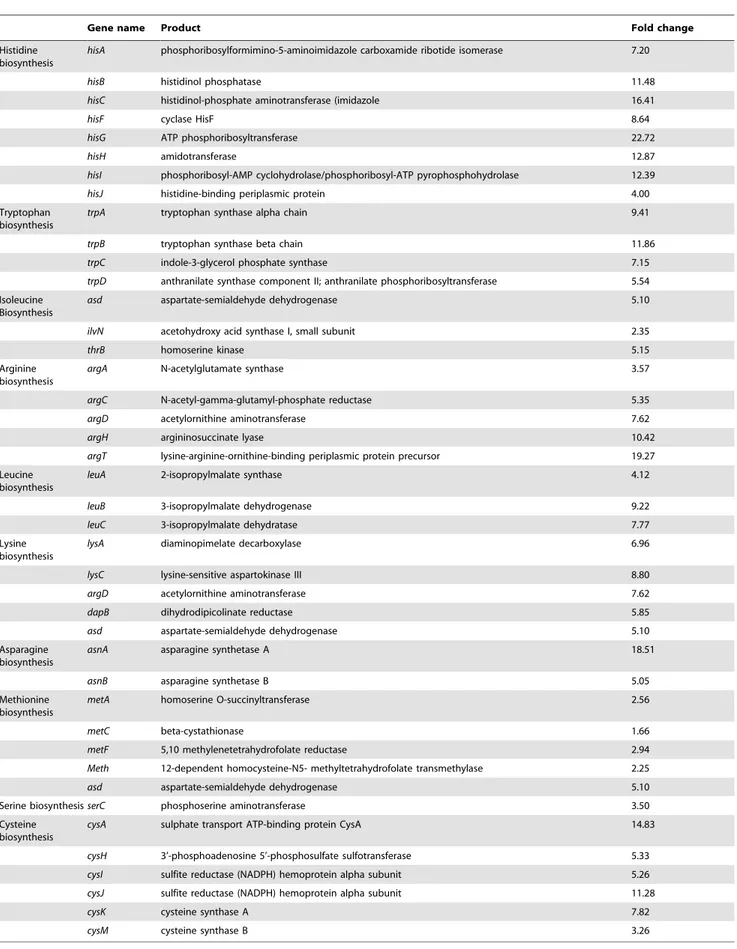
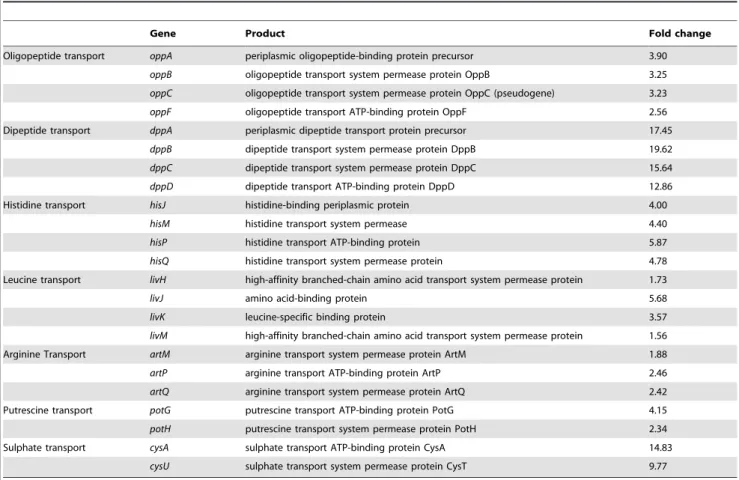
Compared with LB, growth in MOPS minimal medium also caused numerous gene expression changes in genes involved biosynthesis and transport of amino acids; there was increased expression of 42 genes involved in amino acid synthesis (Table 2). For example, after growth in minimal media there was increased expression of eight genes in the histidine biosynthesis pathway, four genes involved in tryptophan biosynthesis, three genes involved in isoleucine biosynthesis, five genes involved in arginine biosynthesis, three genes involved in leucine biosynthesis, five genes involved in lysine biosynthesis, two genes involved in asparagine biosynthesis, five genes involved in methionine biosynthesis, one gene involved in serine biosynthesis and six genes involved in cysteine biosynthesis (Table 2). In addition, growth in minimal media caused increased expression of 23 ABC transporter genes many of which are involved in amino acid transport (Table 3).
After growth in MOPS minimal media seven flagellar genes had decreased expression. This correlated with a decrease in both swimming and swarming motility on MOPS minimal semi-solid agar compared to LB semi-solid agar (Figure 1).
Overnight Growth in MOPS Minimal Medium Increases Adherence ofSalmonellato INT-407 Cellsin vitro
Adhesion of S. Typhimurium SL1344 to INT-407 cells was significantly increased after overnight growth in MOPs minimal media compared to overnight growth in LB (P= 0.04) (Figure 2). Invasion of INT-407 cells by SL1344 was not significantly altered by overnight growth in MOPs minimal media.
Growth in MEM Increases Adhesion and Expression of Genes in SPI-2
Growth in MOPS minimal medium altered ability to adhere to eukaryotic cells compared with growth in LB and impacted the expression of genes related to virulence. In bacteriology, many
assays that measure attributes of virulence, including adhesion and invasion, use tissue culture media such as Minimal Essential Medium (MEM). Therefore, the effect of growth in MEM was assessed to inform experimental design of these assays and to deduce the biological effect of this medium choice.
Adhesion ofS.Typhimurium SL1344 to INT-407 cells was also significantly increased after overnight growth in MEM compared to overnight growth in LB (P= 0.05) although the effect was less pronounced than that seen after growth in MOPS minimal medium (Figure 2). Invasion of INT-407 cells by SL1344 was not significantly altered by overnight growth in MEM.
After growth in MEM the expression of selected genes, whose expression was altered after growth in MOPS minimal medium, was measured to see whether expression changes were similar in the two medium types and if this could explain the differences in infection phenotype. As many SPI-2 genes had altered expression after growth in MOPs minimal medium, three genes from this group were selected including a chaperone (sseA), an effector protein (sseB) and a component of the T3SS apparatus (ssaH). The microarray and RT-PCR both showed that each of these genes had increased expression after growth in MOPS minimal medium compared to LB broth. After growth in MEM the expression of sseA,sseBandsseHwas also increased compared to LB; expression ofsseAandsseBwas increased to a similar extent in both MOPS minimal medium and MEM butsseHwas expressed at a higher level in MEM than in MOPS minimal medium or LB broth (Table 4).
Medium Type Alters the Proportion of the Population Expressing SPI-1 or SPI-2
Genes from SPI-1 and SPI-2 are expressed by only a portion of the total population [10,11,12] so techniques such as microarrays and RT-PCR, which measure gene expression across a whole population, give only partial information about gene expression in the bacterial population. Strains containing promoters of either prgH(SPI-1) orssaG(SPI-2) fused togfpwere used to compare the percentage of cells in the population expressing SPI-1 or SPI-2 in different media using flow cytometry. After growth to mid logarithmic phase in LB broth 17.52% of the SL1344 population expressed SPI-1-GFP and 14.25% expressed SPI-2-GFP. In comparison, growth in MEM or MOPS minimal medium did
Table 1.Genes found inSalmonellapathogenicity islands with altered expression after growth of SL1344 in minimal media compared to growth in LB media.
SPI Gene name Description Fold Change B value
SPI-1 invJ Surface presentation of antigens protein 2.38 3.20
SPI-2 sseB Secretion system effector protein 6.07 8.90
SPI-2 ssaH Secretion system apparatus protein 5.68 11.06
SPI-2 sseA Chaperone protein* 5.22 11.60
SPI-2 ssaJ Secretion system apparatus protein 4.57 7.49
SPI-2 sscA Type III secretion system chaperone protein 3.96 16.90
SPI-2 ssaR Secretion system apparatus protein 3.77 0.74
SPI-2 sseC Secretion system effector protein 3.12 6.92
SPI-2 sseE Secretion system effector protein 2.22 1.14
SPI-3 cigR Exported protein 3.20 10.72
SPI-6 safC Outer membrane fimbrial usher protein 8.06 21.43
Table 2.Genes involved in amino acid biosynthesis that had increased expression after growth of SL1344 in minimal media compared to LB.
Gene name Product Fold change
Histidine biosynthesis
hisA phosphoribosylformimino-5-aminoimidazole carboxamide ribotide isomerase 7.20
hisB histidinol phosphatase 11.48
hisC histidinol-phosphate aminotransferase (imidazole 16.41
hisF cyclase HisF 8.64
hisG ATP phosphoribosyltransferase 22.72
hisH amidotransferase 12.87
hisI phosphoribosyl-AMP cyclohydrolase/phosphoribosyl-ATP pyrophosphohydrolase 12.39
hisJ histidine-binding periplasmic protein 4.00
Tryptophan biosynthesis
trpA tryptophan synthase alpha chain 9.41
trpB tryptophan synthase beta chain 11.86
trpC indole-3-glycerol phosphate synthase 7.15
trpD anthranilate synthase component II; anthranilate phosphoribosyltransferase 5.54
Isoleucine Biosynthesis
asd aspartate-semialdehyde dehydrogenase 5.10
ilvN acetohydroxy acid synthase I, small subunit 2.35
thrB homoserine kinase 5.15
Arginine biosynthesis
argA N-acetylglutamate synthase 3.57
argC N-acetyl-gamma-glutamyl-phosphate reductase 5.35
argD acetylornithine aminotransferase 7.62
argH argininosuccinate lyase 10.42
argT lysine-arginine-ornithine-binding periplasmic protein precursor 19.27
Leucine biosynthesis
leuA 2-isopropylmalate synthase 4.12
leuB 3-isopropylmalate dehydrogenase 9.22
leuC 3-isopropylmalate dehydratase 7.77
Lysine biosynthesis
lysA diaminopimelate decarboxylase 6.96
lysC lysine-sensitive aspartokinase III 8.80
argD acetylornithine aminotransferase 7.62
dapB dihydrodipicolinate reductase 5.85
asd aspartate-semialdehyde dehydrogenase 5.10
Asparagine biosynthesis
asnA asparagine synthetase A 18.51
asnB asparagine synthetase B 5.05
Methionine biosynthesis
metA homoserine O-succinyltransferase 2.56
metC beta-cystathionase 1.66
metF 5,10 methylenetetrahydrofolate reductase 2.94
Meth 12-dependent homocysteine-N5- methyltetrahydrofolate transmethylase 2.25
asd aspartate-semialdehyde dehydrogenase 5.10
Serine biosynthesisserC phosphoserine aminotransferase 3.50
Cysteine biosynthesis
cysA sulphate transport ATP-binding protein CysA 14.83
cysH 3’-phosphoadenosine 5’-phosphosulfate sulfotransferase 5.33
cysI sulfite reductase (NADPH) hemoprotein alpha subunit 5.26
cysJ sulfite reductase (NADPH) hemoprotein alpha subunit 11.28
cysK cysteine synthase A 7.82
cysM cysteine synthase B 3.26
not significantly alter the percentage of cells expressing SPI-1. However, the percentage of the bacterial population expressing SPI-2 was significantly increased after growth in either MEM or MOPS minimal medium (33.53% and 26.8%, respectively) (Figure 3).
Discussion
The transcriptomic differences after growth ofS.Typhimurium to mid-logarithmic phase in different media were profound. For
example, there was increased expression of many genes involved in amino acid biosynthesis and transport after growth in MOPS minimal medium. This is not un-expected as there are fewer amino acids in the MOPS minimal medium than in the rich medium so during growth in MOPS minimal medium the relevant metabolic pathways are up-regulated to synthesise and transport the necessary precursor molecules. This finding is similar to that of Tao and colleagues who found increased expression of amino acid biosynthetic pathways in Escherichia coli after growth in M63
Table 3.ABC Transporter genes with increased expression after growth of SL1344 in minimal media.
Gene Product Fold change
Oligopeptide transport oppA periplasmic oligopeptide-binding protein precursor 3.90
oppB oligopeptide transport system permease protein OppB 3.25
oppC oligopeptide transport system permease protein OppC (pseudogene) 3.23
oppF oligopeptide transport ATP-binding protein OppF 2.56
Dipeptide transport dppA periplasmic dipeptide transport protein precursor 17.45
dppB dipeptide transport system permease protein DppB 19.62
dppC dipeptide transport system permease protein DppC 15.64
dppD dipeptide transport ATP-binding protein DppD 12.86
Histidine transport hisJ histidine-binding periplasmic protein 4.00
hisM histidine transport system permease 4.40
hisP histidine transport ATP-binding protein 5.87
hisQ histidine transport system permease protein 4.78
Leucine transport livH high-affinity branched-chain amino acid transport system permease protein 1.73
livJ amino acid-binding protein 5.68
livK leucine-specific binding protein 3.57
livM high-affinity branched-chain amino acid transport system permease protein 1.56
Arginine Transport artM arginine transport system permease protein ArtM 1.88
artP arginine transport ATP-binding protein ArtP 2.46
artQ arginine transport system permease protein ArtQ 2.42
Putrescine transport potG putrescine transport ATP-binding protein PotG 4.15
potH putrescine transport system permease protein PotH 2.34
Sulphate transport cysA sulphate transport ATP-binding protein CysA 14.83
cysU sulphate transport system permease protein CysT 9.77
doi:10.1371/journal.pone.0063912.t003
Figure 1. Swimming (A) and Swarming (B) Motility of SL1344 was reduced on MOPS minimal medium.Data are displayed as a mean of at least three separate experiments+/2standard deviation.
minimal medium [28]. Other patterns detected in the transcrip-tomic data resulted in measurable phenotypic differences. For example, after growth in MOPS minimal medium there was decreased expression of several genes involved in motility and this corresponded with decreased swimming and swarming motility on MOPS minimal medium compared to LB medium. Additionally, growth in MOPS minimal medium or MEM increased expression of SPI-2 and altered the adhesive ability of Salmonella to INT-407 cells growing in tissue culture. The increase in adhesion of SL1344 after growth in minimal media may be due to altered expression of fimbrial adhesins as the safC gene encoding the small outer membrane fimbrial usher protein had increased expression by
8.06 fold after growth in minimal media (Table 1). However, further work would be required to confirm this link. The lack of change in expression of genes in SPI-1 correlates with the level of invasion being unaltered.
Expression of SPI-1 and SPI-2 are controlled in response to environmental cues that signal when these systems are required.In vivoSPI-2 expression is increased whenSalmonellaare intracellular to allow intracellular survival and replication [29]. Interestingly, the same SPI-2 genes with increased expression in MOPS minimal medium (Table 1) were also increased in expression after replication ofSalmonellaTyphimurium SL1344 in murine macro-phages (between 5.96 and 10.68 fold) [8]. Concentrations of Ca2+ Figure 2. Adhesion (A) and Invasion (B) of SL1344 into INT-407 after growth in LB broth, MEM or MOPS minimal medium. Data are displayed as mean of at least three separate experiments performed in triplicate+standard deviation. For each strain values after growth in MEM or MOPS minimal medium were compared to the value for LB. Values returning a p value of#0.05 from a Student’s T-test are denoted by *. doi:10.1371/journal.pone.0063912.g002
Table 4.Expression of SPI-2 genes is increased by growth in MEM or Minimal media.
Gene Media Normalised Fold Expression Relative to LB
Microarray data Real-time RT-PCR
sseA(SPI-2 chaperone protein) MEM 5.86
Min 5.22 4.94
sseB(SPI-2 secretion system effector protein) MEM 3.09
Min 6.07 2.00
ssaH(SPI-2 secretion system apparatus protein) MEM 2.18
Min 5.68 11.76
or and Mg2+
below 8mM were shown to induce SPI-2 expression [16]. The Ca2+
concentration inside macrophage lysosomes has been estimated to be around 400mM (at least five times lower than the extracellular concentration of 2 mM) and MOPS minimal medium contains much less Ca2+
than this (,0.5mM) [20]. Therefore, we hypothesise that increased SPI-2 expression after growth in minimal media could be due to the very low Ca2+
concentration [18,30]. However, the concentration of Mg2+
in MOPS minimal medium is 500mM, 2.5 times higher than in LB, so Mg2+
is unlikely to be a contributory factor [20].
The microarray study and confirmatory RT-PCRs showed increased SPI-2 transcript levels. These techniques, and those using reporter constructs in studies cited above, measure the transcript level across the whole population. However, expression of SPI genes is bimodal [10,11,12]. Here, for the first time, we have studied the effect of medium choice on SPI-2 expression at the individual cell level. SL1344 containing GFP reporter constructs to measure SPI-1 and SPI-2 expression were grown in the different types of medium and then analysed by flow cytometry. This showed that the reported increase in population transcript level related to an increased proportion of the population expressing the 2 genes. The finding that the SPI-2 induction by environmental conditions does not affect the whole population in the same way is important information for experimental design of future studies ofSalmonellaphenotype and virulence gene expression. Furthermore, not only is the medium choice important but when studying expression of pathogenicity island genes, techniques such as flow cytometry which allow quantification of expression on the single cell level as well as studies at the whole population level, should be used.
In summary, our study shows that the impact of medium choice on the transcriptome of the model pathogen Salmonella is profound and therefore, the choice of laboratory medium is an important consideration for all microbiological studies.
Supporting Information
Figure S1 (TIF)
Table S1 Primers used in this study. (DOC)
Table S2 Groups of S. Typhimurium genes with increased expression after growth in MOPS minimal medium.
(DOC)
Table S3 Groups of S. Typhimurium genes with decreased expression after growth in MOPS minimal medium.
(DOC)
Acknowledgments
We thank Mark Jepson and Jay Hinton for providing strains for this study.
Author Contributions
Conceived and designed the experiments: JMAB LJVP. Performed the experiments: JMAB AMB GER. Analyzed the data: JMAB AI. Contributed reagents/materials/analysis tools: LJVP. Wrote the paper: JMAB LJVP.
References
1. Majowicz SE, Musto J, Scallan E, Angulo FJ, Kirk M, et al. (2010) The Global Burden of Nontyphoidal Salmonella Gastroenteritis. Clinical Infectious Diseases 50: 882–889.
2. Steele-Mortimer O, Brumell JH, Knodler LA, Me´resse S, Lopez A, et al. (2002) The invasion-associated type III secretion system ofSalmonella entericaserovar Typhimurium is necessary for intracellular proliferation and vacuole biogenesis in epithelial cells. Cellular Microbiology 4: 43–54.
3. Zhou D, Chen L, Hernandez L, Shears S, Gala´n J (2001) ASalmonellainositol polyphosphatase acts in conjunction with other bacterial effectors to promote
host cell actin cytoskeleton rearrangements and bacterial internalization. Molecular Microbiology 39: 248–260.
4. Haraga A, Ohlson MB, Miller SI (2008) Salmonellae interplay with host cells. Nat Rev Micro 6: 53–66.
5. Ochman H, Soncini FC, Solomon F, Groisman EA (1996) Identification of a pathogenicity island required for Salmonella survival in host cells. Proceedings of the National Academy of Sciences of the United States of America 93: 7800– 7804.
Figure 3. Growth in MEM or MOPS minimal medium increased the proportion of the population expressing SPI-2.Representative flow cytometry spectra showing percentage of cells expressing GFP after growth in LB (A), MOPS minimal medium (B) and MEM (C).
6. Cirillo D, Valdivia R, Monack D, Falkow S (1998) Macrophage-dependent induction of theSalmonellapathogenicity island 2 type III secretion system and its role in intracellular survival. Molecular Microbiology 30: 175–188.
7. Hensel M, Shea JE, Waterman SR, Mundy R, Nikolaus T, et al. (1998) Genes encoding putative effector proteins of the type III secretion system of Salmonella pathogenicity island 2 are required for bacterial virulence and proliferation in macrophages. Molecular Microbiology 30: 163–174.
8. Eriksson S, Lucchini S, Thompson A, Rhen M, Hinton J (2003) Unravelling the biology of macrophage infection by gene expression profiling of intracellular
Salmonella enterica. Molecular Microbiology 47: 103–118.
9. Hautefort I, Thompson A, Eriksson-Ygberg S, Parker ML, Lucchini S, et al. (2008) During infection of epithelial cellsSalmonella entericaserovar Typhimurium undergoes a time-dependent transcriptional adaptation that results in simulta-neous expression of three type 3 secretion systems. Cellular Microbiology 10: 958–984.
10. Hautefort I, Proenca MJ, Hinton JCD (2003) Single-Copy Green Fluorescent Protein Gene Fusions Allow Accurate Measurement of Salmonella Gene Expression In Vitro and during Infection of Mammalian Cells. Appl Environ Microbiol 69: 7480–7491.
11. Sturm A, Heinemann M, Arnoldini M, Benecke A, Ackermann M, et al. (2011) The Cost of Virulence: Retarded Growth of SalmonellaTyphimurium Cells Expressing Type III Secretion System 1. PLoS Pathog 7: e1002143. 12. Clark L, Perrett CA, Malt L, Harward C, Humphrey S, et al. (2011) Differences
inSalmonella entericaserovar Typhimurium strain invasiveness are associated with heterogeneity in SPI-1 gene expression. Microbiology 157: 2072–2083. 13. Bajaj V, Lucas RL, Hwang C, Lee CA (1996) Co-ordinate regulation of
Salmonella typhimuriuminvasion genes by environmental and regulatory factors is mediated by control of hilA expression. Molecular Microbiology 22: 703–714. 14. Coombes BK, Brown NF, Valdez Y, Brumell JH, Finlay BB (2004) Expression
and Secretion of Salmonella Pathogenicity Island-2 Virulence Genes in Response to Acidification Exhibit Differential Requirements of a Functional Type III Secretion Apparatus and SsaL. Journal of Biological Chemistry 279: 49804–49815.
15. Beuzo´n CR, Banks G, Deiwick J, Hensel M, Holden DW (1999) pH-dependent secretion of SseB, a product of the SPI-2 type III secretion system ofSalmonella typhimurium. Molecular Microbiology 33: 806–816.
16. Deiwick J, Nikolaus T, Erdogan S, Hensel M (1999) Environmental regulation of Salmonella pathogenicity island 2 gene expression. Molecular Microbiology 31: 1759–1773.
17. Lee AK, Detweiler CS, Falkow S (2000) OmpR regulates the two-component system SsrA-ssrB in Salmonella pathogenicity island 2. Journal of Bacteriology 182: 771–781.
18. Garmendia J, Beuzo´n CR, Ruiz-Albert J, Holden DW (2003) The roles of SsrA– SsrB and OmpR–EnvZ in the regulation of genes encoding the Salmonella typhimuriumSPI-2 type III secretion system. Microbiology 149: 2385–2396. 19. Wray C, Sojka W (1978) ExperimentalSalmonella typhimuriuminfection in calves.
Res Vet Sci 25: 139–143.
20. Neidhardt FC, Bloch PL, Smith DF (1974) Culture Medium for Enterobacteria. Journal of Bacteriology 119: 736–747.
21. Bailey AM, Webber MA, Piddock LJV (2006) Medium Plays a Role in Determining Expression ofacrB,marA, andsoxSinEscherichia coli. Antimicrob Agents Chemother 50: 1071–1074.
22. Webber MA, Bailey AM, Blair JMA, Morgan E, Stevens MP, et al. (2009) The Global Consequence of Disruption of the AcrAB-TolC Efflux Pump inSalmonella entericaIncludes Reduced Expression of SPI-1 and Other Attributes Required To Infect the Host. J Bacteriol 191: 4276–4285.
23. Bustin SA, Benes V, Garson JA, Hellemans J, Huggett J, et al. (2009) The MIQE Guidelines: Minimum Information for Publication of Quantitative Real-Time PCR Experiments. Clinical Chemistry 55: 611–622.
24. Dibb-Fuller MP, Allen-Vercoe E, Thorns CJ, Woodward MJ (1999) Fimbriae-and flagella-mediated association with Fimbriae-and invasion of cultured epithelial cells by
Salmonella enteritidis. Microbiology 145: 1023–1031.
25. Buckley A, M., Webber M, A., Cooles S, Randall L, P., La Ragione R, M., etal. (2006) The AcrAB-TolC efflux system ofSalmonella entericaserovar Typhimurium plays a role in pathogenesis. Cellular Microbiology 8: 847–856.
26. Blair JMA, La Ragione RM, Woodward MJ, Piddock LJV (2009) Periplasmic adaptor protein AcrA has a distinct role in the antibiotic resistance and virulence ofSalmonella entericaserovar Typhimurium. J Antimicrob Chemother 64: dkp311. 27. Webber MA, Bailey AM, Blair JMA, Morgan E, Stevens MP, et al. (2009) The global consequence of disruption of the AcrAB-TolC efflux pump inSalmonella entericaincludes reduced expression of SPI-1 and other attributes required to infect the host. J Bacteriol 191: 4276–4285.
28. Tao H, Bausch C, Richmond C, Blattner FR, Conway T (1999) Functional Genomics: Expression Analysis ofEscherichia coliGrowing on Minimal and Rich Media. Journal of Bacteriology 181: 6425–6440.
29. Cirillo DM, Valdivia RH, Monack DM, Falkow S (1998) Macrophage-dependent induction of the Salmonella pathogenicity island 2 type III secretion system and its role in intracellular survival. Molecular Microbiology 30: 175– 188.