Distinctiveness of Lions in West and Central
Africa
Laura D. Bertola1,2*, Laura Tensen3, Pim van Hooft4, Paula A. White5, Carlos A. Driscoll6, Philipp Henschel7, Anthony Caragiulo8, Isabela Dias-Freedman8, Etotépé
A. Sogbohossou1,9, Pricelia N. Tumenta1,10, Tuqa H. Jirmo1, Geert R. de Snoo1, Hans H. de Iongh1,11☯, Klaas Vrieling2☯
1Leiden University, Institute of Environmental Sciences (CML), PO Box 9518, 2300, RA Leiden, The Netherlands,2Leiden University, Institute of Biology Leiden (IBL), PO Box 9505, 2300, RA Leiden, The Netherlands,3University of Johannesburg, Department of Zoology, PO Box 524, Johannesburg, Johannesburg, Republic of South Africa,4Wageningen University, Resource Ecology Group,
Droevendaalsesteeg 3a, 6708, PB Wageningen, The Netherlands,5Center for Tropical Research, Institute of the Environment and Sustainability, La Kretz Hall Suite 300, 619 Charles E. Young Dr. East, University of California Los Angeles, Los Angeles, CA, 90095–1496, United States of America,6Wildlife Institute of India, Dehradun, 248 001, Uttarakhand, India,7Panthera, 8 West 40th Street, 18th Floor, New York, NY, 10018, United States of America,8Sackler Institute for Comparative Genomics, American Museum of Natural History, 79th Street at Central Park West, New York, NY, 10024, United States of America,9Laboratoire d’Ecologie Appliquée, Université d’Abomey-Calavi, Champ de Foire 03 BP 1974, Cotonou, Benin,10 Centre for Environment and Development Studies in Cameroon, University of Dschang, BP 410, Maroua,
Cameroon,11 University of Antwerp, Department Biology, Evolutionary Ecology Group, Groenenborgerlaan 171, 2020, Antwerpen, Belgium
☯These authors contributed equally to this work. *bertola@cml.leidenuniv.nl
Abstract
The evolutionary history of a species is key for understanding the taxonomy and for the design of effective management strategies for species conservation. The knowledge about the phylogenetic position of the lion (Panthera leo) in West/Central Africa is largely based on mitochondrial markers. Previous studies using mtDNA only have shown this region to hold a distinct evolutionary lineage. In addition, anthropogenic factors have led to a strong decline in West/Central African lion numbers, thus, the conservation value of these popula-tions is particularly high. Here, we investigate whether autosomal markers are concordant with previously described phylogeographic patterns, and confirm the unique position of the West/Central African lion. Analysis of 20 microsatellites and 1,454 bp of the mitochondrial DNA in 16 lion populations representing the entire geographic range of the species found congruence in both types of markers, identifying four clusters: 1) West/Central Africa, 2) East Africa, 3) Southern Africa and 4) India. This is not in line with the current taxonomy, as defined by the IUCN, which only recognizes an African and an Asiatic subspecies. There are no indications that genetic diversity in West/Central Africa lions is lower than in either East or Southern Africa, however, given this genetic distinction and the recent declines of lion numbers in this region, we strongly recommend prioritization of conservation projects in OPEN ACCESS
Citation:Bertola LD, Tensen L, van Hooft P, White PA, Driscoll CA, Henschel P, et al. (2015) Autosomal and mtDNA Markers Affirm the Distinctiveness of Lions in West and Central Africa. PLoS ONE 10(10): e0137975. doi:10.1371/journal.pone.0137975
Editor:Michael Hofreiter, University of York, UNITED KINGDOM
Received:June 12, 2014
Accepted:August 25, 2015
Published:October 14, 2015
Copyright:© 2015 Bertola et al. This is an open access article distributed under the terms of the
Creative Commons Attribution License, which permits unrestricted use, distribution, and reproduction in any medium, provided the original author and source are credited.
Data Availability Statement:DNA sequences have
been deposited in Genbank with accession numbers KJ652247-KJ652251 and fragment length data for microsatellites are included in SupplementalS3 Table.
Funding:The investigations were supported by the Division for Earth and Life Sciences (ALW) with financial aid from the Netherlands Organization for Scientific Research (NWO) (project no. 820.01.002).
Competing Interests:The authors have declared
West/Central Africa. As the current taxonomic nomenclature does not reflect the evolution-ary history of the lion, we suggest that a taxonomic revision of the lion is warranted.
Introduction
Identifying and describing patterns of mitochondrial (mtDNA) and nuclear genetic variation is a crucial component to fully understanding the evolutionary history of a species. High quality phylogeographic data that represent the underlying genetic complexity are important for tax-onomy and contribute to designing effective conservation strategies. This is of particular importance for species such as the lion (Panthera leo) that occupy large geographic ranges within which disjunct populations may not allow for natural dispersal and gene flow. Increas-ing habitat fragmentation and variable anthropogenic factors have created a growIncreas-ing need to manage lions at the population level [1]. In addition, several recent publications have sparked the discussion whether the current taxonomic nomenclature for the lion is justified [2–4].
Two subspecies of lion are officially recognized by the IUCN, based on genetic data [5,6]: the African lion (Panthera leo leo), ranging throughout sub-Saharan Africa with the exception of dense rain forest, and the Asiatic lion (Panthera leo persica), which exists as a single popula-tion in the Gir forest, India. Although all African lion populapopula-tions are considered as belonging to the African subspecies (P.l.leo), distinct subgroups have been recognized based on mor-phology [7,8] and genetics [2–5,9–12]. Analyses of morphometric data has led to the distinc-tion of at least three extant clades (“subspecies”) on the African continent [7]. Lions from the northern part of their range further showed a relatively close relationship to the Asiatic subspe-cies [7,8]. This pattern was confirmed by phylogenetic analysis of mitochondrial haplotypes only, based on which lions in West/Central Africa were described as a genetically distinct group with a relatively close genetic relationship to the Asiatic subspecies [2–4] (region defini-tions from [13,14], seeFig 1). The genetic dichotomy that separates the West/Central African lion populations from East and Southern African populations has also been found in other large mammal species and is often reflected in their taxonomy including African buffalo ( Syn-cerus caffer) [15,16], roan antelope (Hippotragus equinus) [17], hartebeest (Alcelaphus busela-phus) [18,19], giraffe (Giraffa camelopardalis) [20,21] and cheetah (Acinonyx jubatus) [22,23].
Due to the genetic differentiation within the African lion and the nested position of the Asi-atic lion subspecies within the West/Central Africa clade based on mtDNA, the current taxo-nomic division is challenged [2–4]. However, mtDNA is a single, non recombining locus in the maternal lineage and does not permit the detection of admixture events and sorting at multiple loci as may occur in autosomal markers. Therefore, the observed pattern in mtDNA data may not adequately depict the underlying genetic complexity. Autosomal data are needed to corrob-orate the topology based on mtDNA, since conflicting patterns between phylogenies based on mtDNA and phylogenies based on autosomal markers have been described in several other species [24–29]. Most commonly a monophyletic pattern is detected in the mtDNA, but is not supported, or is contradicted, by phylogenies based on autosomal loci. This is often explained by incomplete lineage sorting, as coalescence time in mtDNA is four times shorter than in autosomal markers. Since lineage sorting during the process of coalescence has a random nature, this could also lead to an‘incorrect’gene tree by mtDNA markers if populations’ diver-gences were closely spaced in time. Female philopatry is another strong contributing factor in mtDNA trees. As gene flow in lions is biased towards the male sex [30,31], gene trees based on autosomal markers may show less discrete groups. This argument has been used by Antunes
markers. Taxonomic revisions have potentially far-reaching ramifications with regard to man-agement (e.g., CITES, USFWS, IUCN) and, therefore, should be approached cautiously. Ideally, proposed revisions should be supported by a combination of biogeographic, mtDNA and auto-somal DNA, and morphological data.
In this study, we analyzed 20 microsatellite loci for lions from thirteen wild populations, one of which is located in West Africa (Benin) and four in Central Africa (Chad, DRC and two from Cameroon). Furthermore, we included microsatellite data from another West African population in Senegal and from two distinct zoo populations of Ethiopian lions representing the region where the two major genetic lineages (i.e., West/Central Africa and East/Southern Africa) may connect. To compare the phylogenetic clusters derived from the microsatellite data and to check for congruence with previously published patterns, we included data from 1,454 base pairs (bp) of the mitochondrial DNA for each sampling location. Using this approach, we are aiming to contribute to the ongoing discussion about lion taxonomy by answering four questions: 1) Do autosomal data support previously described phylogenetic groupings in the lion in general and the distinct position of the West/Central African lion in particular?, 2) Can an effect of sex-biased gene flow be detected?, 3) How genetically distinct are the sampled populations, at both the continental and regional scales, and do levels of genetic diversity vary amongst regional subdivisions, with a special focus on West/Central Africa? and 4) Are there signs for reduced genetic diversity in particular lion populations with
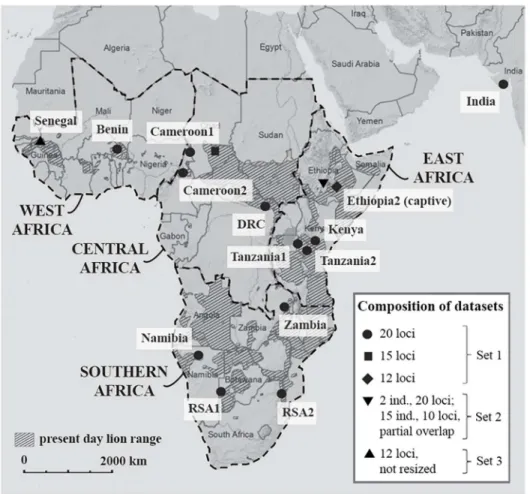
Fig 1. Map showing the location of the 16 lion populations included in the analysis.In the legend, the composition of the datasets and the number of included microsatellite loci is indicated. Lion range data from IUCN (2014). Region definitions from IUCN SSC Cat Specialist Group (2006a; b).
an emphasis on West/Central Africa? Our study is the first to include multiple lion populations from West/Central Africa, using both autosomal and mtDNA markers in a phylogenetic con-text covering the entire current geographic range of the lion.
Material and Methods
We processed a total of 48 samples from eight populations, including one population from West Africa (Benin), four populations from Central Africa (two from Cameroon, one from Chad and one from DRC), two populations from East Africa (Ethiopia2 (captive) and Kenya) and one population from Southern Africa (Zambia). Except for Ethiopia2, all samples origi-nated from free-ranging lions, with no known history of anthropogenic introductions of lions from other populations. Samples were collected in full compliance with specific permits (CITES and permits related to national legislation in the countries of origin). Details on per-mits, sample storage, DNA extraction, polymerase chain reaction (PCR) amplification, frag-ment analysis and quality control are given inS1 File. SeeS1 TableandS2 Tablefor used loci and primer information. All microsatellite allele length data are given inS2 File.
Generated microsatellite data were supplemented by published data for the same 20 loci from another six populations [32], together summarized as Dataset 1. Dataset 2 [12] consists of all 15 samples from Ethiopia1 (captive) with ten analyzed loci, of which six are overlapping with our dataset. For two samples from Ethiopia1, all 20 microsatellites were analyzed and added to Dataset 1. Dataset 3 (Panthera/AMNH) contains microsatellite data from 12 loci for seven lions from Senegal, which could not be resized to Dataset 1 and were therefore only included for calculation of diversity indices and bottleneck statistics (for details on permits and the processing of Senegal samples, seeS3 File). An overview of datasets used in each analysis is provided inFig 1andTable 1.
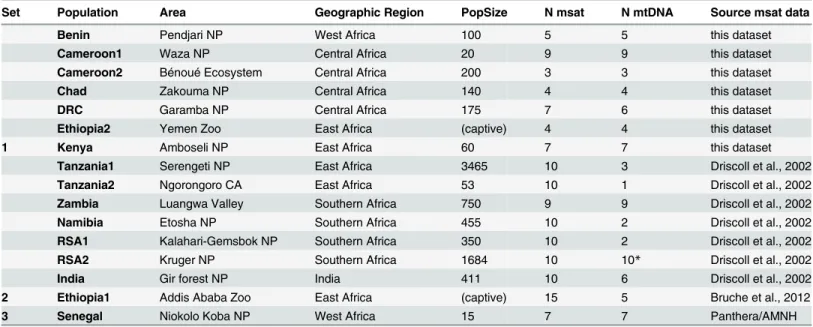
Table 1. Overview of lion populations included in this study.
Set Population Area Geographic Region PopSize N msat N mtDNA Source msat data
Benin Pendjari NP West Africa 100 5 5 this dataset
Cameroon1 Waza NP Central Africa 20 9 9 this dataset
Cameroon2 Bénoué Ecosystem Central Africa 200 3 3 this dataset
Chad Zakouma NP Central Africa 140 4 4 this dataset
DRC Garamba NP Central Africa 175 7 6 this dataset
Ethiopia2 Yemen Zoo East Africa (captive) 4 4 this dataset
1 Kenya Amboseli NP East Africa 60 7 7 this dataset
Tanzania1 Serengeti NP East Africa 3465 10 3 Driscoll et al., 2002
Tanzania2 Ngorongoro CA East Africa 53 10 1 Driscoll et al., 2002
Zambia Luangwa Valley Southern Africa 750 9 9 Driscoll et al., 2002
Namibia Etosha NP Southern Africa 455 10 2 Driscoll et al., 2002
RSA1 Kalahari-Gemsbok NP Southern Africa 350 10 2 Driscoll et al., 2002
RSA2 Kruger NP Southern Africa 1684 10 10* Driscoll et al., 2002
India Gir forest NP India 411 10 6 Driscoll et al., 2002
2 Ethiopia1 Addis Ababa Zoo East Africa (captive) 15 5 Bruche et al., 2012
3 Senegal Niokolo Koba NP West Africa 15 7 7 Panthera/AMNH
PopSize: population size according to the most recent estimate in Riggio et al. (2012) for the African populations, except for Zambia: Paula White (personal communication); estimate for the Indian population from [56]
N msat: number of sampled individuals for microsatellite analysis N mtDNA: number of sampled individuals for mtDNA analysis. *mtDNA and microsatellite data are not from the same samples.
STRUCTURE 2.3.3 [33] was used for assessing population structure in Dataset 1 with unknown loci scored as missing data. Simulations were run assuming the admixture model with correlated allele frequencies. Ten runs were performed for K = 1 to K = 8, using
10,000,000 permutations and a burn-in period of 1,000,000. To check the assignment of Ethio-pia1 to any of the clusters identified by STRUCTURE, we included the two Ethiopian samples for all 20 microsatellites. Structure Harvester [34] was used to determine the most likely num-ber of clusters, following theΔK method [35]. CLUMPP was used to combine replicate runs and avoid label switching [36]. Clustering of individuals was further assessed by performing Principal Component Analysis (PCA) in GenAlEx 6.501 [37]. A neighbour-joining tree was created based on DAdistance in POPTREE2 using 1,000 bootstraps [38].
For each sampling location, a mitochondrial region of 1,454 bp that encompassed cyto-chrome B (cytB), tRNAThr, tRNAPro and part of the control region was included for a number of individuals (Table 1). Details on polymerase chain reaction (PCR) amplification and sequencing are given inS1 File. Sequences were deposited in GenBank and supplemented by sequences previously published by Bertolaet al. (2011) (seeS4 Filefor sequence data andS3 Tablefor accession numbers). Variable sites and nucleotide diversity were calculated using ARLEQUIN 3.5 [39]. For phylogenetic analysis, a haplotype network was created using the median-joining algorithm in Network 4.6.1.1 (www.fluxus-engineering.com). A repeat region of cytosines of variable length was excluded due to unknown homology (positions 1382–1393) and all remaining characters were included with equal weighting.
For AMOVA of Dataset 1, individuals for which all 20 loci were analyzed were included as either 1) without an indicated substructure (as all 1 group), 2) following IUCN classification (Africa; Asia), 3) following a North/South division as was indicated from the haplotype net-work, or 4) using the four groups identified by STRUCTURE (West/Central Africa; East Africa; Southern Africa; India). Isolation By Distance (IBD) was assessed by correlating geographic to genetic distances and using a Mantel’s permutation test with 999 permutations, as imple-mented in GenAlEx 6.501 [37]. In addition, AMOVA and IBD analysis were performed on a regional level, using the regions as indicated above (Africa; North; South; West/Central Africa; East Africa; Southern Africa). Pairwise FSTand Nei’s genetic distances were computed with GenAlEx 6.501 [37] for microsatellite data and with ARLEEQUIN 3.5 for mtDNA data [39].
The average number of alleles per locus (Na) was calculated using ARLEQUIN 3.5 [39]. Pri-vate allelic richness (Ap) was calculated with HP-Rare 1.1 [40] including statistical rarefaction to compensate for different sample sizes. GenAlEx 6.501 [37] was used to calculate observed (Ho) and unbiased expected heterozygosity (uHe) [41]. To obtain insights into the risk of emergent inbreeding, FISper population was calculated in FSTAT [42] and the occurrence of recent bottlenecks was evaluated by using the program Bottleneck [43,44]. The Bottleneck test is based on the theory that during a bottleneck the allele numbers are reduced faster than the heterozygosity, leading to an excess of heterozygosity compared to the expected heterozygosity under the mutation-drift equilibrium. The program was run for 10,000 iterations, using the stepwise mutation model (SMM). Significant (P<0.05) results from the Wilcoxon signed-rank test were scored, as this test proved to be the most powerful and robust when used with few (<20) polymorphic loci [44].
Results
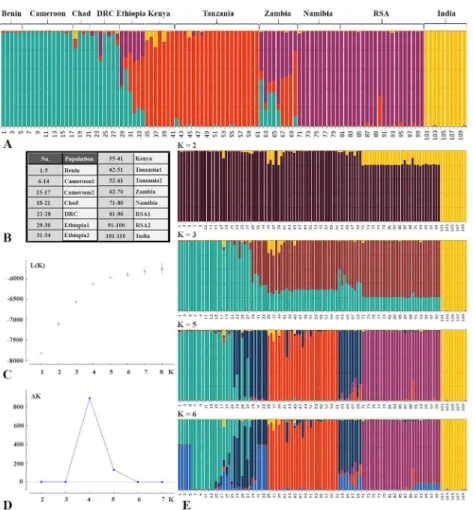
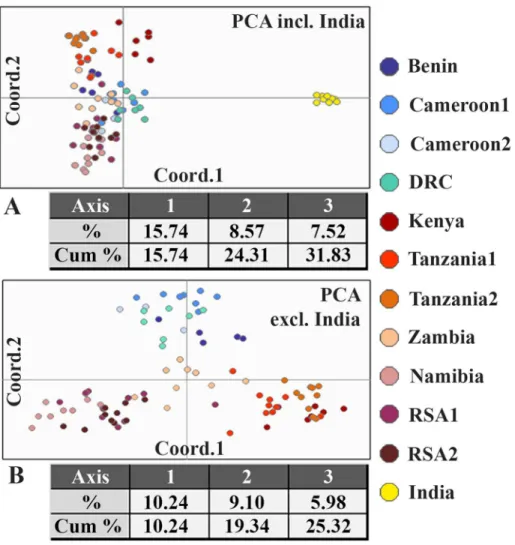
different number of clusters leads to an artificial clustering characterized by heavy admixture and results not in line with suggested evolutionary history derived from other data. Individuals from Chad are part of the West/Central Africa cluster. The Ethiopian lions show affiliation either to West/Central Africa, admixed with Southern Africa (Ethiopia1) or to East Africa, admixed with Southern Africa (Ethiopia2). The Zambia population shows a substructure as a result of admixture. All Zambian individuals are partially assigned to the Southern Africa clus-ter, and depending on the individual, either to West/Central Africa, or to East Africa. The admixed signal of the Zambia population is also visible by the central position in the plot of the first two axes of the PCA when India is excluded (Fig 3B). STRUCTURE runs were repeated excluding Indian genotypes, since PCA illustrated the effect of India (Fig 3A) and it is known that STRUCTURE has the tendency to force clustering in inappropriately small number of clusters under certain circumstances [45]. This may be the case if a single population contains markedly less genetic diversity which drives the program to place all remaining populations into a single cluster thereby providing a result which does not properly reflect the evolutionary history [45]. These analyses did not lead to a difference in clustering of the remaining individu-als and the same three groups were identified within Africa (data not shown).
Fig 2. Results of STRUCTURE analysis based on 20 microsatellite loci of 15 lion populations (Dataset 1 + 2 individuals from Ethiopia1).A: representation of assignment values found by STRUCTURE, using K = 4; B: Overview of included populations; C: Plot indicating mean log likelihood Ln (P(X|K); D: plot indicatingΔK values as a function of the number of genetic clusters (K), in whichΔK = mean(|L”(K)|)/sd(L(K)); E: Representation of assignment values found by STRUCTURE, using K = 2. K = 3, K = 5 and K = 6.
A total of 87 sequences of 1,454 bp were analyzed. Nucleotide diversity (π) was 0.102. Based
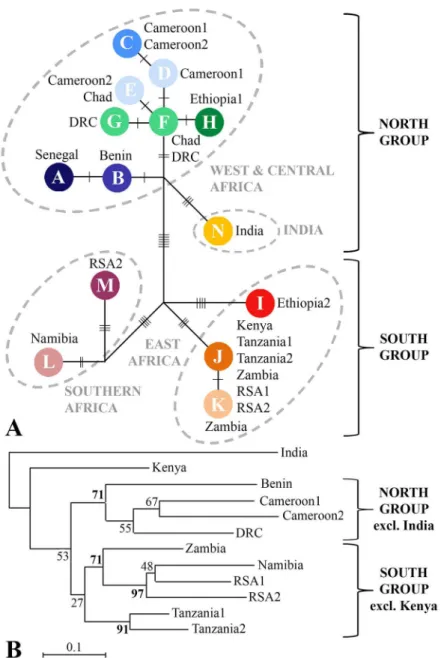
on 43 polymorphic sites, 15 different haplotypes were distinguished. The haplotype network (Fig 4A) and the neighbour-joining tree (Fig 4B) based on the microsatellite data show a simi-lar topology in which West/Central African lions are grouped together on a supported branch (bootstrap value>70) and East and Southern African lions are represented on two different supported branches (Fig 4B). A basal split into a North group (West/Central Africa and India) and a South group (East Africa and Southern Africa) is most clearly visible in the haplotype network, as the clustering of East Africa and Southern Africa on a South branch in the phenetic tree has only limited support. Furthermore, Kenya and India both have a basal and unresolved position in the tree.
Results from AMOVA of the microsatellite data show that using the clusters identified by STRUCTURE to assign populations to four groups resulted in a relatively high percentage of the molecular variance being attributed to among-groups for microsatellite data (17.4%) and mtDNA data (52.3%) (S4 Table). While in the microsatellite data the highest percentage (29.6%) of molecular variance in among-groups variance is attributed to the split between Fig 3. Results of PCA based on 20 microsatellite loci of lion populations.A: results of PCA of 12 populations (Dataset 1, excluding Chad and Ethiopia2), shown in a two-dimensional plot and a table indicating the percentage and the cumulative percentage explained by the first three axes; B: Results of PCA of 11 populations, excluding India.
Africa and Asia, i.e. between the two subspecies, no molecular variance among-groups for the Africa/Asia division is found in the mtDNA data. In addition, following the basal split in a North group and a South group, AMOVA attributes 54.6% of molecular variance to among-groups variance for mtDNA data, but only finds 7.5% in among-among-groups variance when using microsatellite data. However, absolute percentages may be misleading, as within-population variance is very different amongst the used markers.
Mantel tests showed that the effect of isolation by distance is evident, both on the continen-tal and the regional scale (summary and graphs inS5 Table). In regional analyses, the highest values for among-groups variance according to AMOVA and the highest numbers for the Fig 4. Relationship between populations of lions based on mtDNA data and on 20 microsatellite loci.
A: Haplotype network based on median-joining algorithm in Network; B: Phenetic tree based on DAgenetic
distance of microsatellite data of 12 lion populations.
slope of the trend line in IBD are found in West/Central Africa (compared to the South group, East Africa or Southern Africa) suggesting strong isolation between these populations. Pairwise FSTvalues ranged from 0.064 to 0.736 and were significant for all pairwise comparisons (50,000 permutations, P<0.05) (S6 Table). Within Africa, pairwise FSTvalues ranged from 0.064 to 0.396. Nei’s genetic distance ranged from 0.196 to 2.193 for all lion populations and within Africa it ranged from 0.196 to 2.018 (S6 Table).
Diversity indices (S7 Table) show that the Indian population comprises the lowest number of microsatellite alleles per locus, smallest allelic range and the highest number of fixed alleles. In the Indian population, 75% of the loci are fixed while in all other populations at maximum 17% of the loci are fixed. Diversity indices were found to be relatively constant across the Afri-can populations; surprisingly West/Central Africa showed no clear signs of loss of genetic diversity. Four out of seven populations in West/Central Africa contained more than one hap-lotype (Cameroon1, Cameroon2, Chad, DRC), whereas this was only observed for two out of eight populations in East and Southern Africa (Zambia and RSA2). Observed and expected het-erozygosity values further confirmed the low genetic diversity of the Indian population. FIS val-ues illustrated a significant heterozygosity excess in Benin (P<0.01) and Cameroon1 (P<0.01) and a significant heterozygosity deficiency in Zambia (P<0.01), RSA1 (P<0.05) and Ethiopia1 (P<0.05). Results of the bottleneck analysis showed that there was a significant excess of het-erozygotes found in Cameroon1 (P<0.01), Kenya (P<0.05) and Ethiopia1 (P<0.05), possibly indicating a recent reduction in population size.
Discussion
Here we describe the distinct position of lions in West/Central Africa, compared to other pop-ulations across the lion’s current geographic range, based on phylogenetic analyses of microsat-ellite and mtDNA datasets. Moreover, we assessed levels of genetic diversity across different geographic scales to detect signs of low genetic diversity.
location of Ethiopia, however, human-mediated translocations are not uncommon in zoo set-tings and may have contributed to the observed pattern. In Zambia, a substructure in the popu-lation is induced due to the two detected types of admixture: the Southern Africa cluster is admixed either with the West/Central Africa cluster, or with the East Africa cluster. These find-ings are parsimonious with the geographic isolation representative of Zambia’s Luangwa Valley which is an offshoot of the Rift Valley System. The absence of a mitochondrial haplotype from outside the East Africa cluster in the Zambian individuals indicates that the pattern of admix-ture is likely due to male-mediated gene flow.
The mtDNA haplotype network shows the same four groups as identified in the STRUC-TURE analysis: 1) West/Central Africa, 2) East Africa, 3) Southern Africa and 4) India. The deepest split in the haplotype network distinguishes a North group consisting of the West/Cen-tral African lion together with the Asiatic subspecies, and a South group consisting of lions from East and Southern Africa. Within a single country, only one or two closely related haplo-types are found, with two exceptions where more divergent haplohaplo-types are present: 1) Ethiopia, which could be explained by the geographic location of the country as previously noted, and 2) RSA2, likely due to past translocations to and amongst small reserves in RSA [49]. The neigh-bour-joining tree, based on microsatellite data also shows a distinction between lions from West/Central Africa, and populations from East and Southern Africa. The basal position of the Indian and Kenyan lions probably results from the lower genetic diversity in these populations, as is indicated by the relatively high number of monomorphic loci. Elongation of branch length resulting from a population size reduction has been previously described, especially for DAas a measure of genetic distance [50]. Despite of this, DAis commonly accepted as the most suitable measure for inferring phylogenetic relationships [51,52] and, therefore, has been used in our analyses. STRUCTURE and PCA plots show that all populations from Namibia and RSA are assigned to Southern Africa, with a more central position for the admixed Zambia population, while East African haplotypes are found in RSA. The same discrepancy was previously described by Antuneset al. (2008) and attributed to sex-biased gene flow. To further assess congruence between mtDNA and autosomal markers, a Mantel test was performed based on corrected Nei’s genetic distances for both datasets (S8 Table). This illustrates a significant rela-tionship (999 permutations, P<0.01) between both measures, which increases further after the exclusion of India. Strongest congruence in AMOVA results between the autosomal and mtDNA data are found when using the groups identified by STRUCTURE, indicating a robust phylogenetic pattern that is reflected by both genetic markers.
The four lineages we describe based on autosomal and mtDNA data are further corrobo-rated by the distinction of four groups based on morphological data [7]. Up to eight“ subspe-cies”have been used by some sources [53], with the Barbary lion (P.l.leo) very likely to be extinct and the Cape lion (P.l.melanochaita) a possible con(sub)specific withP.l.krugeri[10]. Of the remaining six subspecies, Hemmer (1974) suggests to not includeP.l.bleyenberghi
(South West Africa) andP.l.azandica(North East DRC) as fully differentiated lineages. The remaining four subspecies,P.l.persicaandP.l.senegalensisin the northern part of the range, andP.l.nubicaandP.l.krugeriin the southern part of the range correspond to India, West/ Central Africa, East Africa, and Southern Africa respectively, and reflect the deepest split in the haplotype network. Although sample size was limited, the close genetic relationship of West/ Central African lions to the Asiatic subspecies, was later reconfirmed by craniometric data [8].
the genetic distances (pairwise FSTand Nei’s genetic distance), we conclude that all sampled populations are significantly differentiated from each other.
It was hypothesized that lion populations in West Africa and parts of Central Africa were especially vulnerable to declining levels of genetic diversity since fragmentation of the habitat is particularly severe in this region. However, we did not find significant heterozygotic deficien-cies, reduced number of alleles or fixed loci in any of the six sampled populations in this region. The significantly negative FISvalues (excess of heterozygotes) may be explained by the mating system as was also shown for prides in Selous GR [31], however we acknowledge the possible effect of a small sample size in our study. The unexpectedly high levels of genetic diversity could further be explained by the fact that the range contraction and the decline of lion num-bers is too recent to show clear signs of genetic erosion. However, because genetic diversity is rapidly lost in small populations as a result of genetic drift and inbreeding, keeping the popula-tion at a genetically healthy level may require urgent management decisions to safeguard against these effects. Monitoring of an intensively managed lion population showed that drift and inbreeding were noticeable within five years after reintroduction of eleven founders from four genetic lineages [54]. The strongly significant heterozygote deficiency observed in the Zambia lion population is likely to be the result of substructure in the population (Wahlund effect), which was consistent with the results from the STRUCTURE analysis. The significantly positive FISvalue found in RSA1 is congruent with previous findings [4] and a high FISvalue in the Ethiopia1 lions can be explained by the breeding history of the population, which was founded by five males and two females in 1948 [12]. In addition, both RSA1 and Ethiopia1 were indicated by Bottleneck to have gone through recent population reductions. Similarly, Cameroon1 and Kenya appear to have experienced bottlenecks, which is consistent with obser-vations obtained from monitoring studies [1,55], although we cannot completely rule out the effect of low sample sizes. Since the excess of heterozygotes as a result of a bottleneck is tran-sient, the Bottleneck approach only detects recent reductions in population size, which explains why historically documented bottlenecks i.e., Tanzania2 and India, were not detected. Our study is the first to confirm that autosomal markers support the distinct genetic position of West/Central African lions within the African subspecies. The phylogenetic split between West/Central Africa and East/Southern Africa found in other species is reiterated in lions. Based on results derived from mtDNA data and from autosomal microsatellites, we recom-mend recognition and consideration of these four groups for management decisions: 1) West/ Central Africa, 2) East Africa, 3) Southern Africa and 4) India. In consideration of genetic dis-tinctions coupled with anthropogenic factors that are accelerating decline of wildlife in West and Central Africa, this region is of particular and urgent conservation importance. By showing a congruent phylogeographic pattern in both mtDNA and autosomal markers, our data illus-trate which populations belong to the same evolutionary lineage and may contribute impor-tantly to conservation decisions e.g., identifying suitable candidates for translocations or population augmentation. We support a revision of the taxonomic nomenclature as has been proposed by Barnettet al. (2014), following the deepest ancestral split found in the haplotype network, recognizing a North group and a South group. Primarily, as mtDNA, autosomal markers and morphological data show a congruent pattern, we believe that it is enough to sup-port a taxonomic split within the African subspecies of the lion.
Supporting Information
S1 File. Details on sample storage, DNA extraction, PCR, fragment analysis and sequenc-ing.
S2 File. Microsatellite allele length for 20 loci in 16 lion populations.
(TXT)
S3 File. Details on DNA extraction, PCR, fragment analysis for Dataset 3.
(DOCX)
S4 File. Mitochondrial haplotype sequences for 16 lion populations.
(FAS)
S1 Table. Overview of microsatellite loci used in the different lion populations.
(XLSX)
S2 Table. Primers used for amplification of microsatellites and mtDNA.
(XLSX)
S3 Table. Identified haplotypes and accompanying accession numbers from Genbank.
(XLSX)
S4 Table. Results of an AMOVA for a microsatellite dataset of 12 lion populations and a mtDNA dataset of 16 lion populations.
(XLSX)
S5 Table. Results of the Mantel tests indicating IBD effects in lion populations on a conti-nental and regional scale.
(XLSX)
S6 Table. Pairwise FST(below diagonal) and Nei's genetic distances (above diagonal) based
on 20 microsatellite loci from 14 lion populations.
(XLSX)
S7 Table. Genetic variation in microsatellite loci and mtDNA among 16 lion populations.
(XLSX)
S8 Table. Nei's (corrected) genetic distances for microsatellite (below diagonal) and mtDNA data (above diagonal) of 14 lion populations and results of Mantel tests including all populations and excluding India.
(XLSX)
Acknowledgments
Life Sciences (ALW) with financial aid from the Netherlands Organization for Scientific Research (NWO) (project no. 820.01.002).
Author Contributions
Conceived and designed the experiments: LDB KV HHdI AC ID-F GRdS. Performed the experiments: LDB LT AC IDF PvH. Analyzed the data: LDB LT AC IDF PvH. Contributed reagents/materials/analysis tools: PAW CAD PH PNT EAS THJ. Wrote the paper: LDB LT PvH PAW CAD PH AC ID-F EAS PNT THJ GRdS HHdI KV.
References
1. Riggio J, Jacobson A, Dollar L, Bauer H, Becker M, Dickman A, et al. (2012) The size of savannah Africa: a lion’s (Panthera leo) view. Biodiversity and Conservation 22: 17–35.
2. Bertola LD, van Hooft WF, Vrieling K, Uit de Weerd DR, York DS, Bauer H, et al. (2011) Genetic diver-sity, evolutionary history and implications for conservation of the lion (Panthera leo) in West and Central Africa. Journal of Biogeography 38: 1356–1367.
3. Barnett R, Yamaguchi N, Shapiro B, Ho SY, Barnes I, Sabin R, et al. (2014) Revealing the maternal demographic history ofPanthera leousing ancient DNA and a spatially explicit genealogical analysis. BMC Evolutionary Biology 14: 70. doi:10.1186/1471-2148-14-70PMID:24690312
4. Dubach JM, Briggs MB, White PA, Ament BA, Patterson BD (2013) Genetic perspectives on“Lion Con-servation Units”in Eastern and Southern Africa. Conservation Genetics 14: 741–755.
5. Dubach J, Patterson BD, Briggs MB, Venzke K, Flamand J, Stander P, et al. (2005) Molecular genetic variation across the southern and eastern geographic ranges of the African lion,Panthera leo. Conser-vation Genetics 6: 15–24.
6. O’Brien SJ, Martenson JS, Packer C, Herbst L, Vos V de, Joslin P, et al. (1987) Biochemical Genetic Variation in Geographic Isolates of African and Asiatic Lions. National Geographic Research 3: 114– 124.
7. Hemmer H (1974) Untersuchungen zur Stammesgeschichte der Pantherkatzen (Pantherinae) 3 Zur Artgeschichte des LöwenPanthera(Panthera)leo(Linnaeus 1758). München, Germany: Veröffentli-chungen der Zoologischen Staatssammlung München.
8. Mazák JH (2010) Geographical variation and phylogenetics of modern lions based on craniometric data. Journal of Zoology 281: 194–209.
9. Barnett R, Yamaguchi N, Barnes I, Cooper A (2006) The origin, current diversity and future conserva-tion of the modern lion (Panthera leo). Proceedings of the Royal Society B: Biological Sciences 273: 2119–2125. PMID:16901830
10. Barnett R, Yamaguchi N, Barnes I, Cooper A (2006) Lost populations and preserving genetic diversity in the lionPanthera leo: Implications for its ex situ conservation. Conservation Genetics 7: 507–514.
11. Antunes A, Troyer JL, Roelke ME, Pecon-Slattery J, Packer C, Winterbach C, et al. (2008) The evolu-tionary dynamics of the lionPanthera leorevealed by host and viral population genomics. PLoS Genet-ics 4: e1000251. doi:10.1371/journal.pgen.1000251PMID:18989457
12. Bruche S, Gusset M, Lippold S, Barnett R, Eulenberger K, Junhold J, et al. (2012) A genetically distinct lion (Panthera leo) population from Ethiopia. European Journal of Wildlife Research 59: 215–225.
13. IUCN SSC Cat Specialist Group (2006) Conservation strategy for the lion in West and Central Africa. Gland, Switzerland: IUCN.
14. IUCN SSC Cat Specialist Group (2006) Conservation strategy for the lion (Panthera leo) in Eastern and Southern Africa. Gland, Switzerland: IUCN.
15. Smitz N, Berthouly C, Cornélis D, Heller R, Van Hooft P, Chardonnet P, et al. (2013) Pan-African Genetic Structure in the African Buffalo (Syncerus caffer): Investigating Intraspecific Divergence. PLoS One 8: e56235. doi:10.1371/journal.pone.0056235PMID:23437100
16. Van Hooft WF, Groen AF, Prins HHT (2002) Phylogeography of the African buffalo based on mitochon-drial and Y-chromosomal loci: Pleistocene origin and population expansion of the Cape buffalo subspe-cies. Molecular Ecology 11: 267–279. PMID:11856427
17. Alpers DL, Van Vuuren BJ, Arctander P, Robinson TJ (2004) Population genetics of the roan antelope (Hippotragus equinus) with suggestions for conservation. Molecular Ecology 13: 1771–1784. PMID: 15189202
19. Flagstad O, Syvertsen PO, Stenseth NC, Jakobsen KS (2001) Environmental change and rates of evo-lution: the phylogeographic pattern within the hartebeest complex as related to climatic variation. Pro-ceedings Biological sciences / The Royal Society 268: 667–677. PMID:11321054
20. Brown DM, Brenneman R a, Koepfli K-P, Pollinger JP, Milá B, Georgiadis N, et al. (2007) Extensive population genetic structure in the giraffe. BMC Biology 5: 57. PMID:18154651
21. Hassanin A, Ropiquet A, Gourmand A-L, Chardonnet B, Rigoulet J (2007) Mitochondrial DNA variability inGiraffa camelopardalis: consequences for taxonomy, phylogeography and conservation of giraffes in West and central Africa. Comptes rendus biologies 330: 265–274. PMID:17434121
22. Freeman AR, MacHugh DE, McKeown S, Walzer C, McConnell DJ, Bradley DG (2001) Sequence vari-ation in the mitochondrial DNA control region of wild African cheetahs (Acinonyx jubatus). Heredity 86: 355–362. PMID:11488972
23. Charruau P, Fernandes C, Orozco-Terwengel P, Peters J, Hunter L, Ziaie H, et al. (2011) Phylogeogra-phy, genetic structure and population divergence time of cheetahs in Africa and Asia: evidence for long-term geographic isolates. Molecular Ecology 15: 367–371.
24. Pinho C, Harris DJ, Ferrand N (2007) Comparing patterns of nuclear and mitochondrial divergence in a cryptic species complex: the case of Iberian and North African wall lizards (Podarcis, Lacertidae). Bio-logical Journal of the Linnean Society 91: 121–133.
25. Rato C, Carranza S, Perera a, Carretero M a, Harris DJ (2010) Conflicting patterns of nucleotide diver-sity between mtDNA and nDNA in the Moorish gecko,Tarentola mauritanica. Molecular phylogenetics and evolution 56: 962–971. doi:10.1016/j.ympev.2010.04.033PMID:20434571
26. Sota T, Vogler AP (2001) Incongruence of mitochondrial and nuclear gene trees in the Carabid beetles Ohomopterus. Systematic biology 50: 39–59. PMID:12116593
27. Zink RM, Barrowclough GF (2008) Mitochondrial DNA under siege in avian phylogeography. Molecular Ecology 17: 2107–2121. doi:10.1111/j.1365-294X.2008.03737.xPMID:18397219
28. Roca AL, Georgiadis N, O’Brien SJ (2007) Cyto-nuclear genomic dissociation and the African elephant species question. Quaternary international 169–170: 4–16. PMID:18591997
29. DeBruyne R (2005) A case study of apparent conflict between molecular phylogenies: the interrelation-ships of African elephants. Cladistics 21: 31–50.
30. Pusey AE, Packer C, Erhoff-Mulder MB (1987) The Evolution of Sex-biased Dispersal in Lions. Behav-iour 101: 275–310.
31. Spong G, Stone J, Creel S, Björklund M (2002) Genetic structure of lions (Panthera leoL.) in the Selous Game Reserve: implications for the evolution of sociality. Journal of Evolutionary Biology 15: 945–953.
32. Driscoll CA, Menotti-Raymond M, Nelson G, Goldstein D, O’Brien SJ (2002) Genomic microsatellites as evolutionary chronometers: a test in wild cats. Genome research 12: 414–423. PMID:11875029 33. Pritchard JK, Stephens M, Donnelly P (2000) Inference of population structure using multilocus
geno-type data. Genetics 155: 945–959. PMID:10835412
34. Earl DA, VonHoldt BM (2012) STRUCTURE HARVESTER: a website and program for visualizing STRUCTURE output and implementing the Evanno method. Conservation Genetics Resources 4: 359–361.
35. Evanno G, Regnaut S, Goudet J (2005) Detecting the number of clusters of individuals using the soft-ware STRUCTURE: a simulation study. Molecular Ecology 14: 2611–2620. PMID:15969739
36. Jakobsson M, Rosenberg NA (2007) CLUMPP: a cluster matching and permutation program for dealing with label switching and multimodality in analysis of population structure. Bioinformatics (Oxford, England) 23: 1801–1806.
37. Peakall R, Smouse PE (2012) GenAlEx 6.5: genetic analysis in Excel. Population genetic software for teaching and research—an update. Bioinformatics (Oxford, England) 28: 2537–2539.
38. Takezaki N, Nei M, Tamura K (2010) POPTREE2: Software for constructing population trees from allele frequency data and computing other population statistics with Windows interface. Molecular biology and evolution 27: 747–752. doi:10.1093/molbev/msp312PMID:20022889
39. Excoffier L, Laval G, Schneider S (2005) Arlequin (version 3.0): an integrated software package for pop-ulation genetics data analysis. Evolutionary bioinformatics online 1: 47–50.
40. Kalinowski ST (2005) Hp-Rare 1.0: a Computer Program for Performing Rarefaction on Measures of Allelic Richness. Molecular Ecology Notes 5: 187–189.
41. Nei M (1978) Estimation of average heterozygosity and genetic distance from a small number of individ-uals. Genetics 89: 583–590. PMID:17248844
43. Cornuet JM, Luikart G (1996) Description and power analysis of two tests for detecting recent popula-tion bottlenecks from allele frequency data. Genetics 144: 2001–2014. PMID:8978083
44. Piry S, Luikart G, Cornuet JM (1999) BOTTLENECK: A computer program for detecting recent reduc-tions in the effective population size using allele frequency data. Journal of Heredity 90: 502–503.
45. Kalinowski ST (2010) The computer program STRUCTURE does not reliably identify the main genetic clusters within species: simulations and implications for human population structure. Heredity 106: 625–632. doi:10.1038/hdy.2010.95PMID:20683484
46. Tefera M (2003) Phenotypic and reproductive characteristics of lions (Panthera leo) at Addis Ababa Zoo. Biodiversity and Conservation 12: 1629–1639.
47. Pitra C, Hansen AJ, Lieckefeldt D, Arctander P (2002) An exceptional case of historical outbreeding in African sable antelope populations. Molecular Ecology 11: 1197–1208. PMID:12074727
48. Burger J, Rosendahl W, Loreille O, Hemmer H, Eriksson T, Götherström A, et al. (2004) Molecular phy-logeny of the extinct cave lionPanthera leo spelaea. Molecular phylogenetics and evolution 30: 841– 849. PMID:15012963
49. Miller SM, Bissett C, Burger A, Courtenay B, Dickerson T, Druce DJ, et al. (2013) Management of rein-troduced lions in small, fenced reserves in South Africa: an assessment and guidelines. South African Journal of Wildlife Research 43: 138–154.
50. Kalinowski ST (2002) Evolutionary and statistical properties of three genetic distances. Molecular Ecol-ogy 11: 1263–1273. PMID:12144649
51. Takezaki N, Nei M (1996) Genetic Distances and Reconstruction of Phylogenetics Trees from Microsat-ellite DNA. Genetics 144: 389–399. PMID:8878702
52. Takezaki N, Nei M (2008) Empirical tests of the reliability of phylogenetic trees constructed with micro-satellite DNA. Genetics 178: 385–392. doi:10.1534/genetics.107.081505PMID:18202381
53. Haas SK, Hayssen V, Krausman PR (2005) Mammalian species—Panthera leo. Mammalian Species: 1–11.
54. Trinkel M, Funston P, Hofmeyr M, Hofmeyr D, Dell S, Packer C, et al. (2010) Inbreeding and density-dependent population growth in a small, isolated lion population. Animal Conservation 13: 374–382.
55. Iongh H de, Tumenta P, Croes B, Funston P, Bauer H, Udo de Haes H (2009) Threat of a lion popula-tion extincpopula-tion in Waza Napopula-tional Park, North Cameroon. CATnews 50: 26–27.