Role of the BAHD1 Chromatin-Repressive
Complex in Placental Development and
Regulation of Steroid Metabolism
Goran Lakisic1, Alice Lebreton2,3,4☯¤, Renaud Pourpre1☯, Olivia Wendling5, Emanuele Libertini6, Elizabeth J. Radford7,8, Morwenna Le Guillou9,
Marie-France Champy5, Marie Wattenhofer-Donzé5, Guillaume Soubigou6, Slimane Ait-Si-Ali10, Jean Feunteun9, Tania Sorg5, Jean-Yves Coppée6, Anne C. Ferguson-Smith7,
Pascale Cossart2,3,4, Hélène Bierne1*
1Micalis Institute, INRA, AgroParisTech, Université Paris-Saclay, Équipe Microbiologie Cellulaire et Epigénétique, Jouy-en-Josas, France,2Unité des Interactions Bactéries-Cellules, Institut Pasteur, Paris, France,3INSERM U604, Paris, France,4INRA USC2020, Paris, France,5Institut Clinique de la Souris-ICS-MCI, PHENOMIN, CNRS UMR7104, INSERM U964, Université de Strasbourg, Illkirch, France, 6Plateforme Transcriptome et Epigénome, Département Génomes et Génétique, Institut Pasteur, Paris, France,7Department of Genetics, University of Cambridge, Cambridge, United Kingdom,8Cambridge University Hospitals, NHS Foundation Trust, Cambridge, United Kingdom,9CNRS UMR8200 Stabilité génétique et oncogenèse, Université Paris-Saclay, Villejuif, France,10CNRS UMR7216, Université Paris
Diderot-Paris 7, Paris, France
☯These authors contributed equally to this work.
¤ Current address: École Normale Supérieure, PSL Research University, CNRS, Inserm, Institut de Biologie
de l’École Normale Supérieure (IBENS), Équipe Infection et Devenir de l’ARN, Paris, France
Abstract
BAHD1 is a vertebrate protein that promotes heterochromatin formation and gene repres-sion in association with several epigenetic regulators. However, its physiological roles remain unknown. Here, we demonstrate that ablation of theBahd1gene results in hypocho-lesterolemia, hypoglycemia and decreased body fat in mice. It also causes placental growth restriction with a drop of trophoblast glycogen cells, a reduction of fetal weight and a high neonatal mortality rate. By intersecting transcriptome data from murineBahd1knockout (KO) placentas at stages E16.5 and E18.5 of gestation,Bahd1-KO embryonic fibroblasts, and human cells stably expressingBAHD1, we also show that changes in BAHD1 levels alter expression of steroid/lipid metabolism genes. Biochemical analysis of the BAHD1-associated multiprotein complex identifies MIER proteins as novel partners of BAHD1 and suggests that BAHD1-MIER interaction forms a hub for histone deacetylases and methyl-transferases, chromatin readers and transcription factors. We further show that overexpres-sion of BAHD1 leads to an increase of MIER1 enrichment on the inactive X chromosome (Xi). In addition, BAHD1 and MIER1/3 repress expression of the steroid hormone receptor genesESR1andPGR, both playing important roles in placental development and energy metabolism. Moreover, modulation ofBAHD1expression in HEK293 cells triggers epige-netic changes at theESR1locus. Together, these results identify BAHD1 as a core OPEN ACCESS
Citation:Lakisic G, Lebreton A, Pourpre R, Wendling O, Libertini E, Radford EJ, et al. (2016) Role of the BAHD1 Chromatin-Repressive Complex in Placental Development and Regulation of Steroid Metabolism. PLoS Genet 12(3): e1005898. doi:10.1371/journal. pgen.1005898
Editor:Paul Wade, NIEHS, UNITED STATES
Received:September 11, 2015
Accepted:February 4, 2016
Published:March 3, 2016
Copyright:© 2016 Lakisic et al. This is an open access article distributed under the terms of the
Creative Commons Attribution License, which permits unrestricted use, distribution, and reproduction in any medium, provided the original author and source are credited.
Data Availability Statement:All datasets are available from the Gene Expression Omnibus (GEO) database (accession number: GSE51868; GSE53443; GSE53442; GSE73816).
component of a chromatin-repressive complex regulating placental morphogenesis and body fat storage and suggest that its dysfunction may contribute to several human diseases.
Author Summary
The importance of epigenetics in regulation and dysfunction of metabolic pathways is increasingly recognized but the underlying mechanisms and molecular actors involved remain incompletely characterized. Here, we provide evidence that the heterochromatini-zation factor BAHD1 cooperates with MIER proteins to assemble chromatin-repressive complexes that control a network of metabolic genes involved in placental and fetal growth and in cholesterol homeostasis.
Introduction
Chromatin-based transcriptional repression is mediated by macromolecular complexes con-taining proteins involved in chromatin writing, reading, erasing and remodeling activities. The combinatorial assembly of subunits with transcription factors affects cell-specific gene expres-sion in response to developmental, physiological or environmental stimuli. Chromatin-repres-sive complexes control key pathways during embryonic development and adult life; as a consequence, deregulation or abnormalities in their components can lead to a wide range of pathological processes [1,2]. The importance of chromatin-modifiers in development, cell dif-ferentiation and disease is well illustrated for three complexes containing the histone deacety-lases HDAC1 and HDAC2: NuRD [3,4], Sin3A [5] and CoREST [6,7] (For reviews, see [2,8–
10]). By a proteomic approach, we found that the Bromo-Adjacent-Homology domain-con-taining 1 (BAHD1) protein co-purifies with HDAC1/2, together with heterochromatin pro-teins HP1 and KAP1 (or TRIM28) in human embryonic kidney (HEK) 293 cells, suggesting that BAHD1 is a core component of a novel HDAC1/2-associated complex [11]. BAHD1 also interacts with the Methyl-CpG-binding protein MBD1 and the H3K9 methyltransferases (KMT) SETDB1 [12] and SUV39H1 [13] and acts as a repressor, pointing to a role of BAHD1 in heterochromatin-mediated transcriptional repression [12]. In agreement with this, overex-pression of BAHD1 in human cells induces large-scale chromatin condensation [12] and changes in the DNA methylation landscape [14].
BAHD1-associated heterochromatic domains lack acetyl histone H4 and partially overlap with HP1α, a marker of constitutive heterochromatin, and/or with H3 trimethylated at lysine 27 (H3K27me3), a marker of facultative heterochromatin [12]. Furthermore, when overex-pressed in human female cells, BAHD1 is enriched at the inactive X chromosome (Xi), a para-digm of facultative heterochromatin [12]. A study in mouse embryonic stem cells (mESCs) recently reported that BAHD1, HDAC1 and HDAC2 are pulled-down by CDYL, a transcrip-tional co-repressor that may play a role in the maintenance of the Xi [15]. Taken together, these data suggest that BAHD1 is a component of HDAC1/2-associated complexes involved in a variety of epigenetic mechanisms.
A single gene encodes BAHD1 in vertebrates and no ortholog is found in invertebrates or plants, suggesting that BAHD1 has vertebrate-specific functions. However, the low expression of BAHD1 in cell lines has hampered its functional characterization and, so far, the BAHD1 regulatory gene network is poorly characterized. We identified the insulin-like growth factor II
BacCellEpi, to PC) and an award from the iXcore Fundation for Research (to HB). The funders had no role in study design, data collection and analysis, decision to publish, or preparation of the manuscript.
(IGF2)transcript and its antisense transcript (IGF2AS)as BAHD1 targets in HEK293 embryonic cells [12]. We also demonstrated that infection by a bacterial pathogen triggers BAHD1-mediated repression of Interferon-Stimulated Genes (ISGs) in epithelial cells [11]. However, apart from bacterial infection, signals that control the expression and/or activity of BAHD1 are unknown.
The aim of the present study was to determine the physiological functions of BAHD1. We show that disruption of theBahd1gene in the mouse leads to a placental growth defect associ-ated with low birth weight and neonatal death, hypocholesterolemia and decreased body fat in surviving adults. Proteomic studies of BAHD1-associated proteins identify MIER proteins as novel BAHD1 partners. Our extensive characterization of the transcriptome strongly suggests that BAHD1-MIER complexes repress genes involved in the control of steroid/lipid metabo-lism both in mouse and human cells.
Results
Bahd1-deficient mice display hyporcholesterolemia, hypoglycemia and
a lower body weight
We searched for tissue-specific expression of theBAHD1gene by a survey of referenced tran-scriptome datasets (S1 Table) and found thatBAHD1mRNA levels are low and do not vary much between tissues, when compared to a set of housekeeping or tissue-specific genes. This observation is consistent with the lack of detection of the endogenous BAHD1 protein in mam-malian cultured cells and suggests thatBAHD1basal levels are low. In order to identify func-tions of BAHD1 in biological processes, we studied the physiological consequences ofBAHD1
inactivation by performing a large-scale phenotyping ofBahd1haplo-deficient (Bahd1+/-) mice [11]. The analysis was carried out on 18 heterozygous (HET) and 16 wild type (WT) littermates (results are detailed inS1 TextandS2 Table). Mice were first fed a standard chow diet (CD) for 14 weeks and then a high fat/high carbohydrate diet (HFHCD) for 16 weeks. HETBahd1
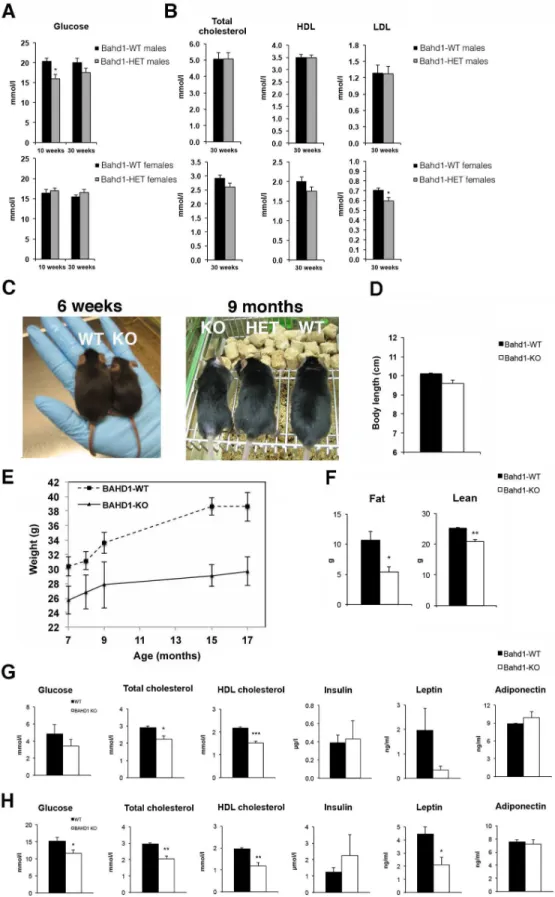
+/-mice did not show any morphological, sensory or cardiac abnormality and no change in bone density, body weight and fat, when compared to WT littermates, and the blood chemistry and hematology parameters were within the normal range. However, some slight and gender-spe-cific modifications of glucose or cholesterol parameters were observed in HET mutants. At the age of 10 weeks, HET male mice displayed a significant hypoglycemia when compared to WT mice (Fig 1A). After the switch to HFHCD, blood levels of glucose remained lower in 30-week-old HET than in WT male mice, although difference did not then reach statistical significance (S2A Table). In contrast to males, glycemia was not affected in female HET mice whatever the diet (Fig 1A) but female HET fed with HFHCD displayed a slight decrease in blood levels of total cholesterol, high-density lipoprotein (HDL) and low-density lipoprotein (LDL) compared to WT littermates (Fig 1B). However, values were statistically significant only for LDL concen-trations (S2B Table).
We next crossedBahd1-heterozygous mice to evaluate potential metabolism defects in the
Bahd1-nullcontext. MostBahd1-/-(KO) pups died within the first days of life, indicating that theBahd1-null mutation leads to perinatal death. Only 5Bahd1-/-out of 200 genotyped pups (2.5%)survived birth. At six weeks, these 5 survivors, all males, displayed reduced sizes and weights compared to control littermates (Fig 1C). After several months, they reached the length ofBahd1+/+littermates (Fig 1C and 1D), but kept a significant lower body weight (Fig 1E), characterized by reduced fat and lean mass (Fig 1F). Quantification of blood parameters highlighted lower levels of total cholesterol, HDL and LDL in plasma ofBahd1-/-mice than in
Bahd1+/+littermates at 3–5 months (S1A Fig), 7 and 18 months of age (Fig 1G and 1H). Glu-cose and leptin levels were also significantly lower in 18 month-oldBahd1-/-mice than in
Fig 1.Bahd1-knockout mice display decreased weight and fat mass and lower cholesterol, glucose
and leptin levels. A-B.Plasma levels of glucose (A) or of total cholesterol, HDL and LDL (B) inBahd1
different between KO and WT mice (i.e. insulin, adiponectin,Fig 1G and 1H; triglycerides, free fatty acids, glycerol, aspartate and alanine amino transferases, urea, creatinine, albumin, gluca-gon, GIP,S1B Fig). Together, these results demonstrate a biological function of BAHD1 in con-trolling lipid and carbohydrate metabolism.
BAHD1 is required for mouse placental and fetal growth
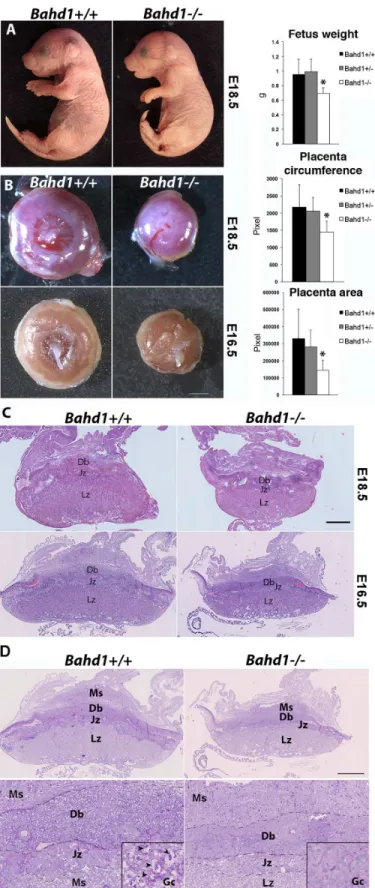
The high neonatal mortality rate of BAHD1-KO pups suggested that BAHD1 could have impor-tant functions during fetal life. In order to address this question, we examined embryos just before birth at the embryonic day 18.5 (E18.5).Bahd1-/-fetuses were present at Mendelian fre-quency, had normal morphology, were alive and exhibited the breathing reflex. However, their weight was decreased by 30% (Fig 2A) when compared to WT or HET fetuses. In addition,
Bahd1-/-embryos exhibited a smaller placenta, with a reduction of 30% in the circumference and 55% of the area (Fig 2B), when compared to placentas of WT or HET embryos. At an earlier stage (E16.5),Bahd1-/-placentas were also smaller thanBahd1+/+ones (Fig 2B). Histology of pla-centa sections with hematoxylin and eosin (HE) staining showed thatBahd1-/-placentas com-prised the two fetal compartments (labyrinthine zone (Lz) and junctional zone (Jz)) and the maternal compartment (decidua basalis (Db)). However, the Lz surface area was significantly reduced and the Jz and Db were thinner inBahd1-/-placentas than in control littermates (Fig 2C). The junctional zone plays an important role in hormone synthesis, while the labyrinthine zone is critical for materno-foetal nutrient exchange [16,17]. The Jz comprises fetal spongiotro-phoblast cells and trospongiotro-phoblast glycogen cells (GCs). The exact origin and function of GCs is unknown, but they are believed to provide an important glucose supply for fetoplacental develop-ment. Evidence indicates that they differentiate early (E.6.5) in the ectoplacental cone at the ori-gin of the Jz and migrate into the maternal decidua at about E12.5 [18,19]. We used periodic acid-Shiff (PAS) staining to examine if GCs were altered by theBahd1null mutation. PAS stain-ing confirmed the reduced thickness of Jz and Db inBahd1-/-relative toBahd1+/+placentas at E16.5 and showed a severe reduction in the number of PAS-positive GCs both in the Jz and the Db (Fig 1DandS2A Fig). In contrast, histology of the fetal liver at E16.5 did not reveal any noticeable difference betweenBahd1-KO and WT embryos (S2B Fig). Together, these results indicate that BAHD1 is required for a normal placental development and intra-uterine fetal growth. BAHD1 mutants may die after birth from metabolic defects, or secondary to altered pla-cental exchange prenatally, impairing the development of energy stores.
Expression of a set of steroid metabolism genes and imprinted genes is
altered in
Bahd1
-/-placentas
To examine the consequence of BAHD1 deficiency on the placental transcriptome, we isolated RNA fromBahd1-/-placentas at stages E16.5 (n = 6 per genotype) and at stage E18.5 (n = 3 per genotype) to perform a comparative microarray analysis using Affymetrix mouse arrays. The
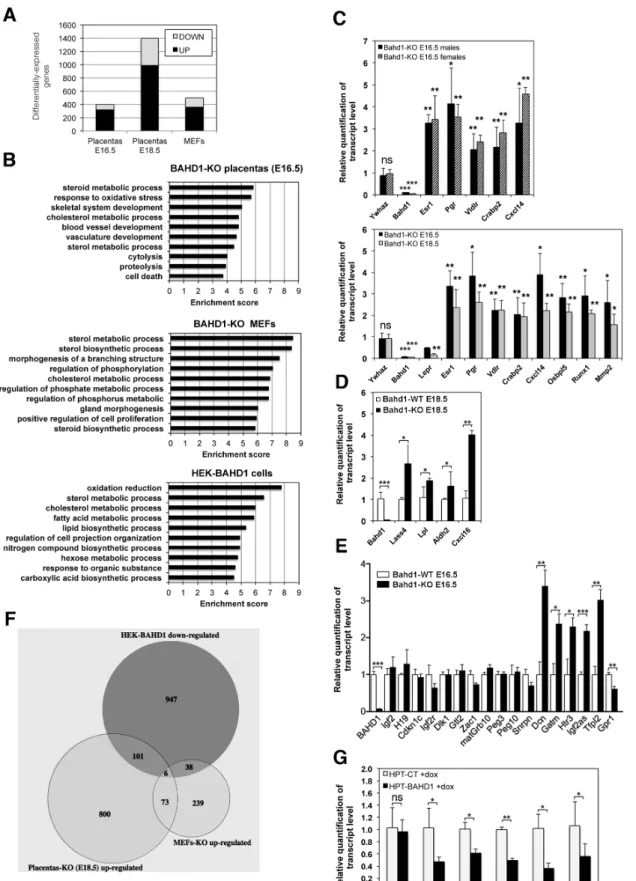
Bahd1-null mutation altered expression of 397 and 1396 genes (FDR-BH<0.05) at E16.5 and at E18.5, respectively, with a much higher proportion of up-regulated genes (70–80%) than down-30-week-old fed 14 weeks CD followed by 16 weeks HFHC (n = 8-10/group.C.Representative macroscopic images ofBahd1-WT and -knockout (KO) mice at 6 weeks and 9 months.D.Body length at 9 months.E. Body weight curve ofBahd1-WT and KO mice between the ages of 7 to 17 months (n = 5/group).F. Quantification of body fat mass and lean by QNMR analysis on 15 month-old animals (n = 4/group).G. Plasma levels of glucose, total cholesterol, HDL, insulin, leptin and adiponectin in 16-hours fasted 7-month-old WT and KO mice fed a normal diet (n = 4/group).H.Plasma levels of the same parameters in the same animals one year later (18 month-old). All data are expressed as the mean±SE (*P<0.05;**P<0.01; ***P<0.005).
Fig 2. BAHD1 plays a role in fetal and placental growth. A.Representative images ofBahd1+/+and
regulated genes (20–30%), consistent with a role for BAHD1 in transcriptional repression (Fig 3A). 65% of genes deregulated in E16.5Bahd1-KO placentas remained similarly deregulated at the E18.5 stage (214 up-regulated and 46 down-regulated genes,S3 Table). We used the DAVID software to classify genes based on Gene Ontology (GO) [20] and highlight the most significant biological processes that could be altered by BAHD1 deficiency. At the E16.5 stage, the most sig-nificant gene cluster (Pvalue<5.10−4) was a group of 16 genes involved in steroid metabolic processes (Fig 3BandS4A Table). Notably, 11 of these genes remained deregulated inBahd1
-/-E18.5 placentas: 7 genes up-regulated (Apoc3,Atp8b1,Cyp11A1,Insig2,Osbpl5,Pbx1,VldlR) and 4 genes down-regulated (Fabp6,Hsd17b2,Hsd17b7,LepR) (S3 Table). In addition, two steroid hormone receptor genes, the estrogen receptor alpha geneEsr1and progesterone receptor gene
Pgr, were up-regulated inBahd1-/-placentas, both in males and females embryos and at both ges-tational stages, as confirmed by Real time quantitative PCR (RT-qPCR) analysis (Fig 3C).
Groups of genes involved in the response to oxidative stress, skeletal system development and blood vessel development were also over-represented inBahd1-KO placentas (S4 Table). Several of these genes are known to be involved in placental morphogenesis, such asGja1/Cx43,Cxcl14,
Mmp2,Mmp14,Runx1(up-regulated) andAda,Adm,Gcm1,Gjb5(down-regulated). Altered expression of these genes inBahd1-KO mice is consistent with an abnormal placentation. RT-qPCR analysis of a set of transcripts confirmed the transcriptome data (Fig 3C and 3D).
Several genes previously shown to be imprinted in the mouse during development or in the adult [21] were also up-regulated inBahd1-KO placentas. Imprinted genes, expressed from only one of the parental alleles, play important functions during mammalian development, particu-larly in the placenta [22]. The parental conflict hypothesis of imprinting proposes that mater-nally−or paternally−expressed imprinted genes restrict or increase the energy expenditure,
respectively [23]. We have previously shown that in human embryonic cells BAHD1 repressed
IGF2andIGF2AS[12], which are imprinted in many tissues. BAHD1 deficiency did not affect
Igf2expression in murine placenta, but, the paternally−expressedIgf2asand ten maternally
−expressed putative imprinted (Ampd3,Ano1,Dcn,Gatm,Htra3,Osbpl5,Qpct,Tfpi2,Tnfrsf23
andWt1) were up-regulated inBahd1-deficient E16.5 placentas, while one,Gpr1, was down-reg-ulated. RT-qPCR assays confirmed these results using several other imprinted genes as negative controls (Fig 3E). Most of these genes are imprinted only in the placenta. However, determining placental specific imprinting can be confounded by maternally derived placental tissue and there is controversy over the imprinted status of some of these genes [24]. Strikingly,Htra3,Tfpi2,
Ampd3,Gatm,Osbpl5,QpctandWnt1were also consistently up-regulated inBahd1-deficient E18.5 placentas (S3 Table) and may be functionally implicated in the impaired placental growth.
Steroid metabolism genes are also altered in
Bahd1
-/-mouse MEFs and
BAHD1-overexpressing human cells
Bahd1-KO fetuses exhibited a lower weight thanBahd1-WT. This phenotype could result from placental dysfunction but also from deregulation of BAHD1 target genes in intra-embryonic tissues. To address this point, we analyzed transcriptomes of mouse embryonic fibroblasts derived fromBahd1-WT and -KO embryos at stage E13.5 (n = 3 per genotype). The results of and circumferences of E18.5 placentas are shown on the right (Bahd1+/+, n = 4;Bahd1+/-, n = 11;Bahd1-/-; n = 7). Data are expressed as mean±SD (*P<0.05).C.Histological analysis ofBahd1−/−andBahd1+/+ placentas at E18.5 and E16.5. Placentas were collected, fixed and subjected to hematoxylin and eosin (HE) staining. A representative image is shown. Scale bar: 1 mm.D.Periodic acid-Shiff (PAS) staining of the same E16.5 placentas as in C, at three different scales. Scale bar, 1 mm (top), 250μm (bottom), 60μm (squared region). High magnification of vacuolated glycogen cells GCs (arrowheads) in the junctional zone is shown in squared regions. Ms, mesometrial triangle; Db: decidua basalis; Jz junctional zone; Lz, labyrinthine zone.
Fig 3. Loss or overexpression of BAHD1 alters expression of genes involved in steroid metabolism. A.Number of genes up- and down-regulated in
this analysis revealed 353 up-regulated and 139 down-regulated genes (FDR-BH<0.05) in
Bahd1-KO MEFs, when compared toBahd1-WT MEFs (Fig 3A). We focused on up-regulated genes, as these likely contain those genes directly repressed by BAHD1. Strikingly, the most sig-nificant biological process associated with up-regulated genes inBahd1-KO MEFs was sterol metabolism (Fig 3B). However, genes associated with this process were different to those affected inBahd1-KO placentas (S4C Table), suggesting that BAHD1-dependent gene net-works are tissue-specific even though they may have a common function.
We next assessed whether BAHD1 has a similar role in repressing sterol metabolism genes in human cells, by comparing transcriptomes of HEK293 cells stably overexpressingBAHD1
(HEK-BAHD1) to that of parental isogenic cells (HEK-CT), in which the BAHD1 protein is undetectable [14]. This analysis identified 1148 transcripts (FDR-BH<0.05) that were down-reg-ulated in cells constitutively expressing the BAHD1 repressor. Once again, GO term classification analysis of these transcripts highlighted sterol metabolism as the most significant biological pro-cess (Fig 3BandS4D Table). Genes involved in lipid and hexose metabolism also grouped as sig-nificant clusters. Although biological functions of BAHD1-associated chromatin repressive complexes are likely to be cell type- and species-specific, and a transcriptome will identify direct and indirect gene expression changes, BAHD1bona fidetarget genes may be identified by com-paring different biological systems (Fig 3F). Overlapping HEK-BAHD1 andBahd1-KO E18.5 pla-centa transcriptomes identified 107 potential BAHD1 targets (S5A TableandFig 3F), the most significant gene groups where those involved in the regulation of hormone levels (ALDH1A2,
BACE2,CAMK2G,CRABP2,LY6E,SCARB1,SLC16A2) and lipid biosynthetic processes
(ALDH1A2,CD81,EBP,ELOVL7,LASS4,LPL,LPCAT2,LTA4H,SCARB1)(S4E Table). Overlap-ping HEK-BAHD1 andBahd1-KO MEFs transcriptomes identified 44 potential BAHD1 target genes (S5B TableandFig 3F), the most statistically significant group in term of biological pro-cesses including genes involved in sterol/steroid metabolism (DHCR24,HMGCS1,LDLR,
NSDHL,SC4MOL,SREBF2;S4F Table). Only six genes were altered consistently between all the three transcriptome datasets (S5C Table). Using a tetracycline-inducibleBAHD1HEK293 line (HPT-BAHD1 cells, [11]), we confirmed that induction ofBAHD1expression (S3 Fig) is suffi-cient to repress five transcripts involved in lipid/steroid metabolism (HMGCS1,LDLR,NSDHL,
CRABP2andLASS4)(Fig 3G). Of note, no imprinted gene was found in this analysis, indicating that the effect of theBahd1-null mutation on this gene category is specific to the placenta. Alto-gether, these findings show that changes in BAHD1 levels alter expression of gene networks con-trolling steroid/lipid metabolism and hormone signaling pathways, which are key players in the development of the placenta and in control of energy in the body.
BAHD1 co-purifies with MIER proteins, HDAC1/2 and several chromatin
regulators
Efforts to perform chromatin immunoprecipitation (ChIP) of BAHD1 in murine or human cells using custom [12] or commercial BAHD1 antibodies repeatedly failed, preventing evaluating the significance of gene ontology terms for differentially expressed RNAs. The top 10 annotation clusters are listed as derived from the DAVID bioinformatics tool.C.Transcripts levels inBahd1−/−placentas relative toBahd1+/+littermates at E16.5 (n = 6, with 3 males and 3 females for each genotype) or E18.5 (n = 3 for each genotype) were quantified by RT-qPCR. Values are normalized byGapdh.Ywhazis used as negative control. The differential
expression inBahd1−/−placentas is shown (relative to that inBahd1+/+= 1).D.Relative transcripts levels for several genes inBahd1−/−relative toBahd1+/+ placentas at E18.5 (n = 3 for each genotype).E.Relative transcripts levels for imprinted genes inBahd1−/−relative toBahd1+/+placentas at E16.5 (n = 4 for each genotype). Values are normalized toHprt,ActB and Tuba1a.F. Venn diagram depicting shared genes that are up-regulated inBahd1-KO E18.5 placentas and MEFs and down-regulated in human HEK-BAHD1 cells.G. Relative transcripts levels for lipid metabolism genes in HPT-BAHD1 cells relative to control HPT-CT.BAHD1expression was induced with tetracycline for 30h. Data are expressed as mean±SD (ns, non-significant;*P<0.05;
**P<0.005;***P<0.001).
straightforward identification of genomic loci targeted by BAHD1 (BAHD1 ChIP is further discussed inS1 Text). To get further clues on BAHD1 function, we searched for novel BAH-D1-associated proteins in cells stably expressing His6-Protein-C-tagged-BAHD1
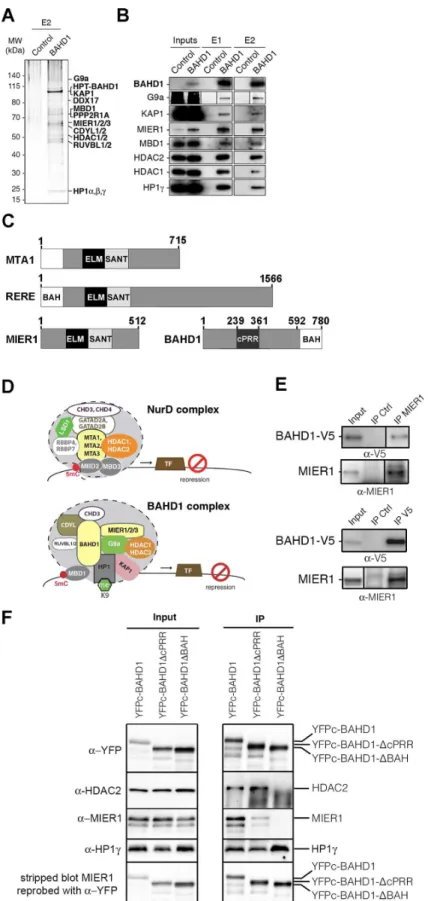
(HPT-BAHD1) by using tandem affinity chromatography purification (TAP) and Mass spec-trometry (MS), as described previously [11]. We found that ~10 proteins reproducibly co-puri-fied with BAHD1 after two successive purification steps (Fig 4AandS6 Table): the mesoderm induction early response (MIER) proteins (MIER1, MIER2 and MIER3), HDAC1/2, HP1γ/β, KAP1, CDYL1, KAP1, PPP2R1A, RUVBL2 and DDX17. Other polypeptides were consistently detected in the first-step purification (HP1α, RUVBL1, CDYL2, DDX21, G9a, CHD3,S6 Table). Peptides matching with MBD1 were found in one TAP, in agreement with yeast two-hybrid, co-immunoprecipitation and GST pulldown assays that previously showed that BAHD1 interacts with MBD1 and HP1 [12]. Western blot analysis confirmed that BAHD1 co-purifies with MBD1 and HP1γtogether with MIER1, HDAC1, HDAC2, KAP1 and the H3K9 KMT G9a (Fig 4BandS4 Fig). These data suggest that BAHD1 and MIER proteins are subunits of a macromolecular complex containing chromatin writers (e.g. G9a), readers (e.g. HP1α/β/γ, CDYL1/2, MBD1), erasers (e.g. HDAC1/2) and remodelers (e.g. CHD3, RUVBL1/2).
We noticed that BAHD1 and MIER1 displayed conserved domains found in scaffolding proteins of other HDAC1/2 complexes: the metastasis-associated protein (MTA) subunits of NuRD [8,25] and RERE/atrophin-2, a transcriptional repressor belonging to a poorly charac-terized HDAC1/2 complex [26–28] (Fig 4C). BAHD1, MTA and RERE share a Bromo-Adja-cent Homology (BAH) domain, which is known to promote protein-protein interactions and binding to nucleosomes [25,29,30], while MIER1, MTA and RERE proteins contain juxta-posed ELM2 and SANT domains that recruit HDACs [25]. Thus, BAHD1 and MIER1 could cooperate to fulfill a function similar to that of MTA and RERE in other HDAC1/2 complexes (Fig 4D). To investigate this hypothesis, we performed a series of co-immunoprecipitation experiments on HEK293-FT cells transiently expressing tagged-versions of BAHD1 from plas-mid vectors, since endogenous BAHD1 is undetectable in HEK293 cells. Reciprocal co-IP assays with nuclear extracts confirmed association of endogenous MIER1 with V5-tagged BAHD1 in HEK293-FT cells and their co-immunoprecipitation with HDAC2 and HP1γ(Fig 4EandS5 Fig). Likewise, BAHD1 tagged with the fluorescent protein citrine (YFPc-BAHD1) pulled-down HDAC2, MIER1 and HP1γ(Fig 4F, lane 1).
BAHD1 harbors a N-terminal proline-rich region with the highest density of prolines found between residues 239 to 361, a region termed the cPRR [31], and a C-terminal BAH domain that interacts with the N-terminal tail of histone H3 [12] (Fig 4C). To assess the requirement of specific protein domains in BAHD1 for productive interaction with MIER and HDACs, we expressed truncated forms of YFPc-BAHD1 in HEK293-FT cells. As shown inFig 4FandS5E Fig, the deletion mutant YFPc-BAHD1-ΔcPRR lacking residues 239 to 361 co-immunoprecipi-tated with HDAC2, MIER1 and HP1γ, as the full-length YFPc-BAHD1. In contrast, the dele-tion mutant YFPc-BAHD1-ΔBAH lacking residues 592 to 780 encompassing the BAH624-780
domain failed to pull-down HDAC2 and MIER1, while retaining the ability to bind HP1γ. We conclude that BAHD1 interaction with MIER1 and HDAC2 requires the integrity of the BAH domain of BAHD1.
chromatin-Fig 4. BAHD1 binds to MIER and HDACs. A-B.TAP-MS purification of the His6
-Protein-C-BAHD1-associated complex. Solubilized chromatin extracts (“Inputs”) from HPT-CT cells (“Control”) or
bound complex. This hypothesis is also supported by results from the Heard laboratory [15] showing that BAHD1, MIER1/2, HDAC1/2 and G9a co-immunoprecipitate with CDYL, a pro-tein recruited to Xi in mouse ES cells and also found in our TAP assays (S6 Table).
Relationship between BAHD1 and metabolism-associated transcription
factors
We propose that BAHD1 and MIER are co-repressors that, like MTA subunits of NurD com-plexes [9], exert their function through association with sequence-specific DNA binding transcrip-tion factors (TFs). With the hypothesis that such TFs should regulate the same gene networks as BAHD1, we used the Ingenuity Pathway Analysis Upstream Regulator software to predict TFs responsible for differential gene expression in BAHD1-deficient or -overexpressing cells. This analysis identified seven TFs that were consistently found as upstream regulators of a set of BAH-D1-associated genes in all transcriptome datasets: ESR1, ESR2, EPAS1 (HIF2α), PPARG, FOS, TP53 and SP1 (S7 Table), the latter being previously reported to associate with BAHD1 [12] and MIER1 [32]. It is striking that these TFs have relevance both in placental development and regula-tion of genes involved in lipid/steroid metabolism ([33–36] and other references inS1 Text).
Since ESR1 has been shown to bind MIER1 [37] and to cooperate with SP1 [38], we hypoth-esized that BAHD1-MIER could act as co-repressors for ESR1-mediated transcriptional regula-tion. Based on this assumption, BAHD1 should target theESR1gene itself, because ESR1 autoregulates its own expression [39]. Accordingly,ESR1was up-regulated inBahd1-KO pla-centas (Fig 3C), as well as in HEK293-FT cells depleted of BAHD1 with siRNA (Fig 6A). siRNA-mediated knockdown of individual MIER genes did not significantly change expression ofESR1in HEK293-FT cells, but combined knockdown of MIER1 and MIER3 (MIER2was undetectable) increasedESR1expression (Fig 6A). We also found that expression ofPGR
(encoding the progesterone receptor), which has an ESR1 binding site in its proximal region [40] significantly increased in BAHD1- and MIER1/3-knockdown cells (Fig 6A), whereas the androgen receptor transcript (AR) was unaffected. These results indicate that BAHD1 and MIER1/3 act as repressors for the steroid hormone receptor genesESR1andPGR.
BAHD1
knockdown or overexpression induce epigenetic changes at the
ESR1
locus
HumanESR1forms a large and complex genetic unit that spans approximately 300 kb of chro-mosome 6 (chr6), of which 140 kb containing 8 protein-coding exons [41]. It is transcribed from at least seven promoters into multiple transcripts that vary in their 5’-UTRs and whose expression is tissue-specific. To find out whether the BAHD1-associated complexes targets
ESR1, we analyzed the DNA captured with BAHD1 and its associated partners in the TAP assays by using real-time PCR with primers targeting the proximal region ofESR1at, or in the vicinity of ESR1-binding sites identified by ChIP-seq (Fig 6B, [40], ENCODE ChIP-seq data). (E2). Eluted fractions were separated by SDS-PAGE and analyzed by Mass Spectrometry.A. Silver staining of E2.B. Immunoblots of inputs E1 and E2, using antibodies against the specified proteins (for G9a, also see
S4 Fig).C.Schematic representation of MTA1, RERE, MIER1 and BAHD1. ELM2, SANT, BAH domains, cPRR region and amino-acid numbers are indicated.D.Schematic diagrams of NurD and BAHD1 co-repressor complexes. Different protein paralogs can be part of distinct complexes.E-F.Nuclear extracts from HEK293-FT cells expressing BAHD1-V5 or YFPc-BAHD1, YFPc-BAHD1-ΔcPRR, YFPc-BAHD1-ΔBAH
were used in immunoprecipitations (IP) assays with MIER1 or V5 antibodies or IgG control (E) or YFP antibodies. Vertical lines indicate cropping sites in original blots (seeS5 Fig). (F). Eluted fractions were separated by SDS-PAGE and analyzed by immunoblot with the indicated antibodies (α-). In (F), the MIER1 blot was stripped and reprobed with YFP antibodies (seeS5 Figfor a replicate experiment).
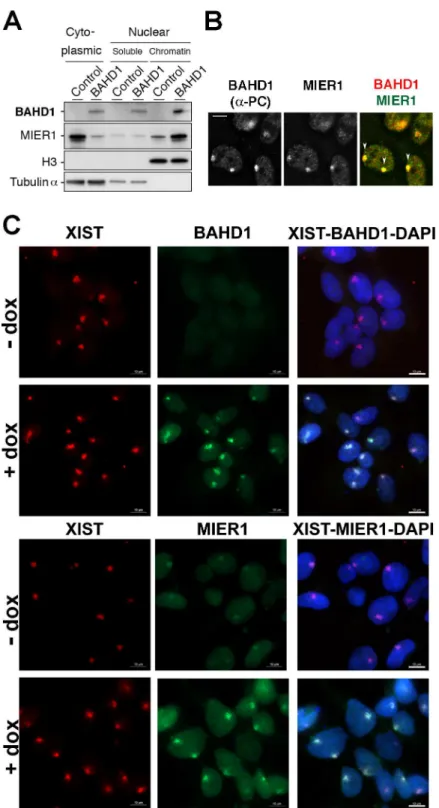
Fig 5. BAHD1 increases MIER1 nuclear translocation and recruitment to Xi. A.Cytoplasmic, nuclear soluble or chromatin extracts from HPT-control or HPT-BAHD1 cells induced 30 h with doxycyline were analyzed by immunoblotting with BAHD1, MIER1, histone H3 or Tubulin-αantibodies. H3 and Tubulin were used as loading controls.B.Colocalization of Protein-C tagged-BAHD1 and MIER1 on heterochromatic Xi (pointed with arrows on the merged image) was examined by IF with Protein-C and MIER1 antibodies. Bar, 5μm.C.Localization of BAHD1 and MIER1 in HPT-BAHD1 cells induced or not for 30 h with doxycycline. Enrichment on Xi was determined by IF with BAHD1 (top panels) or MIER1 (bottom panels) antibodies combined with Xist RNA FISH (red). DNA was stained with DAPI (blue in the merged image). Bars: 10μm.
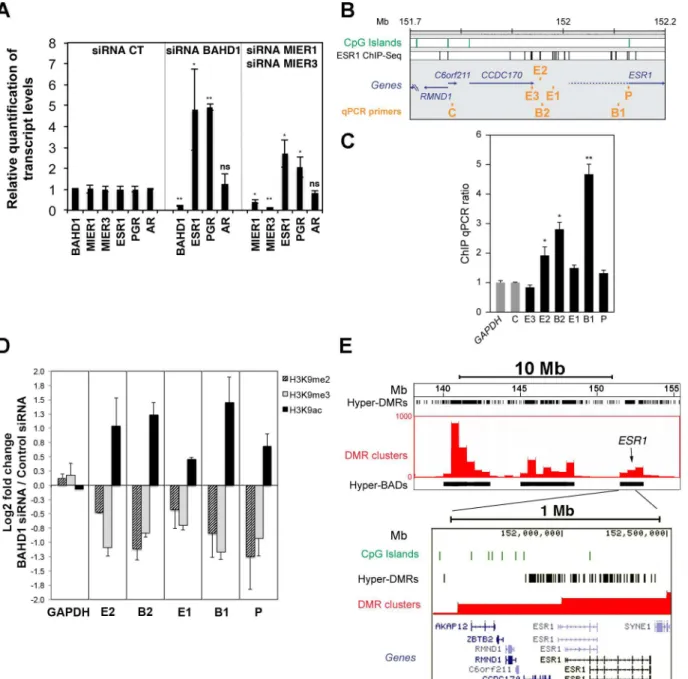
Fig 6. Depletion or overexpression of BAHD1 in HEK293 cells induce epigenetic changes atESR1. A. BAHD1 and MIER1/3 repressESR1andPGR.
HEK293-FT cells were transfected for 72 h with control or BAHD1, MIER1 or MIER3 siRNA. The levels ofBAHD1,MIER1,MIER3,ESR1,PGRandAR
transcripts were quantified by RT-qPCR. Data are expressed as mean±SD (*P<0.05;**P<0.005).B.Schematic representation of the proximal region of ESR1in chr6 of the human genome.C.BAHD1 binds the proximal region ofESR1. Amounts of DNA precipitated with BAHD1-TAP E1 eluates (seeFig 4) or
with control TAP or inputs were quantified using qPCR with the primer sets indicated in B. The amount of DNA purified with BAHD1 was normalized to the amount precipitated in the control TAP, and to theGAPDHlocus. Data are averages±SD of qPCR triplicates, and representative of 2 independent TAP
experiments.D.BAHD1 depletion alters the patterns of H3K9 acetylation and methylation at theESR1locus. HEK293-FT cells were transfected with control or BAHD1 siRNA and enrichment of H3K9ac, H3K9me2 and H3K9me3 relative to IgG control atESR1andGAPDHregions were estimated by ChIP-qPCR in
BAHD1-depleted and control cells. The y-axis shows the relative fold change of ChIP enrichment in cells with BAHD1 siRNA over cells with control siRNA in Log2 ratios. Data are averages±SD of two ChIP per antibody and representative of three biological replicates (seeS6 Fig).E.Overexpression of BAHD1
induces widespread DNA methylation at theESR1locus. Bisulfite-modified genomic DNA of control HEK-CT cells and isogenic HEK-BAHD1 cells overexpressing BAHD1 were sequenced and analyzed for their DNA methylation status, as described in Libertini et al. (2015) [14]. 300bp-regions with reproducible gain of methylation in HEK-BAHD1 compared to HEK-CT DNA in two BS-seq replicates (i.e hypermethylated BAHD1-DMRs) were binned into 0.5Mb windows highlighting clusters of hyper-DMRs (shown as red bars). Contiguous clusters define BAHD1-associated domains (“Hyper-BADs”, shown as black boxes). BAHD1-DMRs are represented by black vertical lines in the track“hyper-DMRs”. Three hypermethylated BADs of chr6 are shown on the top, with the position ofESR1indicated by an arrow. A 1 Mb region encompassing theEsr1locus is magnified below, showing the high density of hypermethylated
BAHD1-DMRs on the whole locus. CpG islands are indicated in green. The position of transcripts is shown below.
Regions inC6orf211(Fig 6B) andGAPDHloci were used as controls. Three sites upstream of
ESR1were identified as BAHD1 binding sites, when compared to input or control cell DNA (E2, B2, B1;Fig 6C). To determine whether any change in the chromatin structure occur as a consequence BAHD1 binding at these sites, we tested the effect of BAHD1 depletion on histone H3 modifications at lysine 9 (H3K9) by using a ChIP-qPCR assay. We observed a reproducible increase in histone H3K9 acetylation and decrease in H3K9 dimethylation (H3K9me2) and tri-methylation (H3K9me3) in cells with siRNA−induced knockdown ofBAHD1expression,
rela-tive to cells treated with control siRNA (Fig 6DandS6 Fig). This effect occurred at all sites of theESR1proximal region surveyed by PCR, but not at theGAPDHcontrol site. This result strongly suggests that a BAHD1-associated complex containing HDACs and KMTs contrib-utes to the epigenetic silencing ofESR1.
H3K9 methylation is often linked to DNA methylation and several BAHD1-associated part-ners are known to interact with DNA methyltransferases [42–45]. To test whether BAHD1 level also affects DNA methylation patterns atESR1, we exploited the DNA methylome data-sets of HEK-CT and HEK-BAHD1 cells that we recently obtained by whole-genome bisulfite sequencing (BS-seq) [14]. In this study, we found that BAHD1 overexpression in HEK293 cells stimulatesde novoDNA methylation in autosomes at ~80,000 regions that become hyper-methylated when compared to control cells. These“BAHD1-DMRs”group into large (0.3–6.5 Mb) chromosomal domains, termed BAHD1-Associated Domains (BADs, [14]). We observed that one such BAD was present on chr6 in a large region containing theESR1locus (Fig 6E). The high density of BAHD1-DMRs located at theESR1proximal and gene body regions sug-gests that BAHD1 overexpression stimulates large-scale epigenetic changes. Taken together, these results provide evidence that BAHD1-associated complexes induce histone and DNA modifications that shape repressive chromatin structures.
Discussion
Developmental and physiological roles of BAHD1
The functions of BAHD1-mediated chromatin reorganization in developmental and physio-logical processes were hitherto unknown. Deletion ofBahd1in mice does not lead to embry-onic lethality or anatomical malformations in fetuses. However, murineBahd1-KO placentas are small and display histomorphological alterations, including reduced surface area of the lab-yrinthine zone and a thinner junctional zone and decidua. The lack of trophoblast glycogen cells is particularly striking, suggesting a failure in the differentiation program. The growth restriction ofBahd1-KO fetuses is likely to be secondary to defective placental nutrient exchange resulting from these placental abnormalities. In addition, as there is substantial deregulation of metabolic genes inBahd1-KO MEFs, the perinatal death ofBahd1-KO pups likely results from metabolic defects in embryos. The rare mice surviving beyond birth are males with a lower weight than controls, associated with decreased fat mass and lower levels of circulating cholesterol, glucose and leptin. In light of our finding that the transcriptional co-repressor MIER1 is a key partner of BAHD1, it is striking thatMier1null mice also show decreased body weight and reduced levels of circulating glucose and cholesterol (data from The Mouse Phenotyping Consortium and The Wellcome Trust Sanger Institute, references inS1 Text). This phenocopy is a strong argument in favor of BAHD1 and MIER1 cooperating to control the expression of genes involved in energy metabolism in somatic tissues.
BAHD1 and MIER proteins define a novel chromatin-repressive complex
MBD1) and its overexpression is sufficient to compact chromatin [12]. We now bring evidence that BAHD1 and MIER act in partnership within a novel histone deacetylase complex involved in gene silencing. First, BAHD1 co-purifies with MIER, HDAC1/2, G9a and CDYL in very dif-ferent cellular models: human HEK293 cells, as shown here, and mouse ES cells [15]. Second, as in other subunits of HDAC1/2-associated complexes, MTAs of NuRD [8–10,25](Fig 4D) and RERE [26–28] (Fig 4C), a BAH domain is present in BAHD1 and HDAC-interacting ELM2-SANT domains are present in MIER [27,46]. We found that a truncation of the BAH domain in BAHD1 abrogates BAHD1 coimmunoprecipitation with MIER1 and HDAC2. From this, we propose that MTA, RERE and BAHD1-MIER define related macromolecular complexes of the“NuRD superfamily”and to name“BAHD1 complexes”those containing a BAHD1 subunit, as BAHD1 has no homolog or isoform. MIER1, MIER2 and MIER3 could be incorporated into distinct BAHD1 complexes leading to functional redundancy and/or con-text-dependent functions, as described for MTA1, MTA2 and MTA3. MIER1 is the most abun-dant partner of BAHD1 in HEK293 cells and its nuclear localization, including at the Xi, depends on BAHD1 expression levels. This translocation is likely to have functional conse-quences, as MIER1 nuclear/cytoplasmic distribution varies with cell type and stage of differen-tiation [47,48].Bahd1-andMier1-KO adult mice share common phenotypes but a prenatal growth restriction is not reported forMier1-KO; hence, the BAHD1-associated regulatory gene network in embryonic tissues likely involves other partners than MIER1.
Regulation of metabolism gene networks by BAHD1
Genes altered inBahd1-KO placentas or embryonic fibroblasts are mainly up-regulated com-pared to wild type controls, consistent with BAHD1 acting as a repressor. The most significant biological process associated with these genes, and with those repressed in BAHD1-overexpres-sing human HEK293 cells, is steroid metabolism. This functional convergence is striking and consistent with the observed hypocholesterolemia and hypolipidaemia inBahd1-KO mice. We observed that genes associated with this biological function inBahd1-KO MEFs and HEK-BAHD1 cells (e.g.DHCR24,HMGCS1,LDLR,NSDHL,SREBF2,SC4MOL)mostly differ with those inBahd1-KO murine placentas (e.g.Apoc3,Atp8b1,Cyp11A1,Insig2,Osbpl5,Pbx1,
VldlR). Thus, like many other chromatin repressors [2], BAHD1 regulates distinct targets in different tissues and at different developmental stages. However, some of the BAHD1bona fide
target genes can be common to different biological systems, as exemplified by the steroid hor-mone receptor geneESR1. BAHD1 binds the proximal region of humanESR1and represses
ESR1both in human cells and murine placentas. In addition, changes inBAHD1expression levels in HEK293 cells alter the patterns of H3K9 modifications and DNA methylation at the
ESR1locus, which is consistent with the interaction of BAHD1 with HDACs, KMTs, HP1 and MBD1 and the crosstalk between histone and DNA modifications [49].
It is worth mentioning that MTA1 [50] and SIN3a [39] have also been shown to represses
ESR1in other cell types, indicating that different HDAC complexes control the epigenetic silencing ofESR1. Recruitment of BAHD1 at specific sites of the genome might rely on the combinatorial assembly of BAHD1-MIER subunits with transcription factors. The product of
metabolism and placental cell differentiation [33–36]. This raises the plausible hypothesis that the BAHD1-associated chromatin complex could act as a transcriptional co-repressor in syn-ergy with different TFs in the context of placental functions and lipid metabolism.
Role of BAHD1 in shaping the placental differentiation program
Placenta morphogenesis depends on the correct balance of cytotrophoblast proliferation and differentiation, into either syncytiotrophoblast involved in nutrient/gas exchange or invasive extravillous trophoblast involved in establishment of blood flow to the placenta. It is proposed that ESR1 controls the proliferation of estrogen-dependent cells, while ESR2 controls their maturation, hence trophoblast differentiation is associated with the transition fromEsr1to
Esr2expression [51,52]. By maintaining unbalanced expression ofEsr1at an inappropriate time of the gestation, BAHD1 deficiency could disturb trophoblast differentiation.Pgrand
Leprgenes are also deregulated inBahd1-KO placentas; this should affect progesterone and leptin signaling, also important in placental development [53,54]. Therefore, BAHD1 could play a role in trophoblast differentiation, in particular in the formation of glycogen-producing cells, by controlling hormone signaling in a timely manner, particularly in the junctional zone, an important endocrine region. Knockdown ofBahd1in the mouse placenta results in up-regu-lation of several other genes that also have relevance to placental development. Among them,
Htra3andTfpi2are two confirmed imprinted genes expressed from the maternally inherited allele [24]. Maternally expressed genes have been proposed to limit maternal resource provi-sion; thus up-regulation of such genes is consistent with a placental growth restriction observed upon BAHD1 deficiency. In fact,HtrA3andTfpi2are highly transcribed in the placenta and involved in the regulation of endothelial function, trophoblast migration and invasion [55–58]. Further studies will be required to explore whether BAHD1 directly targets these genes and contributes to their imprinting.
Roles of BAHD1 in diseases
levels ofHMGCS1,LDLRandSC4MOLcorrelated with obesity-related type 2 diabetes and car-diovascular diseases [66]. Together, these results indicate that dysfunction of BAHD1 com-plexes could promote aberrant epigenetic phenomena at the origin of different disorders. Detailed understanding of how and where BAHD1 complexes establish repressive chromatin states could be instrumental for the development of new strategies for selective treatment of metabolic disorders in the future.
Methods
Ethics statement
Mice were bred and maintained in the animal facilities of the Institut Clinique de la Souris (ICS, Illkirch, France) under pathogen-free conditions. The ICS facilities are licensed by the French Ministry of Agriculture (agreement #A67-218-37). All animal procedures were approved by the local ethical committee CREMEAS (registered under the reference“C2EA–
35”), and were supervised by M.F.C. and O.W. who are qualified in compliance with the Euro-pean Community guidelines for laboratory animal care and use (2010/63/UE Directive).
Cell lines, plasmids, antibodies, siRNAs and immunostaining
Human cell lines derive from HEK293 cells (ATCC CRL-1573): the HPT-BAHD1 inducible line and its isogenic HPT-control are described in [11]; the HEK-BAHD1 constitutive line and its isogenic HEK-CT control are described in [14]; HEK293-FT are from Invitrogen (Thermo-Fisher Scientific). Plasmid pcV5-BAHD1 (BUG2289), pYFPc (also named pEYFP-Citrine-N1, BUG2897), pYFPc-BAHD1 (BUG2897) and pYFPc-BAHD1-ΔBAH (BUG2740) are described in [12]. pYFPc-BAHD1ΔcPRR (BUG2897) is described in [31]. Antibodies were against BAHD1 (Abcam, 46573), MIER1 (Sigma, HPA019589), HDAC1 (Abcam, ab7028), HDAC2 (Abcam, ab7029), HP1γ(Euromedex, 2MOD-1G6-AS), KAP1 (Abcam, ab10483), G9a (MBL Cliniscience, D141-3), MBD1 (Abcam, ab3753), tubulinα(Santa Cruz, sc5546), H3K9me2 (Abcam ab1220), H3K9me3 (Abcam ab8898), H3K9ac (Upstate/Millipore 07–352), V5 and V5-HRP (Invitrogen R960-25, R961-25), GFP (Mouse anti-GFP Sigma/Roche 11814460001 used in IP and Rabbit anti-GFP Santa-Cruz sc-8334, used in WB, which both recognize YFPc) and control IgG mouse (Santa-Cruz sc-2025) and IgG rabbit (Santa-Cruz sc-2027). Fluorescent secondary antibodies were from Jackson ImmunoResearch or Molecular Probes, and HRP-conjugated secondary antibodies were from AbCys or Abcam (IgG Veriblot for IP, ab131368). siRNAs were purchased from Dharmacon (ThermoFisher Scientific) as follows: on-TARGET-plus Non-targeting pool (D-001810-10-20), BAHD1 (L-020357-01), MIER1 (M-014201-02), MIER2 (M-023917-01), MIER3 (M-015618-01). Cells were transfected 72h with siRNA using Lipofectamine RNAimax (Life Technologies, Grand Island, NY) according to the manufac-turer's instructions. Immunofluorescence and XIST FISH assays were as described in [12].
Mice breeding and phenotyping
Bahd1+/-mice have been described in [11]. Mice were bred and maintained in the animal facili-ties of the Institut Clinique de la Souris (ICS, Illkirch, France) under pathogen-free conditions. Throughout the experiment mice were housed in the same climate-controlled stable with a 12h/12h dark-light cycle and handled identically. For wild type andBahd1-/-production,
in S1 Text. All the data are expressed as mean ± SE. Statistical analysis were performed using a one way ANOVA tests followed by a Fischer’s PLSD test with significance set atP<0.05.
P<0.05,P<0.01,P<0.0001.
Microarray processing and analysis
Total RNAs were extracted fromBahd1+/+and Bahd1-/-placentas at E16.5 (n = 6/genotype) or E18.5 (n = 3/genotype), as well as fromBahd1+/+and Bahd1-/-MEFs (n = 3/genotype) and HEK-CT and HEK-BAHD1 cells (n = 3/cell line) using RNeasy Kit (Qiagen), treated TURBO DNA-freeTM kit (Ambion). RNA concentration and integrity were tested with RNA quality was monitored on Agilent RNA Pico LabChips (Agilent Technologies, Palo Alto, CA). 100 ng of RNA per sample were used as templates for the synthesis of hybridization probes for Affymetrix GeneChip Microarrays (Genechip HuGene 1.0 ST for HEK-CT and HEK-BAHD1 cells; Mouse gene 1.0 for E16.5 placentas; Mouse Exon 1.0 ST for E18.5 placentas and MEFs). Hybridization was carried out with biological replicates according to the expression analysis technical manual with wash and stain kit (Affymetrix). Gene-level expression values were derived from the CEL file probe-level hybridization intensities using the model-based Robust Multichip Average algo-rithm (RMA) [67]. RMA performs normalization, background correction and data summariza-tion. An analysis is performed using the LPE test [68] and ap-value threshold ofp<0.05 is used as the criterion for expression. The estimated false discovery rate (FDR) of this analyze was calcu-lated using the Benjamini Hochberg approach in order to correct for multiple comparisons. Results were annotated using information provided by Affymetrix. Full data sets were reduced by discarding genes with“EST”and“unknown”annotation labels. To generate functional clusters of genes, we used the DAVID program (http://david.abcc.ncifcrf.gov, 2015 version; [20]) for selected gene sets according to gene ontology (GO) of biological process categories. To search for transcriptional regulators driving the differential gene expression changes we used the Ingenuity Pathway Analysis Upstream Regulator software [69]. Datasets have been deposited in Gene Expression Omnibus (GEO) and are accessible through accession number, as follows: GEO series GSE51868 (transcriptomes of HEK-CT and HEK-BAHD1); GSE53443 and GSE53442 (tran-scriptome ofBahd1-WT andBahd1-KO placentas at E16.5 and at E18.5) and GSE73816 (tran-scriptome ofBahd1-WT andBahd1-KO MEFs).
RNA extraction and quantification of transcript levels
Total RNA from HEK293-CT and HEK-BAHD1 cells, HEK293-FT cells treated 72h with siR-NAs, or from mouse placentas or MEFs was extracted using the RNeasy Kit (Qiagen), from three to six biological replicates. Genomic DNA was removed by treatment with TURBO DNA-freeTM kit (Ambion). cDNAs were generated from 1 to 2μg total RNA using the RT2-HT first strand kit (Qiagen/SABiosciences). Quantitative Real-Time PCR was performed on Biorad MyiQ device (Biorad), using SsoFast Evagreen supermix (Biorad), as specified by the supplier. Each reaction was performed in triplicate. Data were analyzed by theΔΔCt method. Target gene expression data were normalized to the relative expression of humanGAPDHor mouseGapdh(andHprt, for imprinted genes) andYWHAZwas used as a control gene. Statis-tical significance of the difference in mean expression of genes was evaluated using the Student t test; aPvalue<0.05 was considered significant. Primer sets are provided inS1 Text.
Tandem affinity purification of BAHD1-associated proteins and DNA,
nuclear protein and chromatin immunoprecipitations
The TAP-TAG protocol to purify the partners of His6-Protein-C-tagged BAHD1 in
analysis and precipitation of the associated DNA are detailed inS1 Text. Immunoprecipitation (IP) of nuclear proteins was performed as described in [70] with the following modifications. Nuclear soluble and insoluble fractions were sonicated, mixed and incubated overnight at 4°C with 1–3μg of the indicated antibodies and then with Dynabeads Protein G (#10004D, Novex) at 4°C during 2h30. IPs were washed 4 times with washing buffer (Tris 20mM pH = 7,65, NaCl 150mM, 0,05% IGEPAL, 2,5% Glycerol, 0,5mM EDTA, 0,6mM DTT). Samples were resus-pended in 1X Laemmli and boiled at 95°C for 10 min. Proteins were separated on 8–10% SDS-PAGE gels, transfered to nitrocellulose membrane, probed with primary and secondary antibodies and detected by chemiluminescence (SuperSignal West Femto Substrate #34094, ThermoFisher Scientific). Blots were visualized on Films (Amersham) or using a ChemiDoc MP Imaging system (Bio-Rad). ChIP of modified H3K9 were performed in three independent biological replicates, using the ChIP-IT Express Enzymatic Kit (Active Motif) according to manufacturers instructions. Briefly, HEK293-FT cells were grown in T150 flasks for 72h with either siRNA against BAHD1 or non-targeting control siRNA (up to 70–90% confluency). One flask was kept for RNA extraction and quantification ofBAHD1knockdown by RT-qPCR. Cells from other flasks were harvested and cross-linked with a final concentration of 1% form-aldehyde (Sigma-Aldrich) for 10 minutes. Fixation was stopped with 0.125 M glycine and cells were washed twice with ice-cold PBS. Collected cells were lysed and nuclei pellet were resus-pended in shearing cocktail and incubated for digestion for 10 minutes at 37°C. Shearing effi-ciency was tested by agarose gel electrophoresis and DNA concentration was quantified with a Nanodrop 2000 (ThermoFisher Scientific) to normalize the quantity of chromatin per ChIP. For each ChIP, 3μg of antibody were used. 10μL of chromatin was kept as input and processed as ChIP samples. After washing and reverse crosslinking of precipitated samples, DNA was purified by two extractions with equal volumes of phenol:chloroform:isoamylalcohol (25:24:1, pH = 8), assisted by phase lock heavy gel tubes (5Prime), followed by ethanol precipitation. Pel-lets were washed once in 75% ethanol, then resuspended in 50μL DNAse-free water. H3K9ac, H3K9me2 and H3K9me3 enrichment levels were measured by qPCR with primers matching in theESR1locus and the non-target controlGAPDHregion (primer sets are provided inS1 Text). A standard curve was generated using 10%, 1%, 0.1% and 0.01% of input DNA. We first determined the fold enrichment of the ChIP sample relative to the IgG sample and then the effect of BAHD1 knockdown on H3K9 modifications was calculated as the ratio of enrichment in cells treated with BAHD1 siRNA to that in cells treated with control siRNA (presented in Fig 6andS6 Figas a Log2 ratio).
Supporting Information
S1 Text. Additional methods, references, results and discussion. (PDF)
S1 Fig. Blood chemistry on samples collected fromBahd1-KO andBahd1-WT mice. A.
Blood sample analysis of 11–20 week-oldBahd1-KO andBahd1-WT mice fasted for 4 hours (n = 5/genotype).B.Blood sample analysis of 18 month-oldBahd1-KO andBahd1-WT mice fasted for 16 hours (n = 4/genotype). Data are expressed as the mean ± SE (P<0.05;
P<0.01).
(TIF)
S2 Fig. Effects of theBahd1-null mutation in the E16.5 placenta and fetal liver. A.
delineate decidua basalis (Db) and junctional zone (Jz).B.Histological analysis andBahd1+/+
andBahd1−/−E16.5 livers with hematoxylin and eosin (HE) staining. Magnification 20-fold. Squared regions highlight hepatic cells.
(TIF)
S3 Fig. Expression ofBAHD1,IGF2andMIER1transcripts in response to induction of BAHD1in HPT-BAHD1 cells.RT-qPCR quantification of transcript levels in HPT-BAHD1
cells relative to HPT-Control cells, grown 72h with doxycycline (n = 3 for each condition). Values are normalized byGAPDH. Data are expressed as mean ± SD (ns, non-significant;
P<0.001).
(TIF)
S4 Fig. Raw images for the western blots used inFig 4B.Results of the double-affinity purifi-cation of HPC-tagged BAHD1 were validated by western blot analysis of inputs and eluates from the 1stand 2ndaffinity purifications (E1 and E2) from chromatin extracts of HPT-BAHD1 cells (“BAHD1”) or HPT-control cells (Control). Membranes were often cut in two pieces to detect proteins of different molecular weight, enabling to check sample loading with a common anti-body (α-) (e.g. HDAC1, HDAC2, histones H3 or H4). However, this was not always feasible due to the similar molecular weight of a number of proteins of interest, resulting in overlapping hybridization signals in the same region of membranes. We thus had to perform several loadings of the same samples on distinct gels.A. Raw images of blots detecting HPC-tagged BAHD1 with Protein C antibodies. H4 was used as a loading control for inputs (same membrane, cut horizon-tally and probed with H4 antibodies).B.Raw images of blots detecting G9a with G9a antibodies. InFig 4B, E1 and E2 lanes were cut to follow the order of samples used when probing with the other antibodies. FT indicates the column flow through. HDAC2 was used as a loading control (same membrane, cut horizontally).C.Raw images of blots detecting KAP1 with KAP1 antibod-ies. HDAC1 was used as a loading control (same membrane, cut horizontally).D.Raw images of blots detecting MIER1 with MIER1 antibodies. HDAC2 was used as a loading control (same membrane, cut horizontally).E.Raw images of blots detecting MBD1 with MBD1 antibodies.F. Raw images of blots for HDAC1 and HDAC2 using HDAC1 and HDAC2 antibodies, respec-tively. HDAC1 and HDAC2 having the same size, two different blots were performed.G.Raw images of the blots detecting HP1γwith HP1γantibodies.
(TIF)
the membranes were probed with HDAC2 (top) or MIER1 (bottom) antibodies. On the top, the IP control and IP HDAC2 samples were diluted 1/100 compared to other IPs, since the sig-nal of immunoprecipitated HDAC2 is strong and colocalizes near IgG heavy chains. In C and D, HDAC2 copurifies with low amounts of BAHD1, MIER1 and HP1γ, which might be explained by the fact that HDAC2 belongs to many distinct macromolecular complexes.E.IP assays of YFPc-BAHD1 or truncated mutants in HEK293-FT cells. Nuclear extracts from HEK293-FT cells expressing YFPc-BAHD1, YFPc-BAHD1-ΔcPRR or YFPc-BAHD1-ΔBAH were used in IP assays with mouse YFP antibodies followed by immunoblotting with rabbit HDAC2, MIER1 or YFP antibodies or mouse HP1γantibodies. The last lane shows the HDAC2 blot stripped and reprobed with YFP antibodies. This experiment is a replicate ofFig 4F, except that inFig 4Fwe used IgG Veriblot secondary antibodies to minimize the detection of light-chains (IgG) of the HP1γprimary antibody.
(TIF)
S6 Fig. BAHD1 depletion alters the patterns of H3K9 acetylation and methylation at the ESR1locus.HEK293-FT cells were transfected with control or BAHD1 siRNA in three
inde-pendent biological replicates (A, B, C). We performed one (A, B) or two (C, left and right his-tograms) ChIP per antibody and respective mouse or rabbit control IgG, for each modified H3K9. Enrichment of H3K9ac, H3K9me2 and H3K9me3 relative to IgG control atESR1and
GAPDHregions were estimated by ChIP-qPCR in BAHD1-depleted and control cells (as inFig 6). Histograms show the relative fold change of ChIP enrichment in cells with BAHD1 siRNA over cells with control siRNA in Log2 ratios. Results of replicate 3 (C) are shown inFig 6D. (TIF)
S1 Table.BAHD1is expressed at a low level in different tissues.
(PDF)
S2 Table. Blood chemistry inBahd1haplodeficient mice compared to wild type littermates.
(PDF)
S3 Table. Genes differentially expressed inBahd1-KO compared toBahd1-WT placentas at both E16.5 and E18.5 stages.
(PDF)
S4 Table. Biological processes associated with genes deregulated inBahd1-KO murine pla-centas,Bahd1-KO MEFs and in human HEK-BAHD1 cells.
(PDF)
S5 Table. Overlap betweenBahd1-KO MEFs,Bahd1-KO placentas (E18.5) and human HEK-BAHD1 cells transcriptome datasets.
(PDF)
S6 Table. Tandem-affinity-purification of BAHD1-associated partners. (PDF)
S7 Table. Transcription factors predicted to regulate BAHD1-associated genes using the Ingenuity's Upstream Regulator Analysis.
(PDF)
Acknowledgments
at the ICS. We are grateful to Alexis Gautreau for help in the TAP assays and to the Taplin Bio-logical Mass Spectrometry facility for MS assays.
Author Contributions
Conceived and designed the experiments: GL AL OW EJR MLG MFC JF TS HB. Performed the experiments: GL AL RP OW EJR MLG MFC GS HB. Analyzed the data: GL AL RP OW EL EJR MFC JF TS JYC ACFS PC HB. Contributed reagents/materials/analysis tools: MWD SASA. Wrote the paper: HB. Supervised the work: HB.
References
1. Portela A, Esteller M. Epigenetic modifications and human disease. Nat Biotechnol. 2010; 28 (10):1057–68. doi:10.1038/nbt.1685PMID:20944598
2. Laugesen A, Helin K. Chromatin repressive complexes in stem cells, development, and cancer. Cell Stem Cell. 2014; 14(6):735–51. doi:10.1016/j.stem.2014.05.006PMID:24905164
3. Xue Y, Wong J, Moreno GT, Young MK, Cote J, Wang W. NURD, a novel complex with both ATP-dependent chromatin-remodeling and histone deacetylase activities. Mol Cell. 1998; 2(6):851–61. PMID:9885572
4. Zhang Y, Ng HH, Erdjument-Bromage H, Tempst P, Bird A, Reinberg D. Analysis of the NuRD subunits reveals a histone deacetylase core complex and a connection with DNA methylation. Genes Dev. 1999; 13(15):1924–35. PMID:10444591
5. Laherty CD, Yang WM, Sun JM, Davie JR, Seto E, Eisenman RN. Histone deacetylases associated with the mSin3 corepressor mediate mad transcriptional repression. Cell. 1997; 89(3):349–56. PMID:
9150134
6. Humphrey GW, Wang Y, Russanova VR, Hirai T, Qin J, Nakatani Y, et al. Stable histone deacetylase complexes distinguished by the presence of SANT domain proteins CoREST/kiaa0071 and Mta-L1. J Biol Chem. 2001; 276(9):6817–24. PMID:11102443
7. Kelly RDW, Cowley SM. The physiological roles of histone deacetylase (HDAC) 1 and 2: complex co-stars with multiple leading parts. Biochemical Society Transactions. 2013; 41:741–9. doi:10.1042/ BST20130010PMID:23697933
8. Bowen NJ, Fujita N, Kajita M, Wade PA. Mi-2/NuRD: multiple complexes for many purposes. Biochim Biophys Acta. 2004; 1677(1–3):52–7. PMID:15020045
9. Lai AY, Wade PA. Cancer biology and NuRD: a multifaceted chromatin remodelling complex. Nat Rev Cancer. 2011; 11(8):588–96. doi:10.1038/nrc3091PMID:21734722
10. McDonel P, Costello I, Hendrich B. Keeping things quiet: Roles of NuRD and Sin3 co-repressor com-plexes during mammalian development. International Journal of Biochemistry & Cell Biology. 2009; 41 (1):108–16.
11. Lebreton A, Lakisic G, Job V, Fritsch L, Tham TN, Camejo A, et al. A bacterial protein targets the BAHD1 chromatin complex to stimulate type III interferon response. Science. 2011; 331(6022):1319–
21. Epub 2011/01/22. doi:10.1126/science.1200120PMID:21252314
12. Bierne H, Tham TN, Batsche E, Dumay A, Leguillou M, Kerneis-Golsteyn S, et al. Human BAHD1 pro-motes heterochromatic gene silencing. Proc Natl Acad Sci U S A. 2009; 106(33):13826–31. doi:10.
1073/pnas.0901259106PMID:19666599
13. Weimann M, Grossmann A, Woodsmith J, Ozkan Z, Birth P, Meierhofer D, et al. A Y2H-seq approach defines the human protein methyltransferase interactome. Nature methods. 2013; 10(4):339–42. doi:
10.1038/nmeth.2397PMID:23455924
14. Libertini E, Lebreton A, Lakisic G, Dillies MA, Beck S, Coppee JY, et al. Overexpression of the Hetero-chromatinization Factor BAHD1 in HEK293 Cells Differentially Reshapes the DNA Methylome on Auto-somes and X Chromosome. Front Genet. 2015; 6:339. doi:10.3389/fgene.2015.00339PMID:
26648976
15. Escamilla-Del-Arenal M, da Rocha ST, Spruijt CG, Masui O, Renaud O, Smits AH, et al. Cdyl, a new partner of the inactive X chromosome and potential reader of H3K27me3 and H3K9me2. Mol Cell Biol. 2013; 33(24):5005–20. doi:10.1128/MCB.00866-13PMID:24144980
17. Simmons DG, Natale DR, Begay V, Hughes M, Leutz A, Cross JC. Early patterning of the chorion leads to the trilaminar trophoblast cell structure in the placental labyrinth. Development. 2008; 135(12):2083–
91. doi:10.1242/dev.020099PMID:18448564
18. Coan PM, Conroy N, Burton GJ, Ferguson-Smith AC. Origin and characteristics of glycogen cells in the developing murine placenta. Dev Dyn. 2006; 235(12):3280–94. PMID:17039549
19. Tesser RB, Scherholz PL, do Nascimento L, Katz SG. Trophoblast glycogen cells differentiate early in the mouse ectoplacental cone: putative role during placentation. Histochem Cell Biol. 2010; 134(1):83–
92. doi:10.1007/s00418-010-0714-xPMID:20544215
20. Huang DW, Sherman BT, Lempicki RA. Systematic and integrative analysis of large gene lists using DAVID bioinformatics resources. Nature Protocols. 2009; 4(1):44–57. doi:10.1038/nprot.2008.211
PMID:19131956
21. Williamson CM, Blake A, Thomas S, Beechey CV, Hancock J, BM C, et al. Mouse Imprinting Data and References. 2013.
22. Coan PM, Burton GJ, Ferguson-Smith AC. Imprinted genes in the placenta—a review. Placenta. 2005;
26 Suppl A:S10–20. PMID:15837057
23. Haig D. Coadaptation and conflict, misconception and muddle, in the evolution of genomic imprinting. Heredity (Edinb). 2014; 113(2):96–103.
24. Lefebvre L. The placental imprintome and imprinted gene function in the trophoblast glycogen cell line-age. Reprod Biomed Online. 2012; 25(1):44–57. doi:10.1016/j.rbmo.2012.03.019PMID:22560119
25. Millard CJ, Watson PJ, Celardo I, Gordiyenko Y, Cowley SM, Robinson CV, et al. Class I HDACs share a common mechanism of regulation by inositol phosphates. Mol Cell. 2013; 51(1):57–67. doi:10.1016/ j.molcel.2013.05.020PMID:23791785
26. Plaster N, Sonntag C, Schilling TF, Hammerschmidt M. REREa/Atrophin-2 interacts with histone dea-cetylase and Fgf8 signaling to regulate multiple processes of zebrafish development. Dev Dyn. 2007; 236(7):1891–904. PMID:17576618
27. Wang L, Charroux B, Kerridge S, Tsai CC. Atrophin recruits HDAC1/2 and G9a to modify histone H3K9 and to determine cell fates. EMBO Rep. 2008; 9(6):555–62. doi:10.1038/embor.2008.67PMID:
18451879
28. Bantscheff M, Hopf C, Savitski MM, Dittmann A, Grandi P, Michon AM, et al. Chemoproteomics profiling of HDAC inhibitors reveals selective targeting of HDAC complexes. Nat Biotechnol. 2011; 29(3):255–
65. doi:10.1038/nbt.1759PMID:21258344
29. Armache KJ, Garlick JD, Canzio D, Narlikar GJ, Kingston RE. Structural basis of silencing: Sir3 BAH domain in complex with a nucleosome at 3.0 A resolution. Science. 2011; 334(6058):977–82. doi:10. 1126/science.1210915PMID:22096199
30. Yang N, Xu RM. Structure and function of the BAH domain in chromatin biology. Crit Rev Biochem Mol Biol. 2013; 48(3):211–21. doi:10.3109/10409238.2012.742035PMID:23181513
31. Lebreton A, Job V, Ragon M, Le Monnier A, Dessen A, Cossart P, et al. Structural basis for the inhibi-tion of the chromatin repressor BAHD1 by the bacterial nucleomodulin LntA. MBio. 2014; 5(1):e00775–
13. doi:10.1128/mBio.00775-13PMID:24449750
32. Ding Z, Gillespie LL, Mercer FC, Paterno GD. The SANT domain of human MI-ER1 interacts with Sp1 to interfere with GC box recognition and repress transcription from its own promoter. J Biol Chem. 2004; 279(27):28009–16. PMID:15117948
33. Rangwala SM, Lazar MA. Peroxisome proliferator-activated receptor gamma in diabetes and metabo-lism. Trends Pharmacol Sci. 2004; 25(6):331–6. PMID:15165749
34. Barak Y, Sadovsky Y, Shalom-Barak T. PPAR Signaling in Placental Development and Function. PPAR Res. 2008; 2008:142082. doi:10.1155/2008/142082PMID:18288278
35. Maltepe E, Krampitz GW, Okazaki KM, Red-Horse K, Mak W, Simon MC, et al. Hypoxia-inducible fac-tor-dependent histone deacetylase activity determines stem cell fate in the placenta. Development. 2005; 132(15):3393–403. PMID:15987772
36. Rankin EB, Rha J, Selak MA, Unger TL, Keith B, Liu Q, et al. Hypoxia-inducible factor 2 regulates hepatic lipid metabolism. Mol Cell Biol. 2009; 29(16):4527–38. doi:10.1128/MCB.00200-09PMID:
19528226
37. McCarthy PL, Mercer FC, Savicky MW, Carter BA, Paterno GD, Gillespie LL. Changes in subcellular localisation of MI-ER1 alpha, a novel oestrogen receptor-alpha interacting protein, is associated with breast cancer progression. Br J Cancer. 2008; 99(4):639–46. doi:10.1038/sj.bjc.6604518PMID:
18665173
39. Ellison-Zelski SJ, Solodin NM, Alarid ET. Repression of ESR1 through actions of estrogen receptor alpha and Sin3A at the proximal promoter. Mol Cell Biol. 2009; 29(18):4949–58. doi:10.1128/MCB.
00383-09PMID:19620290
40. Carroll JS, Meyer CA, Song J, Li W, Geistlinger TR, Eeckhoute J, et al. Genome-wide analysis of estro-gen receptor binding sites. Nat Genet. 2006; 38(11):1289–97. PMID:17013392
41. Kos M, Reid G, Denger S, Gannon F. Minireview: genomic organization of the human ERalpha gene promoter region. Mol Endocrinol. 2001; 15(12):2057–63. PMID:11731608
42. Fuks F, Burgers WA, Godin N, Kasai M, Kouzarides T. Dnmt3a binds deacetylases and is recruited by a sequence-specific repressor to silence transcription. EMBO J. 2001; 20(10):2536–44. PMID:
11350943
43. Fuks F, Hurd PJ, Deplus R, Kouzarides T. The DNA methyltransferases associate with HP1 and the SUV39H1 histone methyltransferase. Nucleic acids research. 2003; 31(9):2305–12. PMID:12711675
44. Lehnertz B, Ueda Y, Derijck AA, Braunschweig U, Perez-Burgos L, Kubicek S, et al. Suv39h-mediated histone H3 lysine 9 methylation directs DNA methylation to major satellite repeats at pericentric hetero-chromatin. Current biology: CB. 2003; 13(14):1192–200. PMID:12867029
45. Li H, Rauch T, Chen ZX, Szabo PE, Riggs AD, Pfeifer GP. The histone methyltransferase SETDB1 and the DNA methyltransferase DNMT3A interact directly and localize to promoters silenced in cancer cells. J Biol Chem. 2006; 281(28):19489–500. PMID:16682412
46. Ding Z, Gillespie LL, Paterno GD. Human MI-ER1 alpha and beta function as transcriptional repressors by recruitment of histone deacetylase 1 to their conserved ELM2 domain. Mol Cell Biol. 2003; 23 (1):250–8. PMID:12482978
47. Clements JA, Mercer FC, Paterno GD, Gillespie LL. Differential splicing alters subcellular localization of the alpha but not beta isoform of the MIER1 transcriptional regulator in breast cancer cells. PLoS One. 2012; 7(2):e32499. doi:10.1371/journal.pone.0032499PMID:22384264
48. Li S, Paterno GD, Gillespie LL. Nuclear localization of the transcriptional regulator MIER1alpha requires interaction with HDAC1/2 in breast cancer cells. PLoS One. 2013; 8(12):e84046. doi:10.1371/journal. pone.0084046PMID:24376786
49. Cedar H, Bergman Y. Linking DNA methylation and histone modification: patterns and paradigms. Nat Rev Genet. 2009; 10(5):295–304. doi:10.1038/nrg2540PMID:19308066
50. Mazumdar A, Wang RA, Mishra SK, Adam L, Bagheri-Yarmand R, Mandal M, et al. Transcriptional repression of oestrogen receptor by metastasis-associated protein 1 corepressor. Nat Cell Biol. 2001; 3 (1):30–7. PMID:11146623
51. Bukovsky A, Caudle MR, Cekanova M, Fernando RI, Wimalasena J, Foster JS, et al. Placental expres-sion of estrogen receptor beta and its hormone binding variant—comparison with estrogen receptor
alpha and a role for estrogen receptors in asymmetric division and differentiation of estrogen-depen-dent cells. Reprod Biol Endocrinol. 2003; 1:36. PMID:12740031
52. Fujimoto J, Nakagawa Y, Toyoki H, Sakaguchi H, Sato E, Tamaya T. Estrogen-related receptor expres-sion in placenta throughout gestation. J Steroid Biochem Mol Biol. 2005; 94(1–3):67–9. PMID:
15862951
53. Albrecht ED, Pepe GJ. Estrogen regulation of placental angiogenesis and fetal ovarian development during primate pregnancy. Int J Dev Biol. 2010; 54(2–3):397–408. doi:10.1387/ijdb.082758eaPMID:
19876841
54. Gambino YP, Perez Perez A, Duenas JL, Calvo JC, Sanchez-Margalet V, Varone CL. Regulation of leptin expression by 17beta-estradiol in human placental cells involves membrane associated estrogen receptor alpha. Biochim Biophys Acta. 2012; 1823(4):900–10. doi:10.1016/j.bbamcr.2012.01.015
PMID:22310000
55. Nie G, Li Y, Hale K, Okada H, Manuelpillai U, Wallace EM, et al. Serine peptidase HTRA3 is closely associated with human placental development and is elevated in pregnancy serum. Biol Reprod. 2006; 74(2):366–74. PMID:16251496
56. Singh H, Makino SI, Endo Y, Nie G. Inhibition of HTRA3 stimulates trophoblast invasion during human placental development. Placenta. 2010; 31(12):1085–92. doi:10.1016/j.placenta.2010.10.003PMID:
21035848
57. Sober S, Reiman M, Kikas T, Rull K, Inno R, Vaas P, et al. Extensive shift in placental transcriptome profile in preeclampsia and placental origin of adverse pregnancy outcomes. Sci Rep. 2015; 5:13336. doi:10.1038/srep13336PMID:26268791