between Obesity, Dyslipidemia and Cancer
Magomed Khaidakov1*, Sona Mitra1, Bum-Yong Kang3, Xianwei Wang1, Susan Kadlubar2, Giuseppe Novelli4, Vinay Raj2, Maria Winters1, Weleetka C. Carter1, Jawahar L. Mehta1*
1Department of Internal Medicine, College of Medicine, and the Central Arkansas Veterans Healthcare System, Little Rock, Arkansas, United States of America,2Division of Medical Genetics, College of Medicine, University of Arkansas for Medical Sciences, Little Rock, Arkansas, United States of America,3Emory University, Atlanta, Georgia, United States of America,4Department of Genetics, University of Rome ‘‘Tor Vergata’’, Rome, Italy
Abstract
Recent studies have linked expression of lectin-like ox-LDL receptor 1 (OLR1) to tumorigenesis. We analyzed microarray data fromOlr1knockout (KO) and wild type (WT) mice for genes involved in cellular transformation and evaluated effects ofOLR1 over-expression in normal mammary epithelial cells (MCF10A) and breast cancer cells (HCC1143) in terms of gene expression, migration, adhesion and transendothelial migration. Twenty-six out of 238 genes were inhibited in tissues of OLR1 KO mice; the vast majority of OLR1 sensitive genes contained NF-kB binding sites in their promoters. Further studies
revealed broad inhibition of NF-kB target genes outside of the transformation-associated gene pool, with enrichment themes of defense response, immune response, apoptosis, proliferation, and wound healing. Transcriptome ofOlr1KO mice also revealed inhibition ofde novo lipogenesis, rate-limiting enzymes fatty acid synthase (Fasn), stearoyl-CoA desaturase (Scd1) and ELOVL family member 6 (Elovl6), as well as lipolytic phospholipase A2 group IVB (Pla2g4b). In studies comparing MCF10A and HCC1143, the latter displayed 60% higher OLR1 expression. Forced over-expression of OLR1 resulted in upregulation of NF-kB (p65) and its target pro-oncogenes involved in inhibition of apoptosis (BCL2,BCL2A1,TNFAIP3) and
regulation of cell cycle (CCND2) in both cell lines. Basal expression ofFASN,SCD1 and PLA2G4B, as well as lipogenesis transcription factorsPPARA,SREBF2andCREM, was higher in HCC1143 cells. Over-expression ofOLR1in HCC1143 cells also enhanced cell migration, without affecting their adherence to TNFa-activated endothelium or transendothelial migration.
On the other hand,OLR1neutralizing antibody inhibited both adhesion and transmigration of untreated HCC1143 cells. We conclude thatOLR1may act as an oncogene by activation of NF-kB target genes responsible for proliferation, migration and inhibition of apoptosis andde novolipogenesis genes.
Citation:Khaidakov M, Mitra S, Kang B-Y, Wang X, Kadlubar S, et al. (2011) Oxidized LDL Receptor 1 (OLR1) as a Possible Link between Obesity, Dyslipidemia and Cancer. PLoS ONE 6(5): e20277. doi:10.1371/journal.pone.0020277
Editor:Carlo Gaetano, Istituto Dermopatico dell’Immacolata, Italy
ReceivedDecember 20, 2010;AcceptedApril 28, 2011;PublishedMay 26, 2011
Copyright:ß2011 Khaidakov et al. This is an open-access article distributed under the terms of the Creative Commons Attribution License, which permits
unrestricted use, distribution, and reproduction in any medium, provided the original author and source are credited. Funding:The authors have no support or funding to report.
Competing Interests:The authors have declared that no competing interests exist. * E-mail: [email protected] (MK); Mehtajl@uams edu (JLM)
Introduction
OLR1, a lectin-like scavenger receptor, is highly conserved in mammals [1] and it is capable of recognizing several ligands including the protein moiety of oxidized-LDL (ox-LDL), advanced glycation end-products, gram-positive and gram-negative bacteria and apoptotic cells [2].OLR1 is primarily expressed in vascular cells and vasculature-rich organs [3], and its activation by a wide range of stimuli indicative of dyslipidemia, inflammation and dam-age initiates several signaling cascades including MAPKs, other protein kinases as well as transcription factors NF-kB and AP-1
[4,5].
Overexpression ofOLR1has been shown in cellular components of atherosclerotic lesions [6]. Deletion of Olr1in Ldlr knockout (KO) mice results in much smaller atherosclerotic lesions asso-ciated with a drastic reduction of inflammation in the aortic wall [7].Olr1abrogation also attenuates angiotensin II-induced hyper-tension [8]. Similarly, abrogation of Olr1 reduces the extent of ischemia/reperfusion injury [9].
An association between obesity and atherosclerotic disease states in humans is well established [10,11]. Associations with obesity
have been found for various cancers, including breast and prostate neoplasms [12,13], suggesting a mechanistic overlap in the patho-biology of atherogenesis and tumorigenesis. Recently,Olr1, acting through NF-kB mediated inflammatory signaling, was strongly
implicated in carcinogenesis [14].
The focus of the present study was to further elucidate role of OLR1as an oncogene based on the premise that as a sensor of dyslipidemia and a molecule involved in NF-kB activation,OLR1 may be a link between dyslipidemia and cancer. The first part of the study was based on microarray analysis of wild-type (WT) and olr1KO mice. The second part defines the relationship between olr1and apoptosis and lipogenesis genes in breast cancer cell line HCC1143 and migration and adhesion of these cells.
Results
Comparison ofOLR1KO and transformation transcriptomes
The principal findings from the analysis of microarray data from the hearts of wild-type (WT) andOlr1 KO from our group have been reported elsewhere [15]. An additional analysis against
the overlapping set of genes (n = 238) found to be upregulated during transformation of two isogenic cell types [14] revealed that 26 genes from this list were inhibited in theOlr1KO transcriptome by at least 20% (Table 1). Among these were various components of immune response (Isg20, C1s, S1r, Ifrd1) and a number of transcription factors including well-known oncogenes (JunB, Rel, Irf2, Crem). Promoter analysis of resulting set of genes [16] iden-tified their enrichment for NF-kB binding sites (p,0.03) which
were located within 500 nucleotides proximal to transcriptional start sites in all but one (C1s)Olr1sensitive genes (n = 25, Fig. 1).
OLR1deletion results in a broad inhibition of NF-kB target genes
Further search for NF-kB regulated genes using a list compiled
from available web based databases and the literature revealed that inhibition of the p65 subunit observed in the Olr1 KO
transcriptome was complemented with upregulation of inhibitory Ikbasubunit (1.36 fold, p = 0.002, Table 1) and accompanied by significant downregulation of several (n = 61) NF-kB target genes
(Table 2). The combined set ofOlr1sensitive NF-kB target genes
displayed enrichment for regulation of apoptosis (p = 0.0002), proliferation (p = 0.00003), wound healing (p = 0.0002), defense response (p = 0.0011), immune response (p = 0.0003) and cell migration (p = 0.0009) (Figure 1). Among the genes involved in apoptosis (n = 11) and cellular proliferation (n = 12), 6 and 5, respectively, were negative regulators (David Bioinformatics Database, 17).
OLR1deletion suppresses lipogenesis genes
The microarray findings were validated for select genes using quantitative real-time PCR. For most of the tested genes, the transcriptional shifts in Olr1 KO observed in microarrays were
Table 1.A list of transformation related genes influenced byOlr1deletion in mice.
Gene REFSEQ ID Symbol Fold change P value
Inhibited
interferon-stimulated protein NM_020583 Isg20 23.26 0.007
matrix metallopeptidase 3 NM_0011135271 Mmp3 22.05 0.014
reticuloendotheliosis oncogene NM_009044 Rel 22.02 0.011
complement component 1, s subcomponent NM_144938 C1s 21.76 0.008
complement component 1, r subcomponent NM_023143, C1r 21.61 0.001
suppressor of cytokine signaling 3 NM_007707 Socs3 21.57 0.003
Jun-B oncogene NM_008416 Junb 21.56 0.0009
interferon regulatory factor 2 NM_008391 Irf2 21.51 0.044
fibroblast activation protein NM_007986 Fap 21.44 0.005
synaptosomal-associated protein 23 NM_009222 Snap23 21.41 0.033
N-myc (and STAT) interactor NM_001141949 Nmi 21.41 0.0019
cAMP responsive element modulator NM_013498 Crem 21.40 0.043
pentraxin related gene NM_008987 Ptx3 21.38 0.052
MAPK kinase kinase 7 interacting protein 2 NM_138667 Map3k7ip2 21.37 0.041
TNF receptor superfam. member 21 NM_178589 Tnfrsf21 21.35 0.011
Acetylglucosamine (GlcNAc) transferase NM_139144 Ogt 21.35 0.002
Ras-GTPase-activating protein SH3-domain binding protein 1 NM_013716 G3bp1 21.35 0.003
Rho family GTPase 3 NM_028810 Rnd3 21.31 0.013
interferon-related developmental regulator 1 NM_013562 Ifrd1 21.29 0.026
oxidation resistance 1 NM_130885 Oxr1 21.29 0.003
solute carrier family 2 member 3 NM_011401 Slc2a3 21.28 0.044
annexin A7 NM_009674 Anxa7 21.28 0.001
karyopherin (importin) alpha 2 NM_010655 Kpna2 21.27 0.014
prostaglandin-endoperoxide synthase 1 NM_008969 Ptgs1 21.26 0.031
lectin, galactose binding, soluble 8 NM_018886 Lgals8 21.20 0.014
Stimulated
ser (or cys) peptidase inhibitor, clade. E, memb 2 NM_009255 Serpine2 1.26 0.018
succinate dehydrogenase complex, subunit C NM_025321 Sdhc 1.29 0.017
E26 avian leukemia oncogene 2, 39domain NM_011809 Ets2 1.35 0.001
NF-klight polypeptide gene enhancer in B-cells inhibitor, alpha NM_010907 Nfkbia 1.36 0.002
GTP binding protein 2 NM_001145979 Gtpbp2 1.41 0.008
mitogen-activated protein kinase kinase kinase 5 NM_008580 Map3k5 1.51 0.005
SRY-box containing gene 4 NM_009238 Sox4 1.54 0.007
confirmed (Figure 2A). In addition, Olr1 deletion resulted in inhibition of key enzymes for lipogenesis (Figure 2B), including ATP citrate lyase (Acly), acetyl-Coenzyme A carboxylase alpha (Acaca), fatty acid synthase (Fasn), stearoyl-CoA Desaturase 1 (Scd1) and ELOVL family member 6 (Elovl6). It is of interest that none of the Olr1-sensitive lipid metabolism related genes carried NF-kB
binding sites in their promoters. This suggests that the effects of Olr1on lipogenesis may be independent from its NF-kB signaling
arm. On the other hand, several lipid metabolism transcription factors, including sterol regulatory element binding factor 2 (Srebf2), cAMP responsive element modulator (Crem), peroxisome proliferator activated receptors alpha and gamma (Ppara and Pparg), as well as CCAAT/enhancer binding protein (C/EBP) beta, were found to be downregulated in Olr1 KO mice (Figure 2B).
Effects ofOLR1overexpression in normal epithelial and cancer cells
Transfection of MCF10A and HCC1143 cells withOLR1 ex-pression vector resulted in 5 to 8-fold increase ofOLR1expression, which falls within the range OLR1 upregulation. In epithelial cells exposed to ox-LDL [18]. This led to modest upregulation ofRELA (p65) and significant increases in RNA message forBCL2, BCL2A1, TNFAIP3 and CCND2(Figure 3B). Compared to MCF10A cells, HCC1143 cells displayed increased basal levels of OLR1 (59%, p,0.05), FASN (24%, p,0.03), SCD1 (21%, p,0.01) and PLA2G4B (153%, p,0.01) (Figure 3C). The response from lipogenesis genes to OLR1 transfection varied in these cell lines (Figure 3D). In MCF10A cells, over-expression of OLR1 sig-nificantly stimulated transcription of SCD1 (37%, p,0.02), ELOVL6(38%, p,0.05) andPLA2G4B(153%, p,0.02) concom-itant with upregulation of CREM, whereas in HCC1143 cells CREM transcription declined and SCD1 and PLA2G4B were inhibited compared with control cultures transfected with empty vector.
Over-expression ofOLR1facilitates wound healing, but has no effect on adhesion
It has been reported that inhibition of OLR1 using siRNAs resulted in reduction of tumor growth in vivo and cancer cell
migration in vitro [14]. In order to evaluate effects of OLR1 upregulation, we transfected HCC1143 cells with either empty plasmid or OLR1 expression vector and tested migration in a wound healing assay (Figure 4A). Over-expression ofOLR1was confirmed using qPCR. Cells with upregulatedOLR1bridged the wounds much faster than control cultures (p,0.001). In contrast, adhesion and transendothelial migration of OLR1 transfected cancer cells did not differ from control values (not shown).
However, basal adhesion and transendothelial migration of non-transfected HCC1143 cells were significantly attenuated when OLR1 was inhibited or neutralized in endothelial cells using siRNA or pre-treating cells withOLR1neutralizing antibody (Figure 4BC).
Discussion
This study suggests multiple potential links betweenOLR1and susceptibility to cancer. First, the microarray database in the mice withOlr1abrogation exhibited a marked reduction in expression of NF-kB target genes involved in cellular transformation [14], as well as genes related to lipogenesis. Second, over-expression of OLR1in a human cancer cell line showed significant upregulation of several genes with oncogenic properties and a significant in-crease in cell migration.
Our microarray analysis showed that the vast majority of genes reported to be upregulated during cell transformation (but inhibited inOlr1KO mice) carried NF-kB binding sites in their promoters (Table 1). Furthermore, a significant portion of NF-kB target genes outside of the transformation-related pool, especially those involved in regulation of apoptosis, proliferation and migration, were also down-regulated in the Olr1 KO transcrip-tome (Table 2). In the mouseOlr1KO microarray, both B-cell leukemia/lymphoma 2 related protein A1 (Bcl2a1) andBcl2were transcriptionally inhibited. Bcl2a1 is an upstream negative reg-ulator of the mitochondriocentric mode of apoptosisviaprevention of cytochrome c release into the cytoplasm, which is required for initiation of the apoptotic cascade. It has been reported that enhanced synthesis ofBCL2A1 and BCL-XL are the underlying cause of about 1000-fold greater resistance of subsets of chronic lymphocytic leukemia cells [19]. TNFa-induced protein 3
(TNFAIP3) is a key regulator of inflammation and immunity Figure 1.Olr1 deletion results in broad inhibition of NF-kB target genes.A diagram depicting a set of overlapping genes between
transformation andOlr1KO transcriptomes. From the set of 238 genes upregulated during transformation, 26 genes were found to be inhibited in
Olr1KO mice. Vast majority of these genes carried NF-kB sites in their proximal promoter sequences. In total, 86 NF-kB target genes were found to be
inhibited inOlr1KO mice with enrichment for regulation of apoptosis (p = 0.0002), proliferation (p = 0.00003), wound healing (p = 0.0002), defense response (p = 0.0011), immune response (p = 0.0003) and cell migration (p = 0.0009).
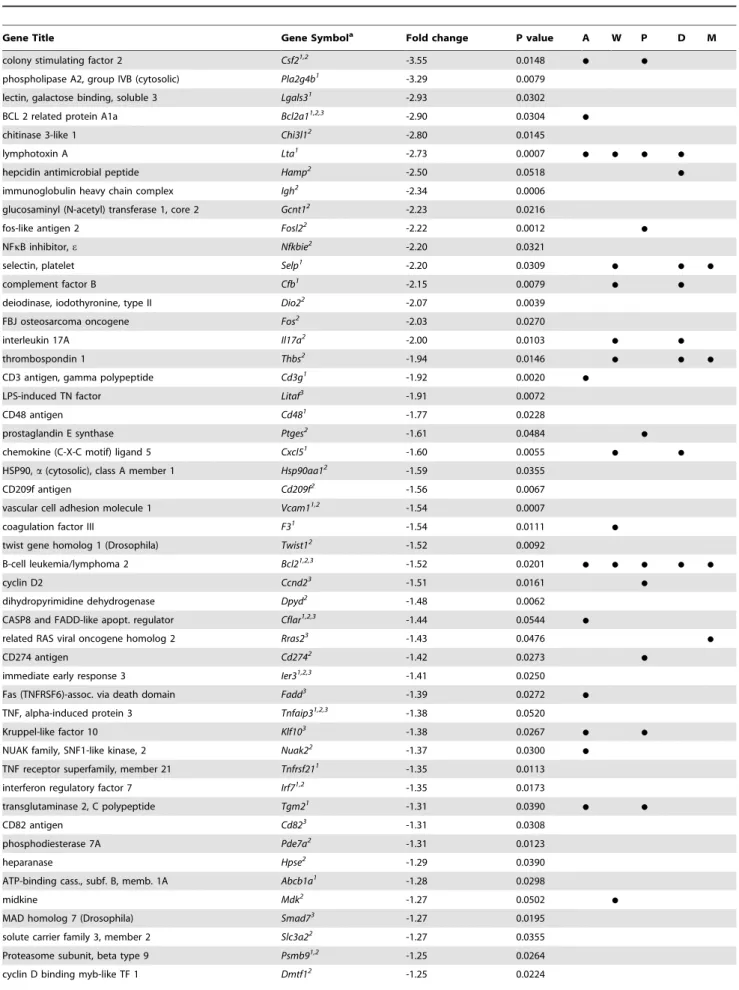
Table 2.NF-kB target genes outside of transformation pool significantly inhibited in Olr1 knockout mice (more than 1.2-fold).
Gene Title Gene Symbola Fold change P value A W P D M
colony stimulating factor 2 Csf21,2 -3.55 0.0148 à à
phospholipase A2, group IVB (cytosolic) Pla2g4b1 -3.29 0.0079
lectin, galactose binding, soluble 3 Lgals31 -2.93 0.0302
BCL 2 related protein A1a Bcl2a11,2,3 -2.90 0.0304 à
chitinase 3-like 1 Chi3l12 -2.80 0.0145
lymphotoxin A Lta1 -2.73 0.0007 à à à à
hepcidin antimicrobial peptide Hamp2 -2.50 0.0518 à
immunoglobulin heavy chain complex Igh2 -2.34 0.0006
glucosaminyl (N-acetyl) transferase 1, core 2 Gcnt12 -2.23 0.0216
fos-like antigen 2 Fosl22 -2.22 0.0012 à
NFkB inhibitor,e Nfkbie2 -2.20 0.0321
selectin, platelet Selp1 -2.20 0.0309 à à à
complement factor B Cfb1 -2.15 0.0079 à à
deiodinase, iodothyronine, type II Dio22 -2.07 0.0039
FBJ osteosarcoma oncogene Fos2 -2.03 0.0270
interleukin 17A Il17a2 -2.00 0.0103
à à
thrombospondin 1 Thbs2 -1.94 0.0146 à à à
CD3 antigen, gamma polypeptide Cd3g1 -1.92 0.0020 à
LPS-induced TN factor Litaf3 -1.91 0.0072
CD48 antigen Cd481 -1.77 0.0228
prostaglandin E synthase Ptges2 -1.61 0.0484 à
chemokine (C-X-C motif) ligand 5 Cxcl51 -1.60 0.0055 à à
HSP90,a(cytosolic), class A member 1 Hsp90aa12 -1.59 0.0355
CD209f antigen Cd209f2 -1.56 0.0067
vascular cell adhesion molecule 1 Vcam11,2 -1.54 0.0007
coagulation factor III F31 -1.54 0.0111 à
twist gene homolog 1 (Drosophila) Twist12 -1.52 0.0092
B-cell leukemia/lymphoma 2 Bcl21,2,3 -1.52 0.0201 à à à à à
cyclin D2 Ccnd23 -1.51 0.0161 à
dihydropyrimidine dehydrogenase Dpyd2 -1.48 0.0062
CASP8 and FADD-like apopt. regulator Cflar1,2,3 -1.44 0.0544 à
related RAS viral oncogene homolog 2 Rras23 -1.43 0.0476 à
CD274 antigen Cd2742 -1.42 0.0273 à
immediate early response 3 Ier31,2,3 -1.41 0.0250
Fas (TNFRSF6)-assoc. via death domain Fadd3 -1.39 0.0272 à
TNF, alpha-induced protein 3 Tnfaip31,2,3 -1.38 0.0520
Kruppel-like factor 10 Klf103 -1.38 0.0267 à à
NUAK family, SNF1-like kinase, 2 Nuak22 -1.37 0.0300 à
TNF receptor superfamily, member 21 Tnfrsf211 -1.35 0.0113
interferon regulatory factor 7 Irf71,2 -1.35 0.0173
transglutaminase 2, C polypeptide Tgm21 -1.31 0.0390 à à
CD82 antigen Cd823 -1.31 0.0308
phosphodiesterase 7A Pde7a2 -1.31 0.0123
heparanase Hpse2 -1.29 0.0390
ATP-binding cass., subf. B, memb. 1A Abcb1a1 -1.28 0.0298
midkine Mdk2 -1.27 0.0502 à
MAD homolog 7 (Drosophila) Smad73 -1.27 0.0195
solute carrier family 3, member 2 Slc3a22 -1.27 0.0355
Proteasome subunit, beta type 9 Psmb91,2 -1.25 0.0264
involved in the development of various autoimmune diseases and it also desensitizes cells from TNFa-induced cytotoxicity and was
shown to be anti-apoptotic in breast cancer MCF7S1 cells [20]. Inhibition ofTNFAIP3compromises growth and survival of glio-blastoma stem cellsviainhibition of cell cycle progression and
NF-kB activity, and increases survival of mice bearing glioblastome
xenografts [21].
We observed a significant reduction ofCcnd2 message inOlr1 KO mice and its multi-fold upregulation in OLR1 transgenic HCC1143 cells. Cyclin D2 is a highly conserved regulator of cyclin-dependent kinases 4 and 6 responsible for of G1/S transition. This gene is epigenetically silenced in the majority of breast cancers [22]. Its overexpression in LNCaP cells results in an impediment to
proliferation and increased apoptosis [23]. In addition, Olr1 deletion appeared to compromise the entire technological chain ofde novolipogenesis, including synthesis of saturated C16 and C18 fatty acids (Fasn and Elovl6), and their conversion into MUFAs (Scd1). Many cancers, including those involving prostate and breast [24,25], rely almost exclusively onde novo synthesis regardless of nutritional availability. The switch tode novolipogenesis occurs early and is a prerequisite for efficient transformation. Novel effects of OLR1on lipid metabolism could account for much of its reported pro-oncogenic activity. For example, the expression level ofFASN positively correlates with poor cancer prognosis [26], its genomic amplification is a common occurrence in some cancers [27], and its over-expression promotes transformation of epithelial cells [28].
Gene Title Gene Symbola Fold change P value A W P D M
beta-2 microglobulin B2m1,2 -1.24 0.0007 à
adenosine A1 receptor Adora11 -1.23 0.0215 à à à
nuclear receptor subf. 3, gr. C, member 1 Nr3c12 -1.22 0.0540 à
platelet derived GF, B polypeptide Pdgfb1,2 -1.22 0.0152 à à
cAMP responsive element bind. protein 3 Creb32 -1.21 0.0306
Legend: (a)- a list of NFkB target genes was compiled from the following web-based databases: 1 - http://bioinfo.lifl.fr/NF-KB/; 2 -http://people.bu.edu/gilmore/nf-kb/
target/index.html#cyto; and 3 - http://www.broadinstitute.org/mpr/publications/ projects/Lymphoma/ FF_NFKB_suppl_ revised. pdf. The genes whose expression was significantly altered by OLR1 deletion was analyzed for enrichment themes using DAVID bioinformatic database. The enriched themes included regulation of apoptosis, ‘‘A’’; Wound healing,‘‘W’’; Cell proliferation, ‘‘P’’; Defense response,‘‘D’’; Cell migration, ‘‘M’’.
doi:10.1371/journal.pone.0020277.t002 Table 2.Cont.
Figure 2. qPCR validation of microarray data. A. qPCR validation of select genes from overlapping set (from Table 1);B.Expression of lipogenesis genes and transcription factors inolr1KO mice. White bars – microarray data; black bars – qPCR data. All P values,0.05.
Similarly, over-expression of SCD1 has been observed in several types of cancers, including mammary cancer [29]; its upregulation is associated with transformation and its knock-down results in decreased cell proliferation, a loss of anchorage-independent growth and impaired apoptosis [30]. It is of note that compared to MCF10A cells, over-expression ofOLR1in HCC1143 cells did not evoke the expected activation of lipogenesis genes. This may be explained by maximally increased basal expression of these genes in HCC1143 cells at baseline (Figure 3D).
As most of the genes upregulated inOLR1-TG HCC1143 cells are functionally pleiotropic, we evaluated the cumulative outcome of their upregulation on wound healing, adhesion and transen-dothelial migration assays (Figure 4). Notably, the migration of cells was seen to almost double the control value in cells with over-expression ofOLR1, strongly suggesting a role for this molecule in breast cancer growth. On the other hand, presentation ofOLR1on the surface of cancer cells did not seem to be essential for adhesion to activated endothelial cells or for transendothelial migration. The level of OLR1 in endothelial cells, however, appears to be important, as addition of neutralizing OLR1 antibody to the medium or inhibition of OLR1 transcription significantly im-paired adhesion and transendothelial migration in non-transfected cancer cells. This is indicative ofOLR1as a possible mechanism of cancer cell-endothelium interactions, as tumor cells are
charac-terized by abundance of OLR1 ligand phophatidylserine on the cellular membranes [31].
In summary, our data from multiple approaches in transgenic mice and human normal epithelial and cancer cell lines suggest that OLR1 has several pro-oncogenic actions based on: a) activation of NF-kB signaling pathway resulting in inhibition of
apoptosis and stimulation of proliferation; b) activation of de novo lipogenesis, and c) more efficient adhesion and transendothelial migration due to upregulation of OLR1 in endothelium. We believe these data strongly suggest thatOLR1 may function as a link between obesity and susceptibility to breast cancer.
Materials and Methods
Animals
C57BL/6 mice were obtained from Jackson Laboratories. The homozygous Olr1 KO mice were developed on C57BL/6 background as described previously [17]. The Olr1 KO mice showed total absence of Olr1 as determined by RT PCR and immunostaining, and the binding of oxLDL to the vascular intima was completely absent in these animals. All animals received humane care in compliance with the Public Health Service Policy on Humane Care and Use of Laboratory Animals published by the National Institutes of Health. The present studies were Figure 3. Effects ofOLR1overexpression on transcription of genes involved in apoptosis, proliferation and lipogenesis in MCF10a and HCC1143 cells.These cells were transfected with either empty vector orOLR1cDNA (Origene, Rockville, MD) using Lipofectamine 2000 (Invitrogen). Transfection efficiency (70–80%) was evaluated using GFP vector. RNA was extracted 48 hours post-transfection, converted into cDNA and the expression of genes was determined by quantitative PCR.A.Efficiency of transfection (cells transfected with GFP vector).B.Quantitative PCR plot. Note the enhancement of OLR1 expression in both control and OLR1-transfected cultures in response to ox-LDL.C.Expression of genes involved in apoptosis and proliferation. In order to stimulateOLR1associated signaling requiring OLR1-ligand interaction,OLR1transfected cells were treated with 40mg/ml ox-LDL for 24 hours; graphs represent comparison with untreated control cells transfected with empty vector; D.Basal
expression ofOLR1,PLA2G4Band lipogenesis genes in normal human mammary epithelial cells (MCF10A) and breast cancer cells (HCC1143);E.
approved by UAMS Animal Care and Usage Committee approval number 2484, dated November 2007.
Microarray Analysis
Total RNA of heart was extracted from WT mice andOlr1KO mice. Microarray analysis was performed by Affymetrix Mouse Genome GenChip 430 2.0 gene expression array (Affymetrix Inc. Santa Clara, CA) and analyzed using Affymetrix Microarray Analysis Suite (MAS) 5.0 to assess the quality of RNA and hybridization. A log base 2 transformation was applied to the data before the arrays were normalized. All values from each array were normalized to the 75th percentile value of the array, which was arbitrarily set at intensity minimum .100. For gene ex-pression annotation, EASE (as described in http://apps1.niaid. nih.gov/David) analysis was performed on significant genes identified by one sample t-test. In addition, Gene Ontology (GO) terms http://www.geneontology.org) for biological processes and cellular component were identified as proposed by the GO Consortium. All microarray data is MIAME compliant and that the raw data has been deposited in a MIAME compliant database (ArrayExpress) as detailed on the MGED Society website http:// www.mged.org/Workgroups/MIAME/miame.html (accession number E-MTAB-473).
Reagents and cell lines
All reagents, unless stated otherwise, were purchased from Sigma (St. Louis, MO). Human breast cancer cell line HCC1143 was a kind gift of Dr. A. Basnakian (University of Arkansas for Medical Sciences, Little Rock AR). Mammalian expression vector (pCMV5-XL5) with human OLR1 cDNA were obtained from Origene (Rockville, MD). Silencer Select Validated siRNA to
OLR1 (s9843) was purchased from Invitrogen (Carlsbad, CA). Cells were cultured using standard RPMI 1640 growth medium supplemented with fetal bovine serum (10%) and ampicillin/ streptomycin. High TBAR ox-LDL (90 nmoles MDA/mg Protein) was purchased from Biomedical Technologies Inc. (Stoughton, MA). Human IgG was purchased from Abcam (Cambridge, MA).
Real-Time Quantitative PCR
Cells were transfected with either empty vector or OLR1 expression vector. The efficiency of transfection was confirmed in parallel experiments with GFP carrying plasmid. Part of the transfected cultures (all in triplicates) was treated with oxLDL (40mg/ml) for 24 hours before harvesting and RNA extraction.
RT qPCR was performed using the Applied Biosystems 7900 real-time PCR system. qPCR specific primers were designed using Probe-Finder (http://www.roche-appliedscience.com) web-based software. All qPCR reactions were carried out in a final volume of 15ml containing 16of SYBR Green PCR Master Mix (Applied Biosystems, Carlsbad, CA), 300 nM of each gene specific primers, 100 ng cDNA, in sterile deionized water. The standard cycling condition was 50uC for 2 min, 90uC for 10 min, followed by 40 cycles of 95uC for 15 s and 62uC for 1 min. The results were analyzed using SDS 2.3 relative quantification manager software. The comparative threshold cycles values were normalized for GAPDH reference genes. qPCR was performed in triplicate to ensure quantitative accuracy.
Transfection protocol
Cells were transfected with either empty vector orOLR1cDNA constructs (Origene, Rockville, MD) using lipofectamine 2000 Figure 4. Phenotypic consequences ofOLR1 overexpression or inhibition. A.Wound healing assay. Upper panel - representative images of wound healing assay performed using HCC1143 cells transfected with either empty plasmid orOLR1cDNA vector; Lower panel – graph depicting the distance between edges of the wound after 36 hours of incubation. (*) – p,0.01;B.Adhesion assay. Upper panel- representative images of adherent non-transfected HCC1143 cells loaded with CellTracker Red CMTX (Invitrogen, Carlbad, CA) and applied to non-activated or activated (50mg/ml
oxLDL, 4 hrs) confluent HUVECs transfected with OLR1 Silencer or scrambled siRNA. Lower panel - graph depicting the number of adherent cells averaged from multiple fields of view in triplicate cultures. (*) – p,0.05 compared to non-activated control (‘‘scrRNA’’); ({) - p,0.05 compared to scrambled RNA;C.Colorimetric transendothelial migration assay. Upper panel – verification of the confluence of HUVECs on the membranes by staining cells with CellTracker Red CMTX. Lower panel – absorbance values of stain extracted from the cells migrated through TNFa-activated
(Invitrogen, Carlsbad, CA) in accordance with manufacturer’s instructions with minor modifications. In preliminary experiments, we determined that higher transfection efficiency is achieved by applying a 2:1 ratio of DNA to lipofectamine in relation to the proposed concentration of DNA recommended in the general protocol. Using these conditions, we routinely observed 70–80% transfection efficiency. Transfection of HUVECs with OLR1 Silencer (s9843) or scrambled siRNA (Invitrogen, Carlsbad, CA) was carried out using lipofectamine 2000 according to manufac-turer’s instructions. Cells we used in adhesion experiments 48 hours post-transfection and inhibition of OLR1 transcription was verified by quantitative RT PCR.
Wound healing assay
Wound healing assay was performed to determine cell mi-gration, according to the following protocol: Cells were cultured to confluence in 24-well plates, and two separate scratch wounds were made in every well using a sterile 200ml pipette tip. Cells
lifted in the process of scratching were gently removed by washing in PBS, then fresh growth medium was added. Pictures were taken at 106magnification every 12 hours and the final picture after 36 hours of incubation was taken after loading the cells with calcein AM (Invitrogen, Carlsbad, CA).
Adhesion assay
Human umbilical vein endothelial cells (HUVECs) were grown to confluence in 12-well plates and activated by exposure to oxLDL (50mg/ml) for 4 hrs. Breast cancer cells HCC1143 were
labeled with CellTracker Red CMTX (Invitrogen, Carlsbad, CA)
according to manufacturer’s instructions and added on to endo-thelial monolayer at concentration of 105cells per well. Plates were incubated for 1 hour in a CO2incubator and then gently washed 3 times with growth medium to remove non-adherent cells. The number of cells attached to endothelium was counted in several fields of view in triplicate cultures using fluorescent microscope.
Colorimetric transendothelial migration assay
The transmigration potential of HCC1143 cells was evaluated using QCM Tumor Cell Transendothelial Migration Assay (Millipore, Billerica, MA) according to manufacturer’s instruc-tions. Briefly, HUVECs were seeded on fibronectin-coated cell culture inserts at high density (pore size 8mm), cultured until reaching 100% confluence and activated by exposure to 20 ng/ml TNFa.overnight. Breast cancer cells HCC1143 were added.
(16105 per insert) to the monolayer and incubated in the cell incubator for 6 hours. Upon completion of the incubation period, growth medium and cells were gently swabbed from the interior of inserts The extent of transmigration was evaluated by measuring the amount of stain extracted from transmigrated cells on the outer surface of the membrane (absorbance at 570 nm) using a plate reader.
Author Contributions
Conceived and designed the experiments: JLM SK MK GN. Performed the experiments: MK SM XW. Analyzed the data: VR MW MK VR WC. Contributed reagents/materials/analysis tools: JLM MK. Wrote the paper: MK JLM. Conducted microarray studies: B-YK.
References
1. Xie Q, Matsunaga S, Niimi S, Ogawa S, Tokuyasu K, et al. (2004) Human lectin-like oxidized low-density lipoprotein receptor-1 functions as a dimer in living cells. DNA Cell Biol 23: 111–117.
2. Mehta JL, Chen J, Hermonat PL, Romeo F, Novelli G (2006) Lectin-like oxidized low- Density lipoprotein receptor-1 (OLR1): A critical player in the development of atherosclerosis and related disorders. Cardiovasc Res 69: 36–45. 3. Yamanaka S, Zhang XY, Miura K, Kim S, Iwao H (1998) The human gene encoding the lectin-type oxidized LDL receptor (OLR1) is a novel member of the natural killer gene complex with a unique expression profile. Genomics 1998;54: 191–199.
4. Li D, Mehta JL (1998) Ox-LDL induces apoptosis in human coronary artery endothelial cells: role of PKC, PTK, bcl-2, and Fas. Am J Physiol 275: H568–H576.
5. Li D, Saldeen T, Romeo F, Mehta JL (2000) Oxidized LDL upregulates angiotensin II type 1 receptor expression in cultured human coronary artery endothelial cells: the potential role of transcription factor NF-kappaB. Circulation 102: 1970–1976.
6. Chen M, Kakutani M, Minami MM, Kataoka H, Kume N, et al. (2000) Increased expression of lectin-like oxidized low density lipoprotein receptor-1 in initial atherosclerotic lesions of Watanabe Heritable Hyperlipidemic rabbits. Arterioscler Thromb Vasc Biol 20: 1107–1115.
7. Mehta JL, Sanada N, Hu CP, Chen J, Dandapat A, et al. (2007) Deletion of OLR1 reduces atherogenesis in LDLR knockout mice fed high cholesterol diet. Circ Res 100: 1634–1642.
8. Hu C, Dandapat A, Sun L, Marwali MR, Inoue N, et al. (2008) Modulation of angiotensin II-mediated hypertension and cardiac remodeling by OLR1 deletion. Hypertension 52: 552–562.
9. Hu C, Chen J, Dandapat A, Fujita Y, Inoue N, et al. (2008) OLR1 abrogation reduces myocardial ischemia-reperfusion injury in mice. J Mol Cell Cardiol 44: 76–83.
10. Mathieu P, Lemieux I, Despre´s JP (2010) Obesity, inflammation, and cardiovascular risk. Clin Pharmacol Ther 2010;87: 407–16.
11. Brinkley TE, Kume N, Mitsuoka H, Phares DA, Hagberg J (2008) Elevated soluble lectin-like oxidized LDL receptor-1 (sOLR1) levels in obese postmen-opausal women. Obesity (Silver Spring) 16: 1454–1456.
12. Cleary MP, Grossmann ME, Ray A (2010) Effect of obesity on breast cancer development. Vet Pathol 2010;47: 202–213.
13. Romieu I, Lajous M (2009) The role of obesity, physical activity and dietary factors on the risk for breast cancer: Mexican experience. Salud Publica Mex 51 Suppl 2: s172–180.
14. Hirsch HA, Iliopoulos D, Joshi A, Zhang Y, Jaeger S, et al. (2010) Transcriptional signature and common gene networks link cancer with lipid metabolism and diverse human diseases. Cancer Cell 2010;17: 348–361. 15. Kang BY, Hu C, Ryu S, Khan JA, Biancolell, et al. (2010) Genomics of cardiac
remodeling in angiotensin II-treated wildtype and OLR1-deficient mice. Physiol Genomics 42: 42–54.
16. Zambelli F, Pesole G, Pavesi G (2009) Pscan. Finding over-represented transcription factor binding site motifs in sequences from regulated or co-expressed genes. Nucleic Acids Res 37: W247–W252.
17. Huang DW, Sherman BT, Lempicki RA (2009) Systematic and integrative analysis of large gene lists using DAVID Bioinformatics Resources. Nature Protoc 4: 44–57.
18. Wang R, Ding G, Liang W, Chen C, Yang H (2010) Role of LOX-1 and ROS in oxidized low-density lipoprotein induced epithelial-mesenchymal transition of NRK52E_Lipids Health Dis 9: 120.
19. Vogler M, Butterworth M, Majid A, Walewska RJ, Sun, et al. (2009) Concurrent up-regulation of BCL-XL and BCL2A1 induces approximately 1000-fold resistance to ABT- 737 in chronic lymphocytic leukemia. Blood 2009;113: 4403–4413. 20. Ja¨a¨ttela¨ M, Mouritzen H, Elling F, Bastholm L (1996) A20 zinc finger protein
inhibits TNF and IL-1 signaling. J Immunol 1996;156: 1166–1173. 21. Hjelmeland AB, Wu Q, Wickman S, Eyler C, Heddlest, et al. (2010) Targeting
A20 decreases glioma stem cell survival and tumor growth. PLoS Biol 8: e1000319.
22. Evron E, Umbricht CB, Korz D, Raman V, Loeb, et al. (2001) Loss of cyclin D2 expression in the majority of breast cancers is associated with promoter hypermethylation. Cancer Res 61: 2782–2787.
23. Kobayashi T, Nakamura E, Shimizu Y (2009) Restoration of cyclin D2 has an inhibitory potential on the proliferation of LNCaP cells. Biochem Biophys Res Commun 387: 196–201.
24. Yang YA, Morin PJ, Han WF, Chen T, Bornman DM, et al. (2003) Regulation of fatty acid synthase expression in breast cancer by sterol regulatory element binding protein-1c. Exp Cell Res 2003;282: 132–137.
25. Baron A, Migita T, Tang D, Loda M (2004) Fatty acid synthase: a metabolic oncogene in prostate cancer? J Cell Biochem 2004;91: 47–53.
26. Alo’ PL, Visca P, Marci A, Mangoni A, Botti C, et al. (1996) Expression of fatty acid synthase (FAS) as a predictor of recurrence in stage I breast carcinoma patients. Cancer 77: 474–482.
28. Migita T, Ruiz S, Fornari A, Fiorentino M, Priolo, et al. (2009) Fatty acid synthase: a metabolic enzyme and candidate oncogene in prostate cancer. J Natl Cancer Inst 101: 519–532.
29. Li J, Ding SF, Habib NA, Fermor BF, Wood CB, et al. (1994) Partial characterization of a cDNA for human stearoyl-CoA desaturase and changes in its mRNA expression in some normal and malignant tissues. Int J Cancer 57: 348–352.
30. Fritz V, Benfodda Z, Rodier G, Henriquet C, Iborra F, et al. (2010) Abrogation of de novo lipogenesis by stearoyl-CoA desaturase 1 inhibition interferes with oncogenic signaling and blocks prostate cancer progression in mice. Mol Cancer Ther 9: 1740–1754.