Does the Electoral Rule Matter for Political
Polarization? The Case of Brazilian Legislative Chambers
*Rodolpho Bernabel
New York University, United StatesThis study explores the effects of electoral rules on
political polarization in the legislative branch of government.
Since in Brazil the districts are also the states, and senators are
chosen according to the plurality-majority rule while
representatives are determined by a proportional rule, the
comparison between legislative chambers enables one to test
whether the plurality-majority rule induces politicians to behave
less moderately, and whether the proportional rule has the
opposite effect. To estimate these effects, roll call data from 1988
to 2010 was analyzed and legislators' ideal points were estimated
using WNOMINATE. Evidence in favor of the hypothesis was found, although not in every circumstance.
Keywords: Polarization; electoral rules; roll call vote;
Wnominate.
* http://dx.doi.org/10.1590/1981-38212014000200012
For replication, see bpsr.org.br/files/arquivos/Dataset_Bernabel.html
his article explores the influence that particular electoral rules may
have on political polarization. More specifically, the polarization in the
legislative chambers, measured by the way legislators vote in roll calls. In this
paper, I will explore how two different vote-counting rules affect the relationship
between legislators and their parties. This relationship is understood by the
concept of polarization. When the members of one party vote in one way and those
of the other party vote in another way, and if this behavior is observed most of the
time, then these two parties can be described as polarized. In a roll call vote, a
legislator can either cast a "yea" or a "nay" vote. As this procedure is done
repeatedly in one legislature, we can measure how similar, aggregated, or even
polarized, are the members of two or more distinct parties. There can be many
causes of polarization. In McCarty, Poole and Rosenthal (2006), the authors argue
that income, immigration, and campaign finance affect polarization. Here I am
going to argue that the method of counting the votes by which a legislator is
elected can also have an effect on polarization. The relevance of such a study
becomes noticeable when there is a redesign or reformation of an electoral system,
to identify the practical consequences of different electoral rules. The seminal
work on the topic is Duverger (1957), in which the author shows that a
plurality-majority rule leads to political systems with two parties, whereas a proportional
rule enables multi-party systems to continue their existence. However, the
relationship between electoral rule and legislative behavior has not yet been fully
scrutinized. If a plurality-majority rule leads to a less fragmented party system, it is
reasonable to expect that the legislators of a party would behave in a more loyal
way. This hypothesis is investigated in this paper.
Electoral rules are frequently analyzed with regard to their normative
features, such as representativity and rationality. However, it is important to
understand the practical consequences that a rule may have such as political
polarization. The Brazilian case studied here is helpful to test the effect of two
electoral rules on political polarization; plurality-majority and proportional rules.
This paper will show that the members of Congress elected through the
plurality-majority rule behave more extremely than those elected via the proportional rule,
i.e., they vote more often with their party. As will be explained presently, the
different electoral rules in Brazil take the same district and transform it into either
a single or multi-member district.
The study of polarization in the U.S. Congress has gained scientific rigor
with both the application of spatial models and the empirical estimation of
ideology using large data sets. This confluence resulted in the ubiquitous mode of
analysis enabled by algorithms like NOMINATE and Optimal Classification. In this study, an extension of NOMINATE called WNOMINATE is used. WNOMINATE takes the roll call records of legislators and two policy dimensions as input, calculates
their proximity to each other, and returns the position of legislators in the policy
space spanned by those dimensions. The two dimensions are fiscal and social ones,
and they are constrained by the unit Euclidean circle. The algorithm normalizes
the positions such that politicians that are conservative in both fiscal and social
issues receive coordinates on the positive orthant. History, detailed theoretical
explanation, as well as the application of this methodology to American Politics can
be found in Rosenthal and Poole (2007) and McCarty, Poole and Rosenthal
(2006)1.
The U.S. Congress presents an added difficulty when comparing chambers
though; the pool from which the subjects are drawn differs between the House and
the Senate. The members of the House are selected from smaller districts, while
members of the Senate come from the states. This is not the case with Brazil's
Congress, and this feature is explored in this paper. Brazilian legislative elections
on the federal level provide me with an institutional design well-suited to test the
effects of two electoral rules on political polarization, namely the
plurality-majority and proportional rules. The electoral features that enable this test to
occur are: first, and most important, each state covers a single district only and
there is no further division within it; and second, the electoral rules differ from one
chamber to the other. Hence, the same district can be a single-member district in
the Senate's case, and a multi-member district in the House's case.
1 Further theoretical and empirical developments about the U.S. Congress and American
Literature Review
The first two pieces of work on polarization were Rosenthal and Poole
(1984), which looks into interest groups' classifications of legislator behavior, and
Rosenthal and Poole (1985), which stated the use of roll call data directly via
NOMINATE. The seminal work in polarization literature is Rosenthal and Poole (1997), revised as Rosenthal and Poole (2007). In this book the authors seek to
understand the structure of congressional voting in the U.S., and to explain the
political realignment in American history. The impact of committees and interest
groups are also investigated. The main finding of this research is that American
politics have had alternate times of polarization in the past, but that a strong and
increasing polarization pattern has arisen in the last few decades. Among the
exogenous causes of this phenomenon are income inequality and immigration. A
study that claims different findings on polarization of American politics is Evans
(2003). The author uses alternative statistical methods, along with survey data, to
argue that American voters are not as polarized as legislators when it comes to
economic issues, but the polarization of voters on moral issues is increasing2.
In the present study I do not necessarily have the American case in mind,
as I seek to unravel the existence of an institutional cause of polarization. My
research approach is reversed; I posit an institutional cause of polarization and
look for an empirical validation of the hypothesis. Also, I am interested in the
behavior of the legislators only, and not of the voters. One previous study that links
electoral rules and legislative behavior is Carrol and Eichorst (2013), where the
authors show that the greater the competition, the higher the predictability of
legislators' behavior. The findings in my study however could have arisen
independent of the relationship in Carrol and Eichorst (2013). This is because it is
possible to have electoral competition independent of the electoral rule.
Admittedly and intuitively, one should expect greater competition correlating with
greater number of parties, but this relation can be upside down. If there are two
strong parties and no others, there must be more competition than a situation with
one strong party and many electorally insignificant ones.
2 Another different way of investigating polarization of legislators is via discourse and
The methodological foundations of the polarization research borrowed the
Item Response Theory (IRT) from Psychology. In comparing attitudes among
individuals towards similar questions, IRT provided a way of not only ordering
subjects by their abilities or preferences, but also measuring the distance among
those subjects. What political science researchers began to do then was to apply
the IRT methodology to analyze and quantify ideological mappings, in Congress
and Executive branches3, first through the use of interest groups' ratings of
politicians, and later through the use of roll call data via NOMINATE. (POOLE, 2005) provides technical work on this issue4. Here I use roll call data, which has
become the standard way of investigating ideological mappings, for it is much
more objective than interest groups' evaluations. An introductory tutorial of the
methodology utilized in the classification of legislators using roll call data is
Wiseman, Everson and Valelly (2008/2009), while Poole (1998) provides an
intellectual—and as non-technical as it can ever be—recount of the origin and
development of the NOMINATE family of methods. There remains only a few studies dealing with the topic of polarization in Brazilian politics. Leoni (2002) was
the first study to bring the NOMINATE technology to Brazilian politics. The article describes the ideological map of parties in the House and the first three presidents
after redemocratization, covering the 1991–1998 period. His results are in favor of
a low dimensionality with the left-right spectrum explaining most of the legislative
behavior. Morgenstern (2004) looks at the period from 1995 to 1998 and argues
that the Congress has more power than the President when it comes to
law-making. Desposato (2006b) studies the same legislatures as Morgenstern, but to
test a party-switching model.
Zucco Jr. and Lauderdale (2011) use survey data to correct ideological
mappings using roll call data, and find that there also exists a
government-opposition cleavage in Brazilian congress, apart from the left-right dispute. Our
research will encompass this issue when dealing with coalitions instead of parties.
Desposato and Cunow (2011) use campaign contributions for the 2010
3 For the classification of the Judiciary branch see Bailey (2007).
4 It is noteworthy that all this literature has relied on the assumption that the appropriate
distance to study decision theory is the Euclidean one. In Eguia (2012), the author claims that the Minkowski distance with � = 1 is better suited to describe utility functions. Let the vectors , ∈ ℝ� represent the ideal points of legislators 1 and 2; the Minkowski
presidential, gubernatorial, and congressional elections to estimate ideal points in
Brazil. Their approach enables them to also grasp the ideology of the candidates
who lost in the elections. They find mixed evidence of the impact of electoral rules
on polarization. The first attempt to investigate the effect of electoral rules on
polarization in Brazil was Desposato (2006a). In this study, the author uses a
dispersion model to assess the legislators' behaviors on the Senate and the House.
He finds no evidence of any impact of electoral rules on dispersion of legislatives of
the same party, but only three legislatures were analyzed. This paper attempts to
improve on that study by analyzing all the first six legislatures in the democratic
period, and also by taking the coalitions into consideration. Mixed evidence of any
impact of electoral rules on polarization is found. In Poole (2003) the author
argues that Congress members in the U.S. die with their ideological boot on, i.e.,
once in office, they tend to remain close to their original ideological position
throughout time. A similar study in the Brazilian case is yet to be done. Another
possible research topic is to compare the polarization of legislators in state
chambers with the ones in the federal chamber. A study of the polarization of state
legislators in American states is Shor and McCarty (2011), one that could also be
replicated for the Brazilian case.
Electoral Rules and Polarization
The Brazilian political system is more similar to the American one than to
most of those in Europe, in that the presidential elections are separated from the
congressional ones5. With regards to congressional elections though, Brazilian
electoral rules vary according to the chamber. In Brazil, the district from which the
representatives are elected is the same political territory as the state from which
the senators are elected. In other words, the states are the districts. But in the
elections to the Senate the plurality-majority rule is used, which means that the
candidate with more votes is elected, as in a single-member district6. In the
elections for the House, however, a proportional rule is used, i.e., the state becomes
5 For a different opinion about the similitudes and differences among the Brazilian,the
American and the European systems see Limongi (2006).
6 When there are two Senate seats in dispute we must call it a two-member district.
a multi-member district, and thence the representatives of that district, or state,
are elected in accordance with the proportion of votes their parties receive7.
The assignment to either one of the candidacies is a joint decision made by
the candidate and the party; nonetheless, the party has the final authority in determining who runs for the office. From the candidate’s point of view, there could exist a self-selection problem if either one of the offices was a better position
than the other, as all candidates would want to run for that best position. From the
party's perspective, however, a candidate should be assigned to an office according
to his or her chances of winning the election, and their prospective behavior
during incumbency. These issues are explored below in greater detail.
The Senate office is usually considered as a better position than the one in
the House. Arguments in the favor of that are, first, the fact that the mandate is for
eight years, compared with the four-year term in the House; and second, the total
number of senators is less than 16% of the number of representatives, thus the
senators' vote on a bill will likely be much more valuable. While there is no
discrepancy between salaries, the senators do enjoy a larger sum of money to
spend8.
However, it is more difficult to obtain the party's nomination to run for the
Senate, for there are only one or two seats per state per election, depending on the
election year—every four years, either one-third or two-thirds of the Senate seats
are open. In the House, all seats open every four years, and the seats per district
vary from 08 to 70. These numbers follow a distorted proportionality with regard
to the states' populations9. Furthermore, each party can launch only one candidate
7 In Brazil the system is that of an open list, in which the voter votes for the party, but can
also vote for a particular candidate on the list, determining then the final ordering. The other proportional rule system is that of a closed list, in which the party orders the candidates and the voter cannot cast a vote for a particular member of that list; more precisely, the voter does not influence the final ordering.
8 This, and other information about the costs of Brazilian government, in all three branches in the federal level, can be found in www.transparencia.org.
9 Although somewhat proportional, seats per state are limited from below by eight, and
per seat for the Senate, but 50% more candidates than the number of seats for the
House. Re-election works exactly as in the Senate, i.e., the incumbents can remain in office for an undetermined number of terms.
Moreover, there is one feature that has not been taken into consideration
in this discussion; the ability to vote with the party. Note that for a politician who is
not a head of a party, his or her power in determining the party's agenda is small.
Therefore, if the politician's policy preferences are not exactly the same as the
party ones, there will be a cost, in terms of effort, for the politician to support the
party's exact agenda. The partisan behavior then will be a function of the distance
between the politician and the party, and the value he places in policy and
office-holding. If someone places more value in the office than in the policy, then it will be
easier for him or her to follow the party, holding fixed the ideological distance
between the party and the politician. Conversely, if the value placed in the office is
held fixed, then the closer the party and politician are ideologically, the easier for
him to vote with the party. This will be an important issue, as we will see presently,
for the party will expect a "better" behavior from the senators than from the
members of the House.
Hence, when a politician is deciding on the type of nomination to procure,
it is not clear whether the present expected value of a seat in the Senate is always
greater than a seat in the House, i.e., whether it is the case that for every politician it is better to try to run for the Senate than the House10. As I will show presently,
Mignozzetti, Bernabel and Gaudino (2011). In this work a Monte Carlo simulation was run using WNOMINATE estimates, where the representational proportions were corrected and the new seats were filled with the proportions each party had previously. The malaportionment might affect policy-making but the effect is mediated by a correlation between state and popular vote for the parties.
10 This cost/benefit relation is then blurred because the problem is pushed to an individual
the different offices appeal differently to distinct candidate types, according to
their ability to fulfill the party's expectations.
From the point of view of the party though, a seat in the Senate is much
more valuable than one in the House. One vote in the Senate counts 8 of the total votes, while one vote in the House counts only 5 . It is true that when the party's heads are deciding among persons to nominate as candidates, they must seek to
maximize their vote-counting. Taking only this rationale into consideration, a more
notorious, powerful, and experienced politician should have precedence in running
for the Senate. However, winning features are of no help if the candidate, once
elected, turns his back on his party and votes with the opponents. In this way, it is
fundamental that the party trusts someone before giving him the opportunity to
run for the Senate seat. Note that a defection by a House member would be less
problematic for the party, since there are other representatives from the same
party to pursue the party's agenda in the House. Moreover, the popularity of a
candidate affects the composition of the House more than that of the Senate. This is
because a popular candidate in a party list helps in securing the election of more
candidates of the same party or coalition.
Therefore, the electoral rule may be the very mechanism through which
confidence and loyalty bounds are tied together; in other words, the channeling of
polarization may be influenced by the electoral rule. Suppose that for any reason, a
politician secured his indication as candidate. Once in office, the candidate should
reciprocate by voting with his party, in order to ensure that in the next election,
the party will enable him to defend his seat. Hence, it can very well be the fact that
as a more restrictive procedure, the plurality-majority rule used in the election to
the Senate induces more partisan behavior. Of course, a person can be loyal to a
party before even becoming a candidate, and this loyalty must be a crucial factor,
among others, that induces the party to provide him with the opportunity to run
for office.
This framework resembles the screening problems in which a principal
offers a menu of tasks with different levels of difficulty, and the agent self-selects
for a task according to his ability. Here the two tasks would be the run for a seat
and the appropriate behavior as an incumbent in the Senate and the correlation for
the House. The candidate would then evaluate not only his characteristics like
previous popularity and partisanship history, but also how he would behave once
in the Senate or House. As a defection in the House is less harmful than one in the
Senate, the assignment of a candidate to run for the House can be termed as a
lower task; and one for the Senate a higher task.
Once elected, any politician should abide by the re-election rationale
mentioned above. The final test between the pre- and post-election effects could be
conducted by estimating how the same person behaves in the House and in the
Senate. This task is left for a future study.
The same re-election logic does not work as well for the House though,
because a good candidate can bring benefits to the party even without being loyal.
As the electoral rule for the House is proportional with an open list, a strong
candidate may pull some other winners with him, and his vote will also count for a
smaller fraction of the total. It therefore follows that even if this same candidate
should misbehave in his seat, the party could internalize this cost, for the
representative could again bring more elected candidates with himself the next
time round.
Finally, it is noteworthy that this paper is attempting to solely measure the
effect of a cause. Many other processes and variables concur to explain legislator
behavior. However, it is not my intention to make thorough predictions about
legislative decision-making. The idea is simply to elucidate first a qualitative
finding—the existence of an influence of the electoral rules on the polarization of
the legislative bodies—and then make an attempt to quantify that effect. One study
that would walk alongside this one is Neiva and Izumi (2012). One finding in that
paper is that senators substitute votes more in line with the Executive branch.
These phenomena dwell under the party-discipline type of events. Another study
of this kind is Melo and Batista (2012). Focusing on the higher chamber—and this
is the novelty on the paper—the authors claim that party discipline in the Brazilian
Senate compares with that of the House. These processes could, for instance, lead
Data
The case study explored in this paper was produced using roll call data
from 1989 to 2010 collected and generously shared by the Brazilian Center for
Analysis and Planning (CEBRAP in its Portuguese acronym). This dataset covers a
large part of the new democratic period, which began with the new Constitution
and presidential elections in 1989. Another novelty in this paper is the fact that roll
call data from the Senate was analyzed for the purpose of investigating
polarization, which had not been done in previous studies. Elections to Congress
occur every four years. A total of 513 representatives are elected for a four-year
term, and either 54 or 27 senators are elected for an eight-year term. Some
members of Congress leave before completing their terms because of reasons such
as taking an office at the Executive branch, running for governor, or being expelled
from Congress by its colleagues in a political judgment. Hence, during each
legislature, there may be more than 513 representatives and 81 senators. In the
period studied, the House had 1,958 representatives and the Senate had 273
senators. The House members voted on 1,611 roll calls, while the senators voted
on 752 roll calls. On a roll call vote, the legislator is required to cast a vote, which is
recorded, but this is not necessarily the case with other types of procedures. As an
example, votes in a voice vote are counted but not recorded, while in a proxy vote,
a legislator tells another to vote for him. In extreme cases, only the leaders of the
parties would vote, and the votes of the regular legislators are assumed to be in
accordance with one cast by the parties' leaders.
Most bills start in the House and if approved, go on to the Senate. If the
Senate approves the bill, then it becomes a law. If the Senate makes modifications,
it goes back to the House and has to be voted on again11, which explains why the
House has more roll calls than the Senate.
The empirical test
The empirical test proposed here does not have a control group per se, for any electoral rule could be seen as the treatment. Hence, this is a study where
there are actually two different treatments; the plurality-majority rule and the
proportional one. For the sake of clarity though, the plurality rule is denominated
as the treatment and the proportional rule as the control. Hence, the legislators in
the Senate are considered as the treatment group and the legislators in the House
are considered as the control group.
The legislatives' behavior is explored in terms of ideal points, a measure of
distance among them as estimated by WNOMINATE package in R12. The
WNOMINATE's ideal points calculated here are two-dimensional, and lie in the unitary circle as seen in Figures 01 and 02. The estimates displayed in Tables 01
and 02 are the only ones in the first coordinate; this coordinate represents the
economic dimension13. A left-wing legislator, or in the case of this study, party, will
probably lie in the [-1,0] interval. Conversely, a right-wing legislator or party
should lie in the [0,1] interval. Once each legislator's points in the coordinates are
estimated, the comparison is straightforward. One can look to the aggregated ideal
points and see whether the treatment has a significant effect on polarization, i.e., whether the estimates for a left-wing party are further to the left in the Senate than
in the House, and whether the estimates for a right-wing party are further to the
right in the Senate than in the House. It's important to mention that the algorithm's
output is simply a map, stripped of any inherent ideological content. What gives
one power to interpret the estimated coordinates with confidence is the fact that I
input ideology on it prior to the estimation. The WNOMINATE function in the R
package requires the researcher to pin down the dimensions by selecting a
legislator who is notoriously a social and fiscal conservative. With this information,
the algorithm returns dimensions that are aligned with ideology. The process
would work fine if I used a social and fiscal liberal legislator, but the estimates
would come out inverted. One could alternatively "create" a coalition/opposition
dimension, and this could explain some legislative behavior. However, the fact that
the analysis in this paper found very good estimates using the algorithm in its
original mode provides us with greater confidence in the validity of the method.
Four estimations were run for each chamber separately. First, the means
of the clustered parties' ideal points over the whole period were estimated. Then,
those means were disaggregated by legislature. Third, the legislators were
12 A good reference on the measurement methods and software is found in Poole (2005). The reference for the WNOMINATE package is Lo (2007).
13 The second dimension represents where the legislator or party dwells in the social
aggregated according to the coalitions to whom they belonged, i.e., they were either members of the government coalition or not, and the effect was estimated
for the whole period. Finally, the coalitions' behavior was estimated for each
legislature separately. The estimations were run for every member of the
Congress, and thence everyone participates in the results for the coalitions.
However, the results for the parties cover only the main parties; Worker's Party
(PT), Social Democracy (PSDB), Liberal Front (PFL-DEM), and Democratic
Movement (PMDB)14. After its redemocratization, Brazil had more than two dozen
parties with representation in the Congress, but the four mentioned above count
for roughly 60% of the Congress members. Among these main four, PT has always
been the furthest to the left while PFL-DEM the furthest to the right. PSDB shifted
in 1995 from the center-left to the center-right, and has maintained this position
until now. PMDB shifted from the center-right to the center-left in 2003, and has
since remained so.
Hypothesis
The set of hypothesis derived from the theory and to be tested are as
follows:
01. The party's mean ideal point for the senators lies to the right of the party's mean ideal point of the representatives, for a right-wing party;
02. The party's mean ideal point for the senators lies to the left of the party's mean ideal point of the representatives, for a left-wing party;
03. The coalition's mean ideal point for the senators lies to the right of the party's mean ideal point of the representatives, for a right-wing coalition;
04. The coalition's mean ideal point for the senators lies to the left of the party's mean ideal point of the representatives, for a left-wing coalition.
The ideal experiment to test whether the electoral rule affects legislator
behavior would require the same legislator to be elected for both chambers at the
same time, through different electoral rules, and voting on the same bills. This is
probably not how most parliamentary bodies throughout the world work, and
certainly it is not so for the Brazilian case. Moreover, even if such fiction were fact,
14 The acronyms PT, PSDB, PFL-DEM, and PMDB stand respectively for Partido dos
there would still exist a remaining problem; the stable unit treatment value
assumption would be violated. Note that the behavior a legislator would present in
a chamber could, and probably would, be correlated with his behavior in the other
chamber. It is unlikely that a person would vote differently on the same issue, at
the same time, just because the bill was voted on in different chambers. Therefore,
we would face an influence of treatment on control group, or vice-versa.
An alternative would be to compare the behavior of the legislators who
transit between the chambers across time. It is not unusual to have House
representatives elected for the Senate. One problem with this design is that the
legislator would face different bills once in different chambers, for he would be a
member of the chambers at different times, and the bills are usually voted on
during the same legislative period. Also, the problem of correlated behavior
mentioned above would persist. Aside from these problems, such a dynamic
estimation can be performed, with the use of DW-NOMINATE, for example. DW-NOMINATE can estimate the individual legislator's behavior across time; the algorithm is not openly available though.
With the impossibility of a natural experiment, the identification strategy
relies on the Brazilian electoral and legislative design. Remember that for electoral
purposes, only the electoral rules distinguish how legislators are elected for the
different chambers. This means that the district and the state are the same thing,
and there are no demographic confounders in the analysis, for senators and
representatives from the same state face the same constituency.
Moreover, every bill has to be voted on in both chambers in order to
become law, and if one chamber makes amendments to a bill, these changes also
have to be voted on in the other chamber. Hence, it is not the case that polarization
occurs because of the kind of issues raised in the different chambers. These
characteristics provide us with a suitable environment to test the effect of the
electoral rules on polarization. Evidently, a better test would have legislators being
randomly assigned to run for an office across different chambers. However, if there
is a selection problem in the sense that one type of legislators select itself, or is
selected by the party, to one of the chambers while another type is assigned to
another chamber, this does not necessarily invalidate the hypothesis that the
some manner correlated with the electoral rule, then the hypothesis remains
sound. This possible mechanism will last black-boxed until data is gathered on
possible causes of selection bias; for example, seniority in the party, previous
loyalty, popularity, and economic power. Such a dataset is however not yet
available.
Results
The main hypothesis tested in this study is that the Senate treatment, i.e., the plurality-majority rule, has a positive effect in causing polarization. Two sets of
strategies were used to estimate the effect of electoral rule on polarization: the
aggregated effect in the whole period and the effect separated by legislature.
Within these two sets, a further division is made in taking either the four main
parties individually, or the coalitions they formed. The party's or coalition's
ideological mean was estimated using WNOMINATE. This algorithm takes roll call data to order legislators relatively to their peers. Even though the different sorts of
bills that are voted constitute a multidimensional space, it is usually the case that
the behavior of legislators on any bill is predictable by one or two dimensions; the
economic and social ones. The accuracy of these predictions will appear presently.
More than ordering the legislators, WNOMINATE estimates the Euclidean distance among them in two dimensions, and in this way every individual is located on a
unit disc. For the numerical analysis that follows, only the legislators' coordinate in
the first dimension was taken into consideration. The first dimension, the
economic one, describes how legislators locate on the usual left-right spectrum,
and is the most explicative, or predictive, dimension. This means that the behavior
of a legislator in this dimension can be used to predict how the same legislator is
going to vote in other dimensions. For the sake of rigor, one may say that in this
study, polarization is being investigated in terms of the economic spectrum. There
is evidence that the main hypothesis is true, i.e., the plurality-majority rule has a positive effect on polarization, although not all of the findings are unequivocal in
confirming this.
Aggregated effect for parties
Figure 01 is a graphical summary of the calculations for the House in the
members of the House with a different symbol for each party. PT is represented by
the green triangles, PSDB the green circles, PFL-DEM the orange squares, and
PMDB the blue circles. Note that PT members are dispersed on the left, PSDB and
PMDB members somewhat on the center, and PFL-DEM members on the right. This
is just a descriptive plot to help the visualization of legislators in the ideological
space. Because the number of representatives is much larger than that of senators,
a comparison between the coordinates shown on Figures 01 and 02 is not
sufficient to test the hypothesis. The plot showing cutting-line angles indicates that
the first dimension is well-suited to explain the cleavage in the House, i.e., most of the bills separate legislators in the economic left-right spectrum. This plot just
shows the distribution of cutting lines. We can see the cutting-lines plot below, and
an explanation will be given presently. The screen plot shows the factor analysis in
which gains in explanation are still to be obtained when we increase the
dimensionality of the legislatures in the model. In contrast to U.S. legislatures,
Brazilian legislatures present a higher dimensionality, for the line flattens out only
after the eighth value. At each value on the horizontal axis, the value on the vertical
axis shows the gain in explanation moving away from the previous dimensionality.
We can see that substantive gains in explanation can be achieved using two
dimensions instead of one, or four instead of three, for example. After the eighth
dimension no significant gain is obtained. Still, for the purposes of this study, this
higher dimensionality does not represent a threat, since finding polarization on the
first dimension will already evince confirmation of the hypothesis. Finally, the
cutting lines displayed are a random sample of how legislators were separated in
the roll calls, and we can again see that most of them separate legislators in the
first dimension. As the Euclidean distance is used, these lines are the separating
hyperplanes in two dimensions15. Note that superimposing the cutting lines plot on
the coordinates plot results in the separation of PT members and PFL-DEM ones.
Even the more horizontal lines separate these two sets of legislators, which
indicates that among the four main parties in Brazil, PT is the most fiscal and social
liberal party, while PFL-DEM is the most fiscal and social conservative one.
15 A hyperplane
��∈ ℝ� is the set of points ∈ ℝ� such that a, x = �, with � ∈ ℝ�, and
� ∈ ℝ; i.e., �� = {x: a, x = �}. The hyperplane �� separates two sets X, and Y if for every
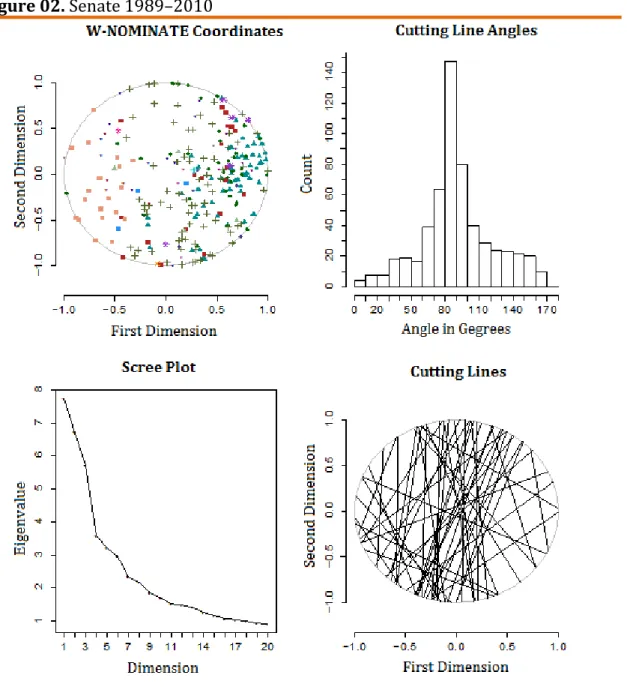
Figure 01. House of Representatives 1989–2010
Source: CEBRAP, Banco de Dados Legislativos.
WNOMINATE applied to the 1,858 legislators and 1,611 votes in the House from 1989 to 2010 have a Correct Classification of 89% of the votes in a
single-dimension linear model, and 90% in a two-single-dimension linear model. This means
that the model correctly predicts how a legislator is going to vote. When using only
one dimension the model is wrong in only 11% of the predictions, and 10% when
using two dimensions. There are two more technical measures that should be
reported; the APRE=0.55 and APRE=0.59 for one and two dimensions respectively, and GMP=0.76 and GMP=0.79 going from one to two dimensions16.
16 The Aggregate Proportional Reduction in Error (APRE) explains the behavior of
Figure 02. Senate 1989–2010
Source: CEBRAP, Banco de Dados Legislativos.
���� =∑= � � �∑ − � � � ��� �
� � � =
Here the results are 0.55 and 0.59 in one and two dimensions, respectively. An APRE equal to zero means that the model does not explain anything, while an APRE equal to 1 means that the model provides a perfect classification. The Geometric Mean Probability (GMP) demonstrates whether the overall classification is accurate, with the model being better than an educated guess. In other words, a fair coin toss would correctly predict half of the time how a legislator would vote, and the GMP shows whether the model is better than a fair coin toss. Formally, following Poole (2005), we have that:
" = ∑ ∑ ∑ � � � � �=
= =
,
where � is the index for Yea and Nay, � � is the probability of voting for choice �, and
� � = 1 if the legislator's actual choice is �, and 0 otherwise”. Then we have
� = �/ .
Figure 02 shows a similar picture for the Senate. Now the orange squares
represent the PT, the green diamonds are the PSDB, the green triangles the
PFL-DEM, and the green crosses the PMDB. Again, the coordinates, cutting line angles,
and cutting lines plots show that the first dimension does a good job in separating
legislators that behave in a polarized way. In the same period, for 273 legislators
and 752 votes in the Senate, the Correct Classification in one and two dimensions
are 88% and 89% respectively, the APREs are 0.44 and 0.46, and the GMPs are
0.74 and 0.77.
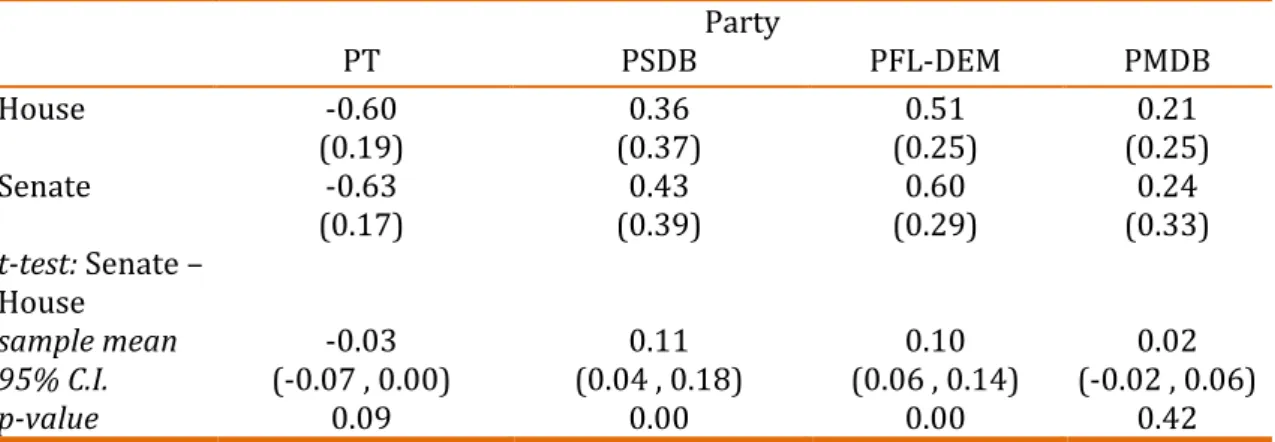
Table 01. Party-clustered effect (1989–2010): 1st coordinate mean
Party
PT PSDB PFL-DEM PMDB
House -0.60 0.36 0.51 0.21
(0.19) (0.37) (0.25) (0.25)
Senate -0.63 0.43 0.60 0.24
(0.17) (0.39) (0.29) (0.33)
t-test: Senate – House
sample mean -0.03 0.11 0.10 0.02
95% C.I. (-0.07 , 0.00) (0.04 , 0.18) (0.06 , 0.14) (-0.02 , 0.06)
p-value 0.09 0.00 0.00 0.42
Source: CEBRAP, Banco de Dados Legislativos.
Note: Cells show WNOMINATE mean aggregate estimates with standard error in parenthesis.
Table 01 shows the first coordinate estimates for the parties' aggregated
means, taking the whole period of study into account. All of the estimates are as
expected. PT's coordinate for the Senate is to the left of its coordinate for the
House, and for all the other three parties, the coordinate for the Senate is to the
right of the coordinate for the House. Remember that PMDB was a center-right
party for the majority of the time period considered in the study, so it is reasonable
that it would receive positive coordinates estimates.
A t-test was run with the null hypothesis being that there was no increase in the "extremeness" in the legislators' behavior in the Senate compared to the
House. The increase in the polarity was found to be statistically significant with a
95% level for PSDB and PFL-DEM, with a 90% level for PT, and statistically
insignificant for PMDB. This statistical analysis therefore presents evidence that
legislators in the Senate are more polarized than in the House, and therefore
blurred, however, when parties are disaggregated by legislature and also when
studying the coalitions instead of parties.
Time series for parties
The effect of each separate party in each legislature is explored below.
There were six legislatures in the period studied, two chambers, and the
categorization party/coalition. Hence, there are 24 sets of estimates. In practically
all of them, the Correct Classification is around 90%, the APRE is 0.6 and the GMP
is 0.75. The exception is with the Senate, where the APRE for the years 1991–1994
is around 0.2.
Figures 03 to 06 display the behavior of each party separately, in the
House and in the Senate. They cover all the legislatures since redemocratization,
excluding the two most recent ones17. The previous result remains unequivocal to
the behavior of legislators from PT only. In every legislature, the senators from PT
were more polarized than their colleagues in the House, i.e., the PT's coordinates in the Senate are to the left of the PT's coordinates in the House18. The hypothesis is
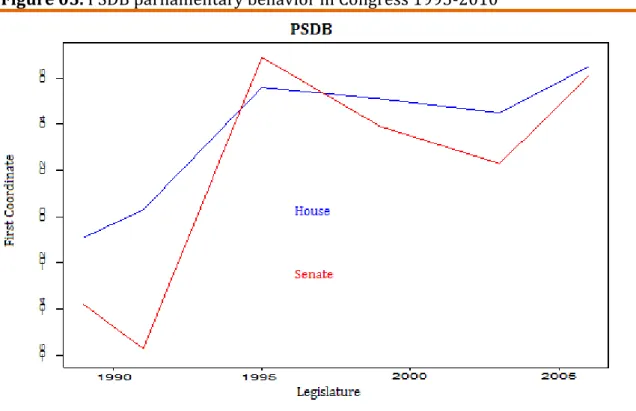
verified for PSDB in the first three legislatures only, and fails for the last three.
PFL's behavior was in accordance with the expectations in the periods 1989–1990
and 1999–2002 only. Finally, PMDB demonstrated more polarized behavior in the
Senate in 1995–1998, 2003–2006, and 2007–2010.
As a simple measure of success of this hypothesis, the instances where the
polarization was as expected were counted and divided by the opportunities to be
as expected, i.e., the number of times a party behaved as it "should" was added and divided by the total number of possible times a party could have behaved as it
"should". Consequently, out of 23 opportunities to corroborate the claim, 13
successes were observed; a 56% rate of success. Separating this by parties'
orientations, the right-wing parties had 14 opportunities and the polarization in
the Senate was higher in only four instances. It is noteworthy though, that for the
17 In 1986, the 48th legislature was elected with the main task of writing the current
Constitution. That was done in 1987–88, the presidential elections took place in 1989, and the first directly-elected president since 1961 began his mandate in March 1990. The data set keeps records from the roll calls since 1989, the year the Constitution entered into force.
18 PT had no senator in the 1987–1990 legislature, so a comparison is not possible for that
left-wing parties, the behavior was in accordance with the hypothesis in all nine
opportunities. This may indicate that there is a heterogeneous treatment effect
that influences the legislator's behavior more strongly when he is a member of a
left-wing party.
Figure 03. PT parliamentary behavior in Congress 1995-2010
Source: CEBRAP, Banco de Dados Legislativos.
Figure 04. PMDB parliamentary behavior in Congress 1995-2010
Figure 05. PSDB parliamentary behavior in Congress 1995-2010
Source: CEBRAP, Banco de Dados Legislativos.
Figure 06. PFL-DEM parliamentary behavior in Congress 1995-2010
Source: CEBRAP, Banco de Dados Legislativos.
Aggregated effects for coalitions
Although a presidentialism, Brazil presented so far somewhat
presidents had to gather votes in Congress beyond their own parties in order to
pass their legislative agendas. Hence, every government had to form a coalition;
one can then separate the legislators as in a two-party system.
The coalitions were recorded in the data set as government and
opposition, and not as the left and right per se. However, one can use the ideological orientation of the president to label each coalition. As shown in Leoni
(2002), the first three presidents since the comeback of direct elections; Fernando
Collor, Itamar Franco and Fernando Cardoso had WNOMINATE coordinates to the right in the left-right spectrum. The last president in the period studied, Luiz da
Silva, was a member of the House in 1987–1990, and his WNOMINATE coordinate calculated during this period is -0.96. The president during the democratic
transition was José Sarney, who then became a senator, and his first coordinate in
the period 1991–1994 is 0.15. Hence, the first three government coalitions,
covering the 1989–2002 period, were classified as right-wing coalitions, and the
last two, covering the 2003–2010 period, were classified as left-wing ones19.
First, the estimation used all the coalitions in the period studied, i.e., not separated by legislature. The WNOMINATE single-dimension linear model applied to the House presented a Correct Classification of 89%, an Aggregate Proportional
Reduction in Error of 0.55 and a Geometric Mean Probability of 0.76. For the
Senate the respective values are 91%, 0.60, and 0.79.
Table 02 shows that the right-wing coalitions are more polarized in the
Senate than in the House, according with hypothesis 03, but hypothesis 04 is not
confirmed, i.e., left-wing coalitions are not more polarized in the Senate than in the House. The t-test states that the difference in the polarization is statistically significant at the 95% level in the right-wing case, and at 90% level for the
left-wing coalitions. Interestingly, the broad result is somewhat inverted when the
estimations were run with disaggregated legislatures.
19 Itamar Franco was Fernando Collor's vice-president and took the office in the period
Table 02. Coalition-clustered effect (1989–2010): 1st coordinate mean
Coalition
Left Right
House -0.08 0.36
(0.45) (0.30)
Senate -0.04 0.43
(0.52) (0.35)
t-test: Senate – House
sample mean 0.05 0.06
95% C.I. (-0.01 , 0.10) (0.03 , 0.10)
p-value 0.09 0.00
Source: CEBRAP, Banco de Dados Legislativos.
Note: Cells show WNOMINATE mean aggregate estimates with standard error in parenthesis.
Time series for coalitions
Figures 07 and 08 display the legislators' behavior aggregated by
coalitions and disaggregated by legislature. Here, the members of left-wing
coalitions are more polarized in the Senate than in the House. It should be noted
that this has not been verified for the 1991–1994 period only. Conversely, the
right-wing coalition is more polarized in the Senate in only two occasions; 1995–
1998 and 2006–2010. The odd behavior observed in the 1991–1994 period by the
left-wing coalition, with positive coordinates, and by the right-wing coalition in the
Senate, with negative coordinates, may be explained by the politico-institutional
crisis that took place in 1992, when corruption scandals resulted in a loss of
support for the president in the Congress, culminating with his impeachment.
Figure 07. Left-wing government coalitions parliamentary behavior
Figure 08. Right-wing government coalitions parliamentary behavior
Source: CEBRAP, Banco de Dados Legislativos.
Conclusion and future research
Political polarization is an important issue in American and European
politics, and has been under scholarly investigation for some time now. It also
appears to be an increasingly important feature of Brazilian politics, one that is
talked about in journalistic accounts and informal chats but yet to receive much
attention in academia. This paper investigates whether electoral rules affect
polarization in the Brazilian legislative branch. Specifically, I compare the
plurality-majority rule used in the Senate with the proportional rule used in the
House of Representatives.
The hypothesis that the plurality-majority rule induces more polarization
is supported by data, but not to its full extent. In the comprehensive test, using the
aggregate data for almost all legislatures in the democratic period, the Senate
treatment had a positive effect in causing its legislators to behave more extremely.
This claim is not as apparent as when the data by legislature and coalition are
separated. In general, left-wing parties and coalitions are more affected by the
treatment than their right-wing counterparts.
Comparing the comprehensive treatment effects of the aggregated cases
with the heterogeneous ones in the legislature-by-legislature instances is difficult
because of software specificities. The particular issue lies in fixing fiscal and social
result in different coordinate estimates from the estimates in the disaggregated
data sets. This occurs because the particular legislators chosen in the first case are
not in every legislature, forcing other choices.
This problem of the same party or member of the Congress in different
legislatures may be resolved in a dynamic estimation, for example, using DW-NOMINATE and a common space for the legislatures. Also with dynamic methods, and using the fact that some members of the House eventually became members of
the Senate, this experiment could be performed in order to compare directly, i.e., in the same person, the effect of the control and treatment. Again, this would require
the assignment of a common space, but for both chambers. Finally, one can extend
the analysis for all of the parties, to explore whether there is a similar effect of the
electoral rules on polarization for the small parties in the Congress.
As a last note, I do not make any judgment of value here regarding political
polarization. It may be sometimes good or sometimes bad. I use the terms found in
the literature. Hence, one should not think that words like extremists, moderates, and polarized have any value hierarchy in this paper. They might have in some of the studies mentioned, but not in this paper. The analysis in this paper is mostly
descriptive, and somewhat inferential. There is no attempt to recommend any
particular institutional design.
Revised by Cabo Verde Submitted in December 2013 Accepted in April 2015
References
BAILEY, Michael (2007), Comparable Preferences Estimates across Time and Institutions for the Court, Congress, and Presidency. American Journal of Political Science. Vol. 51, Nº 03, pp. 433–448.
BRADY, D. and HAN, H. (2004), An Extended Historical View of Congressional Party Polarization. Working Paper. Stanford University.
CARROL, Royce and EICHORST, Jason (2013), The Role of Party: The Legislative Consequences of Partisan Electoral Competition. Legislative Studies Quarterly. Vol. 38, Nº 01. pp. 83-109.
DESPOSATO, Scott (2006a), The Impact of Electoral Rules on Legislative Parties: Lessons from the Brazilian Senate and Chamber of Deputies. Working Paper. DESPOSATO, Scott (2006b), Parties for Rent? Ambition, Ideology, and Party
Switching in Brazil's Chamber of Deputies. American Journal of Political Science. Vol. 50, Nº 01, pp. 62–80.
DESPOSATO, Scott and CUNOW, Saul (2011), Letting Money Talk: Estimating Ideal Points in Brazil Using Campaign Contributions. Working Paper.
DUVERGER, Maurice (1957), Los Partidos Politicos. Fondo de Cultura Economica. 461 p.
EGUIA, Jon (2012), Challenges to the standard Euclidean spatial model. Working Paper.
EVANS, John (2003), Have Americans' Attitudes Become More Polarized? - An Update. Social Science Quarterly. Vol. 84, Nº 01. pp. 71-90.
LEONI, Eduardo (2002), Ideologia, Democracia e Comportamento Parlamentar: A Câmara dos Deputados (1991-1998). DADOS-Revista de Ciências Sociais. Vol. 45, Nº 03, pp. 361–386.
LIMONGI, Fernando (2006), Presidencialismo, coalizão partidária e processo decisório. Novos Estudos. Vol. 76. pp. 17-41.
LO, James (2007), Using W-NOMINATE in R. Mimeo.
MCCARTY, Nolan; POOLE, Keith and ROSENTHAL, Howard (2006), Polarized America: The Dance of Ideology and Unequal Riches. MIT Press, Cambridge, MA. 240p.
MELO, Natália Maria Leitão de and BATISTA, Mariana (2012), Diferentes, mas iguais? Padrões de disciplina partidária na Câmara e no Senado. Revista
Política Hoje. Vol 21, Nº 01. pp. 150-185.
MIGNOZZETTI, Umberto; BERNABEL, Rodolpho and GALDINO, Manoel (2011), Faz alguma diferença corrigir as distorções de representação no Brasil? Um estudo sobre a interação entre a arena Eleitoral e a arena Legislativa no âmbito Federal. Cadernos Adenauer XII. Nº 02, pp.115-134.
MORGENSTERN, Scott (2004), Patterns of Legislative Politics. New York: Cambridge University Press. 227p.
POOLE, Keith (1984), Least Squares Metric, Unidimensional Unfolding.
Psychometrika. Vol. 49, Nº 03, pp. 311–323.
POOLE, Keith (1998), NOMINATE: A Short Intellectual History. Available at SSRN: http://ssrn.com/abstract=1154153 orhttp://dx.doi.org/10.2139/ssrn.1 154153.
POOLE, Keith (2003), Changing Minds? Not in Congress! Working Paper.
POOLE, Keith (2005), Spatial Models of Parliamentary Voting. New York: Cambridge University Press. 225p.
ROSENTHAL, Howard and POOLE, Keith (1984), The Polarization of American Politics. The Journal of Politics. Vol. 46, Nº 04), pp. 1061–1079.
ROSENTHAL, Howard and POOLE, Keith (1985) A Spatial Model for Legislative Roll Call Analysis. American Journal of Political Science. Vol. 29, Nº 02, pp. 357–384. ROSENTHAL, Howard and POOLE, Keith (1997), Congress: a politic-economic
history of roll call voting. Oxford University Press. 297p.
ROSENTHAL, Howard and POOLE, Keith (2007), Ideology and Congress. New Brunswick, NJ. 361p.
SHOR, Boris and MCCARTY, Nolan (2011), The Ideological Mapping of American Legislatures. American Political Science Review. Vol. 105, Nº 03, pp. 530–551. SHOR, Boris; BERRY, Christopher and MCCARTY, Nolan (2010), A Bridge to
Somewhere: Mapping State and Congressional Ideology on a Cross-institutional Common Space. Legislative Studies Quarterly. Vol. 35, Nº 03, pp. 417–448.
WISEMAN, Phil Everson and VALELLY, Rick (2008/2009), NOMINATE and American Political History: A Primer. Voteview website, voteview.com.