Local multiplier of industrial employment:
Brazilian mesoregions (2000-2010)
*Multiplicador local do emprego industrial:
mesorregiões brasileiras
GUILHERME MACEDO LEONARDO MONASTERIO**
reSumO: este trabalho estima o multiplicador local de longo prazo da emprego industrial para as mesorregiões brasileiras. A metodologia toma como base os estudos de moretti (2010) e moretti e Thulin (2012), que estimaram os multiplicadores locais do emprego para os estados unidos e para a Suécia, respectivamente. Foram avaliados os impactos da variação de empregos no setor industrial sobre o emprego no setor de serviços, bem como o impacto da variação de empregos nos setores industriais de alta e de baixa tecnologia sobre o emprego nos setores de serviços. essas estimativas permitiram avaliar o impacto de mudanças do emprego industrial nas economias locais. Fez-se uso de uma variável ins-trumental fundamentada no método estrutural-diferencial (shift-share). Foram utilizados dados de emprego da relação Anual de Informações Sociais (rAIS) de 2000, 2005 e 2010, para 21 subsetores de atividade econômica e 123 mesorregiões. estimou-se que, no nível mesorregional, para cada emprego gerado nos setores industriais quatro são criados nos setores de serviços, no longo prazo. Também foi calculado que, para cada emprego gerado nos setores industriais de alta intensidade tecnológica, são criados cerca de sete empregos nos setores de serviços, no nível mesorregional, no longo prazo.
PALAVrAS-ChAVe: economia regional; mercado de trabalho; multiplicadores locais; shift-share.
ABSTrACT: This paper estimates the local multiplier of manufacturing for Brazil (2000-2010). The method is based on moretti (2010) and on moretti and Thulin (2012), who estimated these multipliers for the u.S. and Sweden. The local multiplier of manufacturing estimates the impacts of employment changes in the industrial sectors on employment in the services Brazilian Journal of Political Economy, vol. 36, nº 4 (145), pp. 827-839, October-December/2016
* We would like to thank Bruno de Oliveira Cruz for his comments and suggestions. All mistakes are ours.
sectors, and the impact of changes in employment in the high-tech and low-tech tradable sectors on employment in the services sectors. These estimates help to assess the importance of industrial employment changes over local economies. We created instrumental variables, based on the shift-share method. The employment data cover 21 economic subsectors and 123 regions in 2000, 2005 and 2010. We have estimated that in the Brazilian mesorregions,
for each new job in the tradable sectors, almost four jobs were created locally in the services sectors. Additionally, each job in the high-tech industrial sectors was estimated to create approximately seven jobs in the services sectors over the long term.
KEYWORDS: regional economics; labour market; local multipliers; shift-share. JeL Classiication: J21; J88; r12; r23.
INTrODuCTION
The present and future of the Brazilian manufacturing industry have received the attention of scholars and policy makers1. Discussions have focused on the
pro-cess of early deindustrialisation and its causes. Although consensus on the issue is lacking, the proponents of manufacturing’s importance to national development agree that the sector is special. Following a Kaldorian approach, they claim that manufacturing has a very strong multiplier effect on other sectors at the local and national levels (e.g., Lamonica and Feijó, 2011).
To contribute to this debate, this study estimates the local multiplier effect of national industrial employment. This estimate is achieved through a newly devel-oped technique that offers advantages over previous approaches. Isles and Cuthbert (1956) presented a pioneering attempt to adapt the Keynesian multiplier to subna-tional analysis (Faggian and Biagi, 2003). Later, more sophisticated input-output, computable general equilibrium or simulation models were applied in the estima-tion of this multiplier. These methods are relevant. however, they require data-bases at the local level, which are rarely available, and theoretical choices that are not always obvious.
The method proposed by moretti (2010) is the primary recent contribution to local multiplier estimation. In an article published in the American Economic Review, moretti estimated the employment multiplier at the local level in the u.S. between 1980 and 2000 (moretti, 2010). The author applied an idea proposed by Bartik (1991) and Blanchard and Katz (1992, p. 49): using the shift-share method to create an instrumental variable that overcomes endogeneity problems. As will be presented below, this method estimates local employment creation as a result of an exogenous increase in the number of jobs in the manufacturing sectors.
This study applies the method of moretti (2010) to Brazilian mesoregions for a recent period and thus represents an innovative approach to local multiplier
estima-1For the contemporary debate on deindustrialization in Brazil, see: Nassif (2008); Bonelli and Pessôa
tion in Brazil, based on instrumental variables. The data source is the Annual Social Information report (relação Anual de Informações Sociais – rAIS), and the level of analysis comprises the 21 Brazilian economic subsectors and 123 Brazilian mesore-gions. The study period was selected based on the following criteria: quality, data availability and comparability with other studies. Therefore, there are two periods of analysis, 2000-2005 and 2005-2010. In this study, the tradable sector groups represents the manufacturing industry sectors, and the term “industrial” is used as this sector’s synonym. In addition, “services” is used instead of “non-tradable”.
The importance of assessing the local multiplier is easily justified. In the search for local development, policy makers seek guidance regarding the impact of new ventures. The estimation of the long-term employment multiplier serves as an initial basis for the assessment of public policies for regional development.
The paper is divided in six parts, considering this introduction. In the second part, the method proposed by moretti (2010) is detailed, in order to present the model that will be used to estimate the Brazilian local multiplier of industrial em-ployment. The third part explains the shift-share method, which is the core for the construction of the instrumental variable used to estimate de model presented in the second part. In section four, the data gathered from rAIS for this study are described and analysed. The fifth part shows the econometric results for estimations of the local multipliers. In the last part, the conclusions are presented.
meThOD
As previously mentioned, Bartik (1991) and Blanchard and Katz (1992) pio-neered the use of shift-share methods to construct instrumental variables (IVs) for regional issues. Currently, there are several studies adopting the same research ap-proach: mardukhi (2010), Blasio and menon (2011), Beaudry, Green and Sand (2012), Carvalho and Lee (2013), Koster (2013) and Faggio and Overman (2014). Firstly, the theoretical basis of econometric specifications will be outlined. Sub-sequently, it will be demonstrated how the shift-share method can generate an appropriate instrument. each geographical unit is considered to be a competitive economy that uses labour to produce the vector of tradable goods nationally (x1, x2, x3,..., xK), the prices of which are exogenous to the geographical units because they are determined nationally. Labour also generates the vector of non-tradable goods (z1, z2,...,zm), the prices of which are determined locally. Labour is fully mobile among sectors within the same geographical unit (moretti, 2010).
The local labour supply has a positive slope. The greater the geographical mobility of labour is, the greater the elasticity of the labour supply will be. A limi-tation of labour mobility is local housing supply. Its elasticity depends on the local geography, the regulations on land use in the region and accessibility.
industry in the region or the increasing demand for products produced by compa-nies already established in the same region. The direct effect of this shock is an increase in employment in sector x1. however, this shock also directly affects the jobs in other tradable sectors (x2, x3,..., xK) and in all of the non-tradable sectors. The shock must also have general equilibrium effects on local prices, e.g., the in-crease in wages over the entire location (mardukhi, 2010) and the rising costs of housing in the location (except in extreme cases of infinitely elastic housing or la-bour supply).
regarding the case of the shock effect on the other tradable industries, there is an immediate increase in the labour demand, which causes an increase in wages in the tradable sectors, resulting in the reduced competitiveness of local industries as a whole because the price of tradable goods is defined nationally. Therefore, if the production costs of an industry increase in a particular location, the tendency is for the industry to migrate to another region. This effect is corrected over the medium term by the increased supply of labour through the migration of new workers to the region.
moretti and Thulin (2012) argued that the estimation by ordinary least squares (OLS) of (1) could provide inconsistent results if the unobserved shocks to non-tradable sector employment at the local level also affect non-tradable sector employment. Specifically, these shocks could be associated with variation over time in a region’s labour supply (e.g., the region’s infrastructure, crime, quality of education, local services, local taxes), and they could result in bias in the estimation. For moretti and Thulin, this bias could be positive or negative, depending on the correlation between the variations in employment in the tradable sector and the shocks (repre-sented by
ε
residuals), and such a correlation could be positive or negative. endo-geneity requires the creation of an instrumental variable that is correlated with the explanatory variable but is not directly related to the dependent variable. To esti-mate the local multiplier, moretti (2010) proposed the construction of an instru-mental variable using the shift-share method, as explained in the following section.The ShIFT-ShAre meThOD
employment caused by local specificities. Formalised by Dunn (1960), this analysis is one of the most frequently used tools in the discipline of regional science.2
The empirical strategy for the present study is based on calculating the struc-tural component of the regions and using it as an instrument of the variation ob-served in the tradable sector. Thus, if an industry in the tradable sector increases the labour supply as a result of a national shock in that industry, this instrument will isolate the variation caused by national changes from the variation that results from local changes. These variations associated with each industry affect the re-gions in different ways because of their different sector structures.
The reason for using the shift-share method merits consideration in terms of the literature on instrumental variables. The structural component is associated with a variation in the employment in the tradable sector, making it a relevant in-strument. In addition, the method would only influence the dependent variable by means of the instrumental variable. Therefore, it is an exogenous instrument.3
Thus, to estimate the local employment multiplier, the shift-share method will be used as a tool to eliminate potential endogeneity problems in the regression.
moretti and Thulin (2012) chose to construct the IV based on the same logic as that of the shift-share method. Thus, the term Em tT E
m t b T
, − ,− is represented by instru-∑=
ment j E ln E E s
m j t s T
j t T
m j t T
, , , , ,
− − ∑=1 −
(
( − ))−ln Ej t b,− −E , ,− ))
T
m j t b T
( . This instrument includes the national
portion and the shares of each industry. however, it excludes regional variation. In fact, the IV isolates the variation as a result of national changes in sector j from all the variation in employment in sector j in region m. This variation affects the na-tional geographical units differently, depending on the composition of their tradable sectors relative to total employment in the reference year.
DATA SOurCe AND ANALySIS
In this study, the database used was extracted from Rais Vínculo for the 2000, 2005 and 2010 and was grouped into mesoregions and subsectors. Despite certain limitations and necessary adjustments, this database is considered for the present study.
The dispersion of growth rates is essential for the application of the presented method. During the analysed decade, some mesoregions experienced regression in industrial employment, with a decrease of 6%, whereas others grew by more than
2 The classic study of haddad et al. (1989) discusses the method and its extensions. For applications of
the shift-share analysis in Brazil, see: Santos (2000); martins and Silva (2005); Ilha and Wegner (2005); De Souza and Dos Santos (2011); Gonçalves Junior and Galete (2010); Souza and rodrigues (2011); and Gonçalves Junior et al. (2012).
3 The national component captures the increase in national employment. Thus, the formalisation and
450%. That is, despite the overall preservation of the industry’s regional configura-tion, the regional trajectories were different.
This study followed the criteria of Cruz and Santos (2011), and mesoregions that presented (according to data from 2000) fewer than 5,000 formal jobs or more than four subsectors with no employment were excluded from the analysis. Four-teen mesoregions satisfied one of the two criteria for the 2000 base period. Thus, of the initial 137 mesoregions, rAIS data for only 123 mesoregions were consid-ered. The subsectors of economic activity available in rAIS represent the highest level of sectorial aggregation used by the Brazilian Institute of Geography and Statistics (Instituto Brasileiro de Geografia e estatística – IBGe) in the classification of economic activities, precisely because it is one of the oldest classifications of these activities. This level of disaggregation of economic activities into 25 subsectors is sufficient.4
Four subsectors were disregarded: mineral extraction, Production of Non-metallic minerals, Public Administration and Agriculture and Others. The classifi-cation used for the subsectors agrees with the approach of moretti (2010). The first three sectors were excluded because their locational reasons are based on natural resources or political decision, and these factors are not the focus of this study. moreover, the subsectors of Public Administration and Agriculture are among those with information that is significantly compromised by deficiencies in the rAIS database. Thus, the data for the remaining 21 subsectors of economic activities will be used.
The separation of industry and services will be based on the division suggested by marconi and rocha (2011), with the necessary adaptations, because the authors have not worked with IBGe economic activity subsectors. The following subsectors were grouped under industry: metal industry; mechanical industry; electrical and communications; Transport equipment; Wood and furniture; Paper and printing; rubber, tobacco and leather; Chemical industry; Textiles; Footwear industry; and Food and Beverage. The subsectors considered to be services are Public utilities; Construction; retail; Wholesales; Financial institutions; Technical and profession-al administration; Transport and communications; Accommodation and commu-nications; medical, dental and veterinary; and education.
Among the 11 industrial subsectors to be grouped by technological intensity, the following groupings are considered:
• Low technology: metal industry; Wood and furniture; Paper and printing; rubber, tobacco and leather; Textiles; Footwear and Food and beverage; and
• high technology: electrical and communications; Transport equipment; Chemical industry and mechanical industry.
Observing the share of economic activity subsectors that constitute the
data-4Cruz and Santos (2011) and Saboia (2013) presented comprehensive views of the evolution of Brazilian
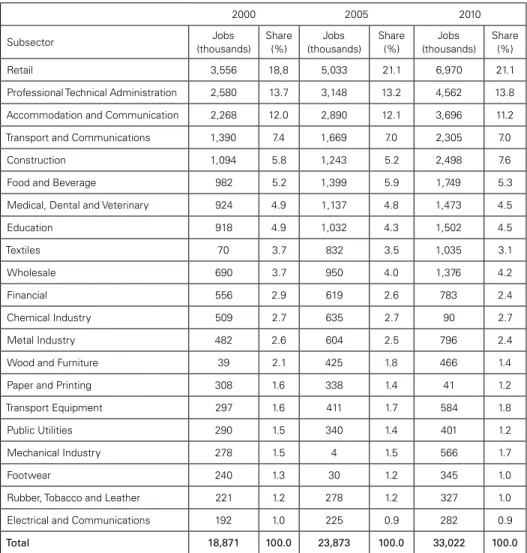
base nationwide (Table 1), the subsectors that appear to make up the cluster of services are those with the largest share of employment in the three selected years. The retail, Professional Technical Administration and Accommodation and Com-munication subsectors are noteworthy because together they accounted for more than 40% of employment.
TABLE 1: Employment share among selected economic activity subsectors in Brazil (2000, 2005 and 2010)
2000 2005 2010
Subsector Jobs
(thousands) Share
(%)
Jobs (thousands)
Share (%)
Jobs (thousands)
Share (%)
Retail 3,556 18,8 5,033 21.1 6,970 21.1
Professional Technical Administration 2,580 13.7 3,148 13.2 4,562 13.8
Accommodation and Communication 2,268 12.0 2,890 12.1 3,696 11.2
Transport and Communications 1,390 7.4 1,669 7.0 2,305 7.0
Construction 1,094 5.8 1,243 5.2 2,498 7.6
Food and Beverage 982 5.2 1,399 5.9 1,749 5.3
Medical, Dental and Veterinary 924 4.9 1,137 4.8 1,473 4.5
Education 918 4.9 1,032 4.3 1,502 4.5
Textiles 70 3.7 832 3.5 1,035 3.1
Wholesale 690 3.7 950 4.0 1,376 4.2
Financial 556 2.9 619 2.6 783 2.4
Chemical Industry 509 2.7 635 2.7 90 2.7
Metal Industry 482 2.6 604 2.5 796 2.4
Wood and Furniture 39 2.1 425 1.8 466 1.4
Paper and Printing 308 1.6 338 1.4 41 1.2
Transport Equipment 297 1.6 411 1.7 584 1.8
Public Utilities 290 1.5 340 1.4 401 1.2
Mechanical Industry 278 1.5 4 1.5 566 1.7
Footwear 240 1.3 30 1.2 345 1.0
Rubber, Tobacco and Leather 221 1.2 278 1.2 327 1.0
Electrical and Communications 192 1.0 225 0.9 282 0.9
Total 18,871 100.0 23,873 100.0 33,022 100.0
Source: Relação Anual de Informações Sociais – RAIS Prepared by the authors.
is, in 2000, there were 3.1 jobs in the services sectors for each job in the industrial sectors, whereas in 2010, this ratio increased to 3.4.
With regard to technological intensity, Table 2 shows an increased share of the sectors classified under high technological intensity in the industrial sectors, at 27.7% in 2000 and 31.3% in 2010. Thus, whereas in 2000, there were 2.6 low-tech jobs for each high-tech job, the ratio decreased to 2.2 in 2010.
TABLE 2: Distribution of employment by subsectors grouped in Brazil (2000, 2005 and 2010)
2000 2005 2010
Sectorial level Jobs (thousands)
Share (%)
Jobs (thousands)
Share (%)
Jobs (thousands)
Share (%)
Industry 4,604 24.4 5,811 24.3 7,456 22.6
Services 14,266 75.6 18,061 75.7 25,566 77.4
Technological intensity (industry only)
Low 3,327 72.3 4,172 71.8 5,123 68.7
High 1,276 27.7 1,638 28.2 2,332 31.3
Source: Relação Anual de Informações Sociais – RAIS Prepared by the authors.
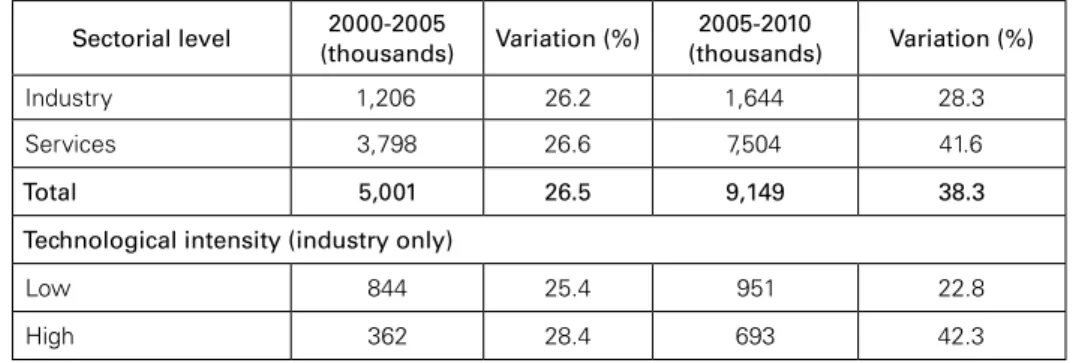
The generation of industrial and services jobs between 2005 and 2010 creased compared with the first period (Table 3). This acceleration was more in-tense among the services sectors, in which the variation in the number of jobs be-tween 2005 and 2010 was 41.6%, compared with 26.6% bebe-tween 2000 and 2005. The increase in the number of jobs in high-tech sectors is also noteworthy: from 28.4% during the first period to 42.3% during the second period.
TABLE 3: Variation in employment by grouped subsectors in Brazil (2000, 2005 and 2010)
Sectorial level 2000-2005
(thousands) Variation (%)
2005-2010
(thousands) Variation (%)
Industry 1,206 26.2 1,644 28.3
Services 3,798 26.6 7,504 41.6
Total 5,001 26.5 9,149 38.3
Technological intensity (industry only)
Low 844 25.4 951 22.8
High 362 28.4 693 42.3
A few facts should be noted regarding the distribution among mesoregions. As is known, the number of jobs in the metropolitan mesorregion of São Paulo (região metropolitana de São Paulo – rmSP) is more than double that of the mesoregion with the second-highest number of jobs, and in 2010, it corresponded to 19% of the total employment in the subsectors selected among the 123 mesoregions.
eCONOmeTrIC reSuLTS
Table 4 synthesizes our econometric results. The multiplier of industry jobs on services obtained by OLS was 5.3. That is, for each job created in the industrial sectors, more than five jobs are created in the services sectors. Applying the IV, as presented in the method section, the multiplier increases to 6.6. Only the first two results presented in Table 4 considered the metropolitan mesorregion of São Paulo (região metropolitana de São Paulo – rmSP).
TABLE 4: Synthesis of estimated local multipliers
Estimated value Econometric method RMSP
Industry on services 5.27 OLS Yes
Industry on services 6.58 IV Yes
Industry on services 2.88 OLS No
Industry on services 3.78 IV No
High-tech on services 6.94 IV No
Low-tech on services 6.81 IV No
High-tech on low-tech 0.77 IV No
Prepared by authors.
Note: All estimators are statistically signiicant at 1%. Full results are available upon request.
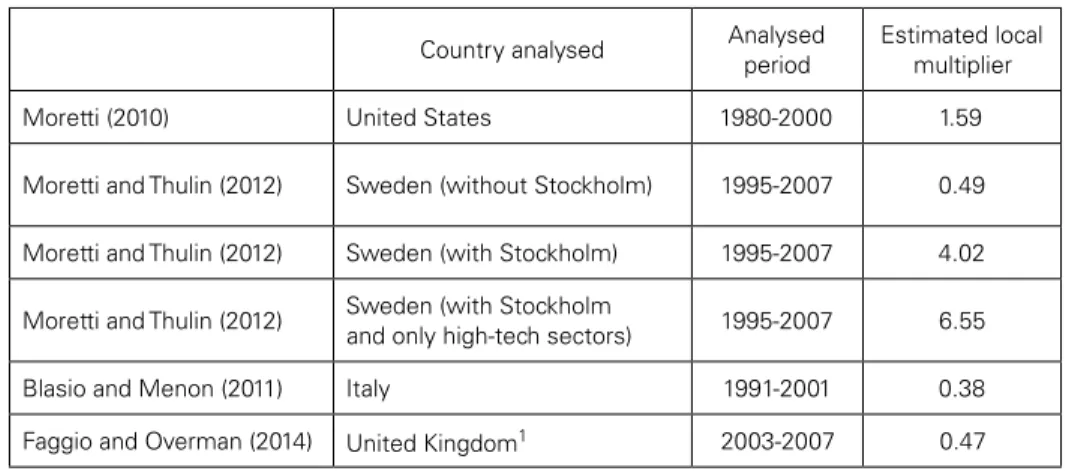
TABLE 5: Local employment multipliers of tradable sectors in non-tradable sectors estimated for other countries
Country analysed Analysed
period
Estimated local multiplier
Moretti (2010) United States 1980-2000 1.59
Moretti and Thulin (2012) Sweden (without Stockholm) 1995-2007 0.49
Moretti and Thulin (2012) Sweden (with Stockholm) 1995-2007 4.02
Moretti and Thulin (2012) Sweden (with Stockholm
and only high-tech sectors) 1995-2007 6.55
Blasio and Menon (2011) Italy 1991-2001 0.38
Faggio and Overman (2014) United Kingdom1 2003-2007 0.47
Prepared by the authors.
1For the U.K., the estimated multiplier was between employment in the public sector and employment in the
private non-tradable sector.
Table 5 also shows the local employment multiplier estimated for Italy to be low. Blasio and menon (2011) attributed the low multiplier of Italy to three factors: a rigid labour market, low variability in wages and obstacles to the mobility of labour. For the u.S., the local multiplier was larger than for Sweden and Italy, in-dicating, among other factors, greater labour mobility.
moretti and Thulin (2012) also warned that problems might arise from Stock-holm concentrating the same number of jobs as the other four largest regions. Where the employment concentration is high, the local effect is not isolated from
the structural effect, given the large share of the city in the total national employ-ment. In the case of Brazilian mesoregions, there is a parallel between Stockholm and the rmSP. Therefore, the rmSP was not included in part of the regressions. These results indicate that when OLS was applied, the multiplier was 2.9 and was significant, whereas the estimated the multiplier using the IV was 3.8 (Table 4). All of the values were statistically significant.5
Although the values of the local employment multipliers appear to be of high magnitude, they are in accordance with those reported by other authors using dif-ferent methods. Fachinelli et al. (2014) found mean employment multipliers of industrial sectors in Brazil (except the South region) of 4.00 and 4.11 for 1999 and 2004, respectively. For the South region, the multipliers exhibited similar mean magnitudes. These researchers used input-output matrices with data from the IBGe National household Sample Survey (Pesquisa Nacional por Amostra de Domicílios – PNAD), estimates of which require the use of more a complex method than that used in this study. Other studies, which also used the input-output matrix but with
5In the Swedish case, the decrease of the multiplier was even greater, decreasing to approximately 0.5
a higher level of sectorial disaggregation, found even higher mean multipliers than those found in this study. For example, Guilhoto and Sesso Filho (2010) obtained an estimated mean multiplier of national employment of 18.20 in 2005 in industry and services, considering the direct, indirect and induced effects. Obviously, these results are not directly comparable because they correspond to different spatial units.
regarding the impact of high- and low-technology sectors on the local employ-ment, unlike the results obtained by moretti and Thulin (2012) for Sweden, the employment multiplier of the high- and low-technology sectors have high values, even without considering rmSP, 6.94 and 6.81, respectively (Table 4). however, in the same line of estimated multipliers for Sweden, the multiplier of the low-tech sectors, estimated with IV, is lower than that of the high-tech sectors. That is, the generation of jobs in high-tech sectors has a higher multiplier effect on employment in the services sectors than the generation of jobs in low-tech sectors. These results agree with what is expected from the high-technology sectors: these sectors hire more skilled labour and pay higher wages than low-technology sectors. For the same number of jobs, those higher wages imply a greater increase in local demand for services when the mesoregion attracts a high-technology company than when a low-technology company is established.
Finally, the local multipliers estimated within the industrial sectors ware 0.71 by OLS and 0.77 using the IV (Table 4). The impact of variation in employment of high-technology sectors on the low-technology sectors is estimated. The results suggest estimated multipliers much lower than the multipliers on the services. This outcome is likely because such goods can be imported from other mesoregions, unlike what occurs in the services sectors. Thus, for each job created in the high-technology sectors, less than one job is created in the low-high-technology sectors.
CONCLuSION
This study estimated the local employment multipliers between the industrial and services sectors for Brazilian mesoregions between 2000 and 2010. empirical evidence was found for an economically important and statistically significant local employment multiplier. A job opening in the industrial sectors of a Brazilian me-soregion results in the creation of approximately four jobs in the services sectors over the long term. When grouped into subsectors of high and low technological intensity, the estimated multipliers on services sectors were 6.94 and 6.81, respec-tively.
The existence of positive and high multipliers is not, by itself, a necessary or sufficient reason to argue that government incentives should be provided to the industrial sectors. The estimated effects were local; thus, the employment growth of a mesoregion via migration may bring on decreases in other places. Furthermore, even considering only local interests, caution is required for three reasons.
only average impacts. In practice, the multipliers vary according to the sector, the technology and the strategies of the benefited companies. Secondly, one must con-sider the trade-off between industry-oriented incentives, and other policies aiming job creation or welfare increases. Finally, the local conditions for attracting and retaining companies are decisive for the multiplier effects. Amenities, a favourable business environment, infrastructure and an elastic housing supply are factors that increase the impact of positive employment shocks on the local economy.
reFereNCeS
Bartik, T. J. (1991) “Who beneits from state and local economic development policies?” W.e. upjohn Institute for employment research.
Baum, Christopher F.; mark e. Schaffer, mark e.; Steven Stillman (2003) “Instrumental variables and Gmm: estimation and testing”. Stata Journal, v. 3, n. 1, p. 1-31.
Baum, Christopher F.; mark e. Schaffer; Steven Stillman (2007) “enhanced routines for instrumental variables/Gmm estimation and testing”. Stata Journal, v. 7, n. 4, p. 465-506.
Beaudry, Paul; David A. Green, Benjamin Sand (2012) “Does industrial composition matter for wages? A test of search and bargaining theory”. Econometrica, v. 80, n. 3, p. 1.063-1.104.
Blanchard, Olivier Jean; Lawrence F. Katz (1992) “regional evolutions”. Brookings Papers on econo-mic Activity, n. 1, p. 1-75.
Blasio, Guido de; Carlo menon (2011) “Local effects of manufacturing employment growth in Italy”.
Giornale degli Economisti, v. 70, n. 3, p. 101-112.
Bonelli, r.; S. de A. Pessoa (2010) Desindustrialização no Brasil: um resumo da evidência. Texto para Discussão nº 7, Instituto Brasileiro de economia (IBre) da Fundação Getúlio Vargas (FGV), 2010.
Carvalho, A. r. ; A. N. Paixão; Bernardo Campolina (2013) “Clusterização e localização da indústria de transformação no Brasil”. Revista Econômica do Nordeste, v. 4, p. 20-40.
Carvalho, Daniel r.; Jean N. Lee (2013) Cross-Industry interlinkages in employment growth: eviden-ce from Brazil. unpublished manuscript available at: http://users.nber.org/~jnlee/12.21.2013.bra-zil.crossindustry.pdf.
Cavalcante, Luiz ricardo; Fernanda De Negri (2011) “Trajetória recente dos indicadores de inovação no Brasil”. Texto para Discussão nº 1.659, Instituto de Pesquisa econômica Aplicada (IPeA). Cruz, Bruno Oliveira; Iuri roberto Soares Santos(2011) “Dinâmica do emprego industrial no Brasil
entre 1990 e 2009: uma visão regional da desindustrialização”. Texto para Discussão nº 1.673, Instituto de Pesquisa econômica Aplicada (IPeA), 2011.
De Souza, Alexandre Batista; Carliton Vieira dos Santos (2011) : mudanças na composição da produ-ção agrícola paranaense no período 1990 a 2005: uma análise quantitativa do desempenho das principais culturas”. Revista Paranaense de Desenvolvimento-rPD, n. 116, p. 07-32.
Dunn, edgar S. (1960) “A statistical and analytical technique for regional analysis”. Papers in Regional Science, v. 6, n. 1, p. 97-112.
Fachinelli, Angel dos Santos et al.. (2014) multiplicador de emprego e salário: estudo comparativo para a região Sul e restante do Brasil em 1999 e 2004. Economia & Região, v. 2, n. 1, p. 122-145. Faggian, A.; B. Biagi (2003) “measuring regional multipliers: a comparison between two different
methodologies for the case of the Italian regions.” Scienze Regionali, n. 1, p. 33–59.
Faggio, Giulia; henry Overman (2014) “The effect of public sector employment on local labour ma-rkets”. Journal of Urban Economics, v. 79, p. 91-107.
Gonçalves Júnior, Carlos Alberto; rinaldo Aparecido Galete (2010) O método estrutural-diferencial: aplicação da adaptação de herzog e Olsen para a microrregião de maringá frente à economia paranaense 1994/2008. Informe Gepec, v. 14, n.2, p. 149-165.
Guilhoto, Joaquim J.m.; umberto Antonio Sesso Filho (2010) “estimação da matriz insumo-produto a partir de dados preliminares das contas nacionais: aplicação e análise de indicadores para o Brasil em 2005”. Economia & Tecnologia, Ano 6, v. 23.
haddad, Paulo roberto et al.. (1989) “economia regional: teorias e métodos de análise”. Banco do Nordeste do Brasil S.A., escritório Técnico de estudos econômicos do Nordeste.
Ilha, Adayr da Silva; rubia Cristina Wegner (2005) “emprego de mão-de-obra como medida de cresci-mento setorial nos municípios de Caxias do Sul e Santana do Livracresci-mento no período de 2000-2002: aplicação do método estrutural-diferencial modiicado”. 2o. encontro de economia
Gaú-cha da Fundação de economia e estatística, 2005.
Isles, K.S.; N. Cuthbert (1956) An Economic Survey of Northern Ireland. Belfast: h.m.S.O.
Koster, hans r. A. (2013) Rocketing Rents the Magnitude and Attenuation of Agglomeration Econo-mies in the Commercial Property Market. London, united Kingdom: Spatial economics research Centre, London School of economics (LSe).
Lall, Sanjaya (2000) “The technological structure and performance of developing country manufactu-red exports, 1985-98”. Oxford Development Studies, v. 28, n. 3, p. 337-369.
Lamonica, m. T.; C. A. Feijó (2011) “Crescimento e industrialização no Brasil: uma interpretação à luz das propostas de Kaldor”. Revista de Economia Política, v. 31, n. 1, p. 118–138.
marconi, N.; m. rocha (2011) “Desindustrialização precoce e sobrevalorização da taxa de câmbio”. Texto para Discussão nº 1.681, Instituto de Pesquisa econômica Aplicada (IPeA), 2011. mardukhi, Jian (2010) “The general equilibrium wage impact of trade-induced shifts in industrial
compositions of employment in Brazilian cities, 1991-2000”. mPrA Paper No. 25916. https:// mpra.ub.uni-muenchen.de/25916/.
martins, Gilberto; Lúcia maria ramos Silva (2005) Análise das principais culturas de exportação e importação do nordeste do Brasil usando o modelo Shift-Share. Congresso da Sociedade Brasilei-ra de economia, AdministBrasilei-ração e Sociologia ruBrasilei-ral (SOBer), 2005.
moretti, enrico; Per Thulin (2012) “Local multipliers and human capital in the uS and Sweden”. re-search Institute of Industrial economics. Institute of Industrial economics Working Paper n. 914. moretti, enrico (2010) “Local multipliers”. The American Economic Review, v. 100, n. 2, p. 373-377. Nassif, A. (2008) “há evidências de desindustrialização no Brasil?” Revista de Economia Política, v. 28,
n. 1, p. 72–96.
Oreiro, J. L.; C. A. Feijó (2010) “Desindustrialização: conceituação, causas, efeitos eo caso brasileiro”.
Revista de Economia Política, v. 30, n. 2, p. 219–232.
Pereira, Wellington; João Furtado; Gabriel Porcile (2011) “Competitividade internacional e tecnologia: uma análise da estrutura das exportações brasileiras”. Revista Economia e Sociedade, v. 43, n. 3, p. 501-531.
Saboia, J. (2013) “A continuidade do processo de desconcentração regional da indústria brasileira nos anos 2000”. Nova Economia, v. 23, n. 2.
Santos, Sandro rogério dos (2000) “O método estrutural-diferencial ampliado: uma aplicação para a região Sul frente à economia do rio Grande do Sul, entre 1986 e 1995”f . Economia e Desenvol-vimento, n. 12.
Souza, Nali de Jesus; matheus Pinheiro da Fontoura rodrigues (2011) “Da evolução do emprego dos setores econômicos dos Coredes do rio Grande Do Sul, 1990/2000”. Disponível em: http://www. nalijsouza.web.br.com/coredes_rs.pdf. Acessado em: setembro/2013.