to r. u fc. b r 1984-2201
Copyright © 2002, Universidade Federal do Ceará
THE SPACES OF RISK TO HEALTH RESULTING
FROM ATMOSPHERIC POLLUTION
ABSTRACT
The air quality in the metropolitan region of Rio de Janeiro (MRRJ) is compromised due to the presence of the second largest concentration of sources of air pollutants in the country, potentiated by the relief that interferes with the transport of atmospheric pollutants, forming areas with distinct concentrations. Despite this, MRRJ has received major projects such as the Rio de Janeiro Petrochemical Complex (COMPERJ) and the Companhia Siderúrgica do Atlântico (CSA), as well as many other industries attracted by the new BR493 highway, the Metropolitan Arc. Thus, the objective of this work is to identify areas of risk to human health, that is, the areas that most concentrate air pollutants and that are inhabited by a more vulnerable population. The methodology uses the ArcGis software to create maps of the areas with diiculties in dispersing atmospheric pollutants and of the vulnerability of the population, so that when they are overlaid a map is created showing the spaces of risk to health. The results show that the risk areas are precisely in the municipalities of the MRRJ that have received the most new ventures, which may exacerbate the health risk of the population.
Keywords: Air Basin; Particulate Material; Social Vulnerability.
RESUMO/ RESUMEN
ESPAÇOS DE RISCO À SAÚDE EM CONSEQUÊNCIA DA POLUIÇÃO ATMOSFÉRICA
A região metropolitana do Rio de Janeiro (RMRJ) tem a qualidade do ar comprometida devido à grande concentração de fontes de poluentes atmosféricos e ao relevo que interfere no transporte desses poluentes. Apesar disso a RMRJ vem recebendo grandes empreendimentos, inclusive industriais, atraídos pela nova rodovia BR493, o Arco Metropolitano. Assim, o objetivo deste trabalho é identiicar os espaços de risco à saúde, as áreas que mais concentram poluentes atmosféricos e que são habitadas por uma população mais vulnerável. A metodologia utiliza o software ArcGis para criar mapas sobre as áreas com diiculdades em dispersar poluentes atmosféricos e sobre a vulnerabilidade da população que ao serem cruzados permitem obter o mapa dos espaços de risco à saúde. Os resultados mostram que os espaços de risco estão justamente nos municípios da RMRJ que mais têm recebido novos empreendimentos.
Palavras-chave: Bacia Aérea; Material Particulado; Vulnerabilidade Social.
ESPACIOS DE RIESGO A LA SALUD EN CONSECUENCIA DE LA CONTAMINACIÓN ATMOSFÉRICA
La región metropolitana de Río de Janeiro tiene la calidad del aire comprometida debido a la gran concen-tración de fuentes de contaminantes y las montañas que interierem en el transporte de esos contaminantes. A pesar de ello viene recibiendo grandes emprendimientos, incluso industriales, atraídos por la carretera BR493, el Arco Metropolitano. Así, el objetivo de este trabajo es identiicar los espacios de riesgo, las áreas que más concentran contaminantes atmosféricos y que son habitadas por una población más vulnerable. La metodología utiliza el software ArcGis para crear mapas de las áreas con diicultades en dispersar contaminantes atmosféricos y de la vulnerabilidad de la población que al ser cruzados permiten obtener el mapa de los espacios de riesgo. Los resultados muestran que los espacios de riesgo están justamente en los municipios que más han recibido nuevos emprendimientos.
Palabras clave: Contaminación del aire; Riesgo; Vulnerabilidad social. .
(*) CORRESPONDING AUTHOR
Address: UFRRJ, Departamento de Geograia , BR-465, Km 7, Prédio das Geociências, bairro UFRRJ, Município de Seropédica, Rio de Janeiro, Brasil. CEP 23.897-000. Tels (+ 55 21) 3787-3673 / 2681-4943
E-mail: heisofa@gmail.com A rti cl e h is tor y: Re ce ive
d 5 O
ct obe r, 2017 A cc ept
ed 30 O
ct
obe
r, 2017
Publ
ishe
r 30 N
ove
m
be
r, 2017
(a) Phd in Geography, Professor of the Federal Rural University of Rio de Janeiro (UFRRJ). http://lattes.cnpq.br/3096676935395245
w
w
w
.me
rca
to
INTRODUCTION
Since 2007, when the federal government announced the construction of the Metropolitan Arch as one of the works of the Growth Acceleration Program (PAC), there have been high expectations regarding the economic recovery of the State of Rio de Janeiro in the national scenario. The Metro-politan Arch is a highway created to connect the municipalities of the metroMetro-politan region of Rio de Janeiro (MRRJ) and the federal highways that go there (BR-101, BR-465, BR-116, BR-040), giving access to the Port of Itaguaí. This highway circumvents the MRRJ, bypassing the city of Rio de Janeiro, preventing a heavy low of trucks circulating in the capital.
The MRRJ has a population of more than 12 million people, around 74% of the entire State, with 52% of this population living in the municipality of Rio de Janeiro. These data indicate the existence of an intense polarization in the metropolitan region, and especially in its nucleus. In the country, it is the metropolitan region that has the greatest economic and demographic concentration, justiied by the great concentration of capital, infrastructure and the workforce. However, this space is marked by great social contradictions, since economic growth does not always meet the basic needs of the population. This is materialized in the space when there is an unequal distribution of urban services and facilities; a growing demand for housing, due to the expansion of favelas or the lack of public safety, demonstrated by high crime rates.
The municipalities of Rio de Janeiro and Niterói, the present and the former capitals of the State of Rio de Janeiro, have the best social indicators, as well as the best conditions to attract new investments in the whole of the State of Rio de Janeiro. The municipalities of the Baixada Flumi-nense (Seropédica, Japeri, Queimados, Nova Iguaçu, Mesquita, Belford Roxo, Nilópolis, São João de Meriti and Duque de Caxias) make up the periphery Rio de Janeiro’s metropolis, where 27% of the population of the Metropolitan region live. These are municipalities that have industrial concentrations, but are still characterized as dormitory cities with deiciencies in basic sanitation, housing, education and health, besides employment.
The great diference between the municipalities of Rio de Janeiro and Niterói and the Baixada Fluminense is the result of the merger of two very diferent states in economic terms, Rio de Janeiro State and Guanabara State (the former Federal District) in 1975, which contributed to the worsening of the crisis that was already afecting Rio de Janeiro’s economy in the 1970s and 1980s, due to the loss of the federal capital (SANTOS, 2003). The Metropolitan Arch was a project designed in the 1970s to overcome these diferences and promote the integration of the new State of Rio de Janeiro. Therefore, the completion of the work more than 40 years after its idealization is perceived as the opportunity for the State of Rio de Janeiro to regain its power to attract investment.
The Metropolitan Arch (BR-493) was inaugurated in July 2014 and with it came heavy industries, such as the Rio de Janeiro Petrochemical Complex (COMPERJ) in Itaboraí and the Companhia Siderúrgica do Atlântico (CSA) in the capital, as well as many other companies from diferent branches that were established in the vicinity of the highway, promoting a new industrial revolution in Rio de Janeiro (OLIVEIRA and ROCHA, 2012).
However, if investments of this size bring the hope of a strong economic recovery, it should be noted that they also bring high environmental costs. In the plain occupied by the MRRJ, which is surrounded by the Serra do Mar that with an average altitude of 900 meters, there are also some coastal massifs. The three largest - Tijuca, Pedra Branca and Gericinó-Mendanha - are higher than 900 meters, and are located in the city of Rio de Janeiro. Thus, it can be said that the topography of the MRRJ imposes resistance to atmospheric runof, reduces wind speed and prevents sea breezes from reaching certain points in the interior of the continent, contributing to the stagnation of pollu-tants in some neighborhoods and municipalities (FARIAS, 2013; OLIVEIRA, 2004).
to
r.
u
fc.
b
r
de Janeiro the massifs act as physical barriers to prevailing winds, consequently Inea divides the MRRJ into four sub-regions, also called air basins, when analyzing the air quality (FEEMA, 2004; INEA, 2009). The MRRJ has four air basins with compromised air quality due to the presence of the second largest concentration of industries, vehicles, and other sources of air pollutants in the country (FARIAS, 2013).
Air Basin IV, east of Guanabara Bay, is the largest, however, it is the location of the municipa-lities with the smallest populations and the fewest businesses (except for Niterói and São Gonçalo), despite the arrival of COMPERJ, which is not yet in operation. Consequently, it is the least polluted of the largest basins. Air Basin III is where the North Zone of Rio de Janeiro is located and has the most populous and industrialized municipalities of the Baixada Fluminense, like Nova Iguaçu, Belford Roxo and Duque de Caxias; it is the most polluted air basin. Air Basin II is the smallest of the four and comprises the most upmarket part of the West Zone of Rio de Janeiro - such as Barra da Tijuca, an area of strong real estate expansion, where most of the Olympic facilities are located. Air Basin I, at the extreme west of the MRRJ, is also heavily polluted due to the location of the Santa Cruz industrial district and more recently the CSA, as well as municipalities that have received more investments due to the presence of the Metropolitan Arch and Itaguaí Port, such as Seropédica, Japeri, Queimados and Itaguaí.
This is noteworthy because the air basins that emit the most air pollutants are also where the most populous municipalities of the MRRJ are located. As a consequence of their productive spa-tial reconiguration, they will tend to have larger increases in atmospheric pollutants in the coming years. Thus, the objective of this work is to identify the areas that emit and concentrate atmospheric pollutants, which are the most vulnerable and susceptible to the efects of this pollution and where they are located. By combining this information, the spaces of risk will be identiied.
SPACES OF RISK
In the last few decades the health system has radically changed its way of thinking and acting, which has been relected in the reorientation of its guiding axes. In designing the health-disease process, there is less focus on the disease and the individual, whereas the quality of life of the environment and collective health are observed more closely (TEIXEIRA; PAIM; VILASBÔAS, 1998). Thus, when making a geographic approach of social reality it is necessary to start from the concept of space, conceived as the locus of reproduction of the social relationships of production, where society only becomes concrete through the space it produces, just as space is only intelligible through the society that produced it (CORRÊA, 1995).
Space is constructed by social relations in the process of social reproduction and therefore re-lects the division of labor, the division into classes, power relations, centrality and marginalization, diferences, inequalities and injustices of the distribution of resources and wealth, the products of collective work, and the contradictions of this process (Santos, 1979). The urban space of the ca-pitalist city, which is a relection of the social structure, is divided into segregated residential areas with diferent rhythms and natures of changeability, as a result of their social-spatial diversity: “... the presence of the poor increases and enriches social-spatial diversity, manifest by both the produc-tion of materiality in such contrasting neighborhoods and sites, and by the forms of work and life “(SANTOS, 1996, p.323). Thus, space is a means of identifying the vulnerability of social groups.
w
w
w
.me
rca
to a diferentiated exposure to the levels of risk (VEYRET, 2007). However, when it comes to the
atmosphere, a luid where the pollutants are transported more freely, the risks cease to be speciic to one social class and can become a threat to all. Even so, the rich are able to minimize the risks, whether by their choice of a place to live, an enhanced diet, access to medicines or even information. The poorest have no choice, leaving them with degraded areas where the risks are greatest. With less instruction and less clariication, they ind it more diicult to access information.
The diagnoses of the quality of life of the population are usually presented in the form of maps and clearly allow the visualization of the areas where basic needs are not met, from the composi-tion of social indicators. This technique has been used to assist the management and applicacomposi-tion of public policies in large Brazilian cities, there is a tendency to use census tracts as a spatial unit of calculation (VITTE and KEINERT, 2009).
POPULATION MOST VULNERABLE
TO THE EFFECTS OF AIR POLLUTION
To trace the proile of the population most vulnerable to the efects of air pollution, we turned to medical literature. It suggests that even at low concentrations atmospheric pollutants are associated with harmful efects on health (SCHWARTZ, 2004; SCHWARTZ and DOCKERY, 1992). There is a group of universally recognized pollutants that act as indicators of air quality due to their higher emissions, as well as the adverse efects they cause to the environment. Among them is particulate material, which is considered quite dangerous.
Particulate matter is the denomination of a set of pollutants consisting of dust, smoke and all kinds of solid and liquid materials that remain suspended in the atmosphere due to their light weight. The composition and size of the particle depends on the emission source, and can be natural, such as soil dust or volcanic ash, but is mainly anthropic formed by the ashes of combustion processes, dust generated by agriculture, industries and vehicles. Greater control of particles smaller than or equal to 10 μm (PM10), also called inhalable particles, is necessary. Due to their size, they can reach the inferior airways directly, transporting adsorbed gases on their surface (CANÇADO; BRAGA; PEREIRA; ARBEX; SALDIVA; SANTOS, 2006).
Several studies indicate that particulate matter has a strong inluence on population morbidity and mortality even when the mean concentrations are within the international air quality standards (DAUMAS; MENDONÇA; LEON, 2004). The worst hit are children and the elderly, a fact already veriied in countries in Europe (CLANCY; GOODMAN; SINCLAIR; DOCKERY, 2002; GERVOIS, M.; DUBOIS; GERVOIS, S.; QUÉ-TÚ; MULLER; VOISIN, 1977), North America (JACOBSON, 1984; LEVY; GENT; NEWHOUSE, 1977; MAZUMDAR and SUSSMAN, 1983; SCHIMMEL and MURAWSKI, 1976), South America (BORJA-ABURTO; LOOMIS; BANGDIWALA; SHY; RASCON-PACHECO, 1997; CIFUENTES; VEJA; KOPFER; LAVE, 2000; OSTRO; SANCHEZ; ARANDA; ESKELAND, 1996), including in Brazil (BRAGA; CONCEIÇÃO; PEREIRA, L.; KISHI; PEREIRA, J; ANDRADE, 1999; FREITAS; BREMNER; GOUVEIA; PEREIRA; SAL -DIVA, 2004; GOUVEIA and FLETCHER, 2000a; GOUVEIA and FLETCHER, 2000b; GOU-VEIA; FREITAS; MARTINS; MARCILIO, 2006; SALDIVA; POPE; SCHWARTZ; DOCKERY; LICHTENFELS; SALGE, 1995).
to
r.
u
fc.
b
r
It is important to highlight that although air quality may be worse in richer neighborhoods, which is not the norm, general mortality rates are correlated with poverty, lack of education and employment in rural areas (JACOBSON, 1984), afecting those who live close to their work and therefore spend more time exposed to particulate matter (GERVOIS, M., DUBOIS, GERVOIS, S.; QUÉ-TÚ; MULLER; VOISIN, 1977).
With this information, a synthetic index for the recognition of the inequalities of living and health conditions in the MRRJ, called the Condition of Life and Health Index (ICVS), was constructed. The indicators created, presented in table 1, use the census tract as a spatial unit and were based on data from the 2010 Demographic Census. The theoretical frame of reference was an adaptation of the proposal developed by Castellanos (1994) of the characteristics cited in the medical literature about the population groups more susceptible to the risks of morbidity and mortality.
Table 1 - The 4 dimensions and 9 indicators used in the construction of the ICVS
Dimension Indicator Assessing
Basic Sanitation
Percentage of households served by piped water from the general network.
Basic sanitation, determinant for the health conditions of the
population. Percentage of households with sanitary sewer connected to the general
network.
Percentage of households with garbage collected by a cleaning service.
Demography
Percentage of the population between 0 and 5 years old.
Population groups with less resistance to air pollution. Percentage of the population over 65 years old.
Income
Average income of heads of households. The power of consumption -
from food to medicines - that interferes with resistance to
pollution. Percentage of persons with incomes less than 2 minimum wages.
Education Percentage of the population with 10 years of age or more who are illiter
-ate.
The degree of education inlu -ences consciousness about
risk.
Source: Prepared by FARIAS, HS, 2012.
w
w
w
.me
rca
to Table 2 - UN criteria for classiication adapted to Living Condition
HDI Human Development Living Condition
Above 0,80 Very High Very Good
Between 0,70 and 0,79 High Good
Between 0,55 and 0,69 Medium Medium
Below 0,55 Low Bad
Source: Prepared by FARIAS, HS, 2012.
MAPPING THE LIVING CONDITION
The mapping of the living condition (Figure 1) shows that the population with a very good living conditions is located mainly in the municipalities of Niterói and Rio de Janeiro. The capital goes beyond the neighborhoods of the South Zone and Barra da Tijuca, that traditionally have a population with greater purchasing power. There are also areas in the Center, Zona Norte, Ilha do Governador, and also in some municipalities of Baixada Fluminense such as Nova Iguaçu, Nilópolis and São João de Meriti. This group is characterized by a lower percentage of children and elderly people in the population, high levels of income, education, and housing with a basic sanitation infrastructure.
Figure 1 - The spatialization of the Condition of Life and Health Index in the metropolitan region of Rio de Janeiro Source: Prepared by FARIAS, HS, 2012.
BR-to
r.
u
fc.
b
r
040 and BR-465 highways that cross Seropédica, Paracambi, Japeri, Queimados, Nova Iguaçu, Belford Roxo, Nilópolis, São João de Meriti, Duque de Caxias, Magé, Guapimirim, São Gonçalo, Itaboraí, Tanguá, Mesquita, Itaguaí and Maricá. This group is characterized by a lower percentage of children and elderly people in the population, high levels of income, education, and housing with a basic sanitation infrastructure.
The population with average living conditions is located near the central areas of the periphe-ral municipalities, as well as in the extreme West Zone of the city of Rio de Janeiro. This group is characterized by having an even higher percentage of children and the elderly in the population, average income levels, education or the housing has deicits in the basic sanitation infrastructure. On the other hand, the population with low living conditions, in the great majority, is located in the interior of the peripheral municipalities, that is, in the periphery of the periphery. This group is characterized by a higher percentage of children and elderly people in the population, low levels of income, education, and housing lacking a basic sanitation infrastructure.
The category Insuicient Data refers to census tracts with an absence of data in at least one of the indicators. In some cases, the IBGE omits information on family income, especially when the sector has few residents, so that the earnings are not easily deducted and there is conidentiality. The No Data category represents areas where there is no resident population, either because it is a rocky massif, a lagoon, an industrial area ... This was an option of the IBGE in the 2010 Census.
AREAS THAT LIBERATE AND ACCUMULATE
ATMOSPHERIC POLLUTANTS
For a long time, air pollution from cities was basically attributed to industrial emissions. Over the years, greater control of air quality has made environmental licensing compulsory, and a trend towards the modernization of industrial facilities has occurred, which have been able to reduce atmospheric emissions. On the other hand, the rapid growth of the vehicle leet has signiicantly increased the emission of pollutants into the atmosphere, and is now the main source of air quality degradation in the country’s metropolitan regions.
In this way, to identify the areas that most liberate and concentrate atmospheric pollutants the following parameters were considered: soil use, highways, industries, relief and air basins, at-tributing weights and percentage of inluence, according to the bibliography consulted (CHIESA; WESTPHAL; AKERMAN, 2008; FARIAS, 2013; GREGÓRIO, 2011; SOUZA and SANT’ANNA NETO, 2009).
The soil use parameter was the one that had the highest percentage of inluence in deining the areas of the city with the highest production of pollutants. In areas with a higher population density there are more vehicles circulating, so the maximum weight was attributed. In areas with medium and low densities there were fewer vehicles and the weighting decreased proportionally. Areas that are not inhabited received a minimal weight - rock, tree vegetation and ield.
Industries are responsible for less air pollution than vehicles, 23% and 77% respectively (INEA, 2009), so they have a lower percentage of inluence in the production of pollutants (20%). The areas close to the industries are more exposed to pollution, a radius of 1 kilometer is considered for those areas, which received the maximum weight for the concentration of pollutants. The areas more than 5 kilometers away received the minimal weight, because as the distance from the indus -try increases, pollutants disperse. The types of indus-try were also considered, greater weight was given to the most polluting industrial activity - Industries of Energy Generation (Thermoelectric) and Petrochemicals - according to INEA (2009).
w
w
w
.me
rca
to
areas, where the low is more intense, they are accumulating weight and are considered as the areas of greatest emission within an area already evaluated as high emission of pollutants, while, when passing through non-urban areas, where the low is less, they are accumulating less weight.
The relief parameters and air basins received lower inluence percentages (15%), because although they are determinant for the concentration of pollutants, they are not emitters. The relief parameter attributed greater weight to the plains, considering also the slopes up to 100 meters, which form the air basins where pollutants tend to concentrate. Above 100 meters of altitude a minimum weight was assigned, since from this point the pollutants begin the process of dispersion.
The air basins were classiied based on the results of the wind circulation model (FARIAS, 2013). It was observed that in Air Basin I there is a greater diiculty of dispersion of pollutants, it has the greatest weight in this parameter. Air Basin III also received signiicant weight considering that it is the second most diicult in the dispersal of pollutants. On the other hand, Air Basins IV and II received the lowest weights because they presented less marked characteristics than the others.
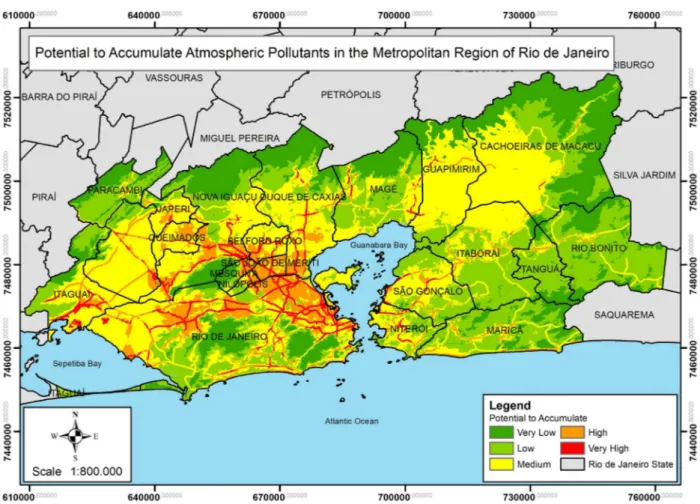
MAPPING THE POTENTIAL FOR
POLLUTANT CONCENTRATION
The mapping of the potential for pollutant concentration (Figure 2) shows that areas with very high potential are the main circulation routes that cross areas with high population density, in lo-wland areas located in air basins with diicult dispersion of pollutants. These areas were identiied along the BR-101, BR-116, BR-040 and BR-465 highways, in the municipality of Rio de Janeiro and in the Baixada Fluminense. There are also some occasional areas along roads in Niterói, São Gonçalo, Guapimirim and Magé.
to
r.
u
fc.
b
r
Areas with high potential to concentrate pollutants coincide with areas of high population density, such as the Northern Zone of Rio de Janeiro; mean population density with the inluence of industrial activity, such as São João de Meriti, Belford Roxo, Nilópolis, Mesquita and Nova Iguaçu municipalities, in the Baixada Fluminense; and a low population density with the inluence of high traic highways such as Niterói, São Gonçalo, Guapimirim, Magé, Seropédica and Itaguaí. These areas are also located in plains located in air basins with diiculties in dispersing pollutants.
With medium potential to concentrate pollutants are the plains at the bottom of the air basins, which, however, do not have industrial activity or circulation routes. The exception is the South Zone of Rio de Janeiro, which has a high population density and high vehicular traic, but is lo -cated on a narrow plain very close to the sea, which ensures the strong inluence of the sea breeze, alleviating the efects of air pollution.
The low potential for concentrating pollutants refers to areas where although the relief is lowland, land use is free from urbanization and interference from circulation routes. On the other hand, the very low potential to concentrate pollutants is restricted to areas of high relief where pollutants can be dispersed more easily, being unable to concentrate.
MAPPING OF AREAS OF RISK TO HEALTH
From the intersection of the information presented in the previous maps, organized in a Risk Matrix (Table 3), the categories used in the mapping of areas of risk to health are conceived. It is the result of the diference between the categories used in the maps of living conditions and areas with potential to concentrate atmospheric pollutants in the MRRJ, represented in ive risk categories.
In this way, the result of
• -3 or -4 means that the scenario is very bad, so the risk is very high; • -2 means the scenario is bad, so the risk is high;
• -1 means that the scenario is average, so the risk is average as well; • 0 means the scenario is good, so the risk is low;
• 1 to 3 means the scenario is very good, so the risk is very low; • 4 to 8 means no data.
Table 3 - Health risk matrix: relationship between living conditions and the potential of the area to emit / concentrate pollutants
Living
Condi-tion
Potential for Accumulation Air Pollutants Very Low
(1)
Low
(2)
Medium
(3)
High
(4)
Very High
(5)
Bad (1) 0 -1 -2 -3 -4
Medium (2) 1 0 -1 -2 -3
Good (3) 2 1 0 -1 -2
Very Good (4) 3 2 1 0 -1
w
w
w
.me
rca
to
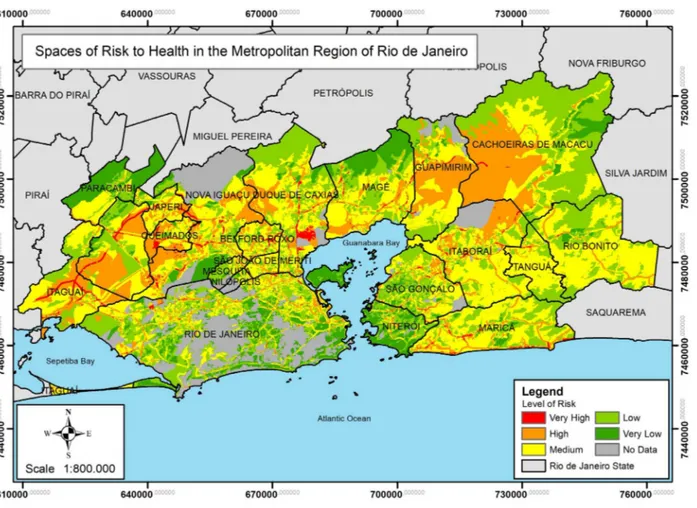
Thus, in the map of spaces of risk to health (Figure 3), the very high risk areas for health correspond to the very bad scenario, represented by the color red. These are areas where the very high concentration potential of pollutants and populations with low and medium life and health conditions coincide; or a high concentration potential of pollutants and a population with low living and health conditions. They are located in short extensions along highways near important indus-trial areas such as COMPERJ (Cachoeiras de Macacu and Itaboraí), REDUC (Duque de Caxias), Bayern (Belford Roxo), Thermoelectric (Queimados and Seropédica) and CSA (Itaguaí, Seropédica and Rio de Janeiro).
The spaces of high risk to health correspond to the bad scenario, and are represented by the color orange. These are areas where the average concentration potential of pollutants and the population with low living and health conditions coincide; or the high concentration potential of pollutants and the population with average life and health conditions; or the very high potential of concentration of pollutants and a population with good living and health conditions. They are very close to the spaces of very high risk to health, however they are larger. They are mainly located in the municipalities of the periphery, at the bottom of the air basins.
The spaces of average risk to health correspond to a reasonable scenario, and are represented by the yellow color. These are areas where the low concentration potential of pollutants and the population with low living and health conditions coincide; or the average concentration potential of pollutants and the population with average living and health conditions; or the high concentration potential of pollutants and population with good living and health conditions; or the very high po-tential of concentration of pollutants and a population with very good living and health conditions. They are present in all municipalities, but mostly in the eastern portion of the MRRJ, where there are fewer enterprises and less population (Maricá, Tanguá and Rio Bonito).
to
r.
u
fc.
b
r
Figure 3 - Spaces of health to risk in the metropolitan region of Rio de Janeiro Source: Prepared by FARIAS, HS, 2012.
The spaces of low risk to health correspond to the good scenario, and are represented by the light green color. These are areas where the very low potential of concentration of pollutants and the population coincides with average, good and very good living and health conditions; or the low potential of concentration of pollutants and a population with good living and health conditions; or the average concentration potential of pollutants and a population with very good living and health conditions. They are close to the areas where the low health risks were described, being even more restricted to the municipalities of Niterói and Rio de Janeiro, but also in Paracambi and Magé, as well as in Rio Bonito and Cachoeiras de Macacu.
The areas with no data on health risks are those where there was absence of data in at least one of the indicators or an absence of a population residing in the mapping of living and health conditions.
FINAL CONSIDERATIONS
w
w
w
.me
rca
to
Thus, it is concluded that the enterprises brought in to leverage the economic recovery of Rio de Janeiro are located in areas of high (COMPERJ) and very high (CSA and Metropolitan Arch) risk for the health of the population, not only for the CSA and COMPERJ industries, but also be-cause they are located in areas with medium, high and very high potential to concentrate pollutants, where the population is living with vulnerable health and living conditions, which makes the risks even greater.
The CSA is located in Air Basin I, which has a greater diiculty in dispersing pollutants and where there are already many industries. Although population density is low around the CSA, there is a large percentage of vulnerable population in the areas nearby, and there is a greater risk of the population developing respiratory problems related to poor air quality.
The COMPERJ is located in Air Basin IV, which has a greater facility to disperse pollutants in relation to the others. In addition, the enterprise is in a vegetated area away from the urban areas, which are also of low population density, although the proportion of the vulnerable population is large. Thus, it can be said that the location of the COMPERJ is less problematic than the location of the CSA. However, because it is in a basin with a much lower emission of pollutants, the full operation of COMPERJ will inluence local air quality.
BIBLIOGRAPHIC REFERENCE
ARBEX, M. A.; BOHM, G. M.; SALDIVA, P. H. N.; CONCEIÇÃO, G. M.; POPE, A. C.; BRAGA, A. L.
Assessment of the efects of sugar cane plantation burning on daily counts of inhalation therapy. J Air Waste
Manag Assoc, 50(10):1745-9, 2000.
BORJA-ABURTO, V. H.; LOOMIS, D. P.; BANGDIWALA, S. L.; SHY, C. M. & RASCON-PACHECO,
R. A. Ozone, suspended particulates, and daily mortality in Mexico City. American Journal of
Epidemio-logy, 145:258-68, 1997.
BRAGA, A. L.; CONCEIÇÃO, G. M.; PEREIRA L. A.; KISHI, H. S.; PEREIRA J. C. & ANDRADE, M.
F. Air pollution and pediatric respiratory hospital admissions in São Paulo, Brazil. Journal Environmental
Medicine, 1:95-102, 1999.
BRAGA, A. L. F.; PEREIRA L. A. A.; PROCÓPIO, M.; ANDRÉ, P. A. & SALDIVA, P. H. N. Associação
entre poluição atmosférica e doenças respiratórias e cardiovasculares na cidade de Itabira, Minas Gerais,
Brasil. Cad. Saúde Pública, Rio de Janeiro, 23 Sup 4:S570-S578, 2007.
CANÇADO, J. E. D.; SALDIVA, P. H. N.; PEREIRA, L. A. A.; LARA, L. B. L. S.; ARTAXO, P.; MARTI
-NELLI, L. A. ET AL. The Impact of Sugar Cane-Burning Emissions on the Respiratory System of Children
and the Elderly. Environ Health Perspect, 114:725-729, 2006.
CANÇADO, J. E. D.; BRAGA, A.; PEREIRA, L. A. A.; ARBEX, M. A.; SALDIVA, P. H. N.; SANTOS, U.
P. Repercussões clínicas da exposição à poluição atmosférica. J Bras Pneumol, 32 (Supl2):S23-S29, 2006.
CASTELLANOS, P. L. Proyecto: sistemas nacionales de vigilancia de la situación de salud según
condi-ciones de vida y del impacto de las accondi-ciones de salud y bienestar. Washington: Organización Panamericana
de la Salud, 1994.
CHIESA, A.; WESTPHAL, M.; AKERMAN, M.. Doenças respiratórias agudas: um estudo das desigualdades
em saúde. Cad. Saúde Pública, Rio de Janeiro, 24(1):55-69, jan, 2008.
CIFUENTES, L. A.; VEJA, J.; KOPFER, K. & LAVE, L. B. Efect of the ine fraction of particulate mat
-ter versus the coarse mass and other pollutants on daily mortality in Santiago, Chile. J Air Waste Manag
Assoc, 50:1287-98, 2000.
CLANCY L., GOODMAN P., SINCLAIR H., DOCKERY D. W. Efect of air-pollution control on death
rates in Dublin, Ireland: an intervention study. Lancet, Oxford, 360(9341):1210-4, 2002.
CORRÊA, R. L. Espaço, um conceito-chave da Geograia. In: CASTRO, I. E.; GOMES, P. C. C.; CORRÊA,
to
r.
u
fc.
b
r
DAUMAS, R. P.; MENDONÇA, G. A. S. & LEON, A. P. Poluição do ar e mortalidade em idosos no muni
-cípio do Rio de Janeiro: análise de série temporal. Cad. Saúde Pública, Rio de Janeiro; 20:311-319, 2004.
FARIAS, H.S. Espaços de Risco à Saúde Humana na Região Metropolitana do Rio de Janeiro: um
estudo das trajetórias de poluentes atmosféricos do Arco Metropolitano, CSA e COMPERJ. 2012. 149f. Tese (Doutorado em Geograia) – Universidade Federal Fluminense, Niterói, 2012.
FARIAS, H.S. Bacias aéreas: uma proposta metodológica para o estudo da qualidade do ar em áreas inluen
-ciadas pelo relevo. Revista Brasileira de Climatologia, Curitiba, Ano 9, Vol. 12, p. 48-60, JAN/JUL 2013.
FARIAS, H.S. Indicadores Sintéticos de Qualidade de Vida Aplicados na Região Metropolitana do Rio de
Janeiro: uma análise dos últimos Censos Demográicos – 2000/2010. Revista Continentes, Seropédica,
Ano 4, n.6, p. 6-26, 2015.
FEEMA – Fundação Estadual de Engenharia do Meio Ambiente. Inventário de fontes emissoras de
po-luentes atmosféricos da região metropolitana do Rio de Janeiro. Rio de Janeiro: FEEMA, 26p, 2004.
FREITAS, C.; BREMNER, S. A.; GOUVEIA, N.; PEREIRA, L. A. A. & SALDIVA, P. H. N. Internações
e óbitos e sua relação com a poluição atmosférica em São Paulo, 1993 a 1997. Revista de Saúde Pública,
São Paulo, 38(6):751-7, 2004.
GERVOIS, M.; DUBOIS, G.; GERVOIS, S.; QUÉ-TÚ, J-M.; MULLER A. & VOISIN, C. Pollution atmos
-phérique deniveau modéré et afections respiratoires d’origine banale. Enquête de Demain - Quiévrechain
(Nord.). Revue d’Epidemiologie et de Santé Publique, 25:195-207, 1977.
GOUVEIA, N. & FLETCHER, T. Time series analysis of air pollution and mortality: efects by cause, age
and socioeconomic status. J Epidemiol Community Health, 54:750-5, 2000a.
GOUVEIA, N. & FLETCHER, T. Respiratory diseases in children and outdoor air pollution in Sao Paulo,
Brazil: a time series analysis. Occup Environ Méd, 57:477-83, 2000b.
GOUVEIA, N.; FREITAS, C. U.; MARTINS, L. C.; MARCILIO, I. O. Hospitalizações por causas respira
-tórias e cardiovasculares associadas à contaminação atmosférica no Município de São Paulo, Brasil. Cad.
Saúde Pública, Rio de Janeiro, 22(12):2669-2677, 2006.
GREGÓRIO, L. S. Risco ambiental à saúde humana: um estudo aplicado aos efeitos da poluição
atmosfé-rica no Estado do Rio de Janeiro. 2011. 153f. Dissertação (Mestrado em Geograia) – Universidade Federal do Rio de Janeiro, Rio de Janeiro, 2011.
INEA – Instituto Estadual do Ambiente. Relatório Anual de Qualidade do Ar. Rio de Janeiro: INEA,
108p. 2009.
JACOBSON, B. S. The role of air pollution and other factors in local variations in general mortality and
cancer mortality. Archives of Environmental Health, 3: 306-313, 1984.
LEVY, D; GENT, M & NEWHOUSE, M. T. Relationship between acute respiratory illness air pollution
levels in a industrial city. American Review of Respiratory Diseases, 116: 167-173, 1977.
MAZUMDAR, S. & SUSSMAN, N. Relationships of air pollution to health: Results from the Pittsburgh
Study. Archives of Environmental Health, 38: 17-24, 1983.
OLIVEIRA, J. L. F. Análise espacial e modelagem atmosférica: contribuições ao gerenciamento da
qua-lidade do ar da bacia aérea III da região metropolitana do Rio de Janeiro. 2004. 144f. Tese (Doutorado em Ciências Atmosféricas) – COPPE – Universidade Federal do Rio de Janeiro, Rio de Janeiro, 2004.
OLIVEIRA, L. D.; ROCHA, A. S.. As Novas Dinâmicas Produtivas em curso na Baixada Fluminense: Bre
-ves apontamentos sobre uma nova Geograia da Indústria. Revista Pilares da História, Duque de Caxias,
v. Ano 11, p. 7-13, 2012.
OSTRO, B.; SANCHEZ, J. M.; ARANDA, C. & ESKELAND, G. S. Air pollution and mortality: results
from a study of Santiago, Chile. J Expo Anal Environ Epidemiol, 6:97-114, 1996.
PNUD – Programa das Nações Unidas para o Desenvolvimento. Relatório do Desenvolvimento Humano
2005. Lisboa: Ana Paula Faria Editora, 2005.
SALDIVA, P. H.; POPE, C. A.; SCHWARTZ, J.; DOCKERY, D. W.; LICHTENFELS, A. J. & SALGE,
J. Air pollution and mortality in elderly people: a time-series study in Sao Paulo, Brazil. Arch Environ
w
w
w
.me
rca
to
SANTOS, A. M. S. P. Economia, espaço e sociedade no Rio de Janeiro. Rio de Janeiro: Editora FGV.
228p, 2003.
SANTOS, M. O espaço dividido. Rio de Janeiro: Ed. Francisco Alves, 1979.
SANTOS, M. A natureza do espaço: técnica e tempo, razão e emoção. São Paulo: HUCITEC, 1996.
SCHWARTZ, J. & DOCKERY D. W. Increased mortality in Philadelphia associated with daily air pollution
concentrations. Am Rev Respir Dis; 145:600-4, 1992.
SCHWARTZ, J. Air pollution and children´s health. Pediatr, 113(Suppl 4):1037-43, 2004.
SCHIMMEL, H. & MURAWSKI, T. J. The relation of air pollution to mortality. Journal of Occupation
Medicine, 18: 316-333, 1976.
SOUZA, G. M. & SANT’ANNA NETO, J. L. Geograia da saúde climatologia médica: ensaios sobre a
relação clima e vulnerabilidade. Hygeia: Revista Brasileira de Geograia Médica e da Saúde, Uberlândia,
pp116-126, Jun/2009.
TEIXEIRA, C. F.; PAIM, J. S.; VILASBÔAS, A. L.. SUS, modelos assistenciais e vigilância da saúde.
Informe Epidemiológico do SUS, Brasília, VII(2): 8-28, 1998.
VEYRET, Y. & RICHEMOND, N. M. (org.) Os riscos: o homem como agressor e vítima do meio ambiente.
São Paulo: Contexto, 2007.
VITTE, C. C. S. & KEINERT, T. M. M. (orgs.). Qualidade de vida, planejamento e gestão urbana. Rio