to r. u fc. b r
EFFICIENCY OF THE CURVE NUMBER
METHOD OF RAINWATER RETENTION
(*)CORRESPONDING AUTHOR
Address: UFP, Departamento de Geograia - Centro Politécnico. CEP: 81531990, Curitiba (PR), Brazil. Tel: (+55 41) 33613450. E-mail: [email protected]
ABSTRACT
The present study presents the results of research whose main objective was to use hydrological data on low to verify the eiciency of the parameter curve number (CN) of rainwater retention in river basins on a regional scale, through multivariate statistical analysis, to contribute to the administration and management of water resources. The CN is part of the method of estimating low used by the Soil Conservation Service (SCS). This rainfall-runof model is used to estimate low in small river basins, based on soil data and the evolution of land use and occupation. The method was applied to 14 hydrographic sub-basins - PR, whose conluences coincide with the gauging stations, to set up the sampling points for the multivariate statistical analysis of canonical correlation. The result of the canonical correlation, represented by the canonical R was equal to 0.90 with canonical R2 equal to 0.81, chi-square (χ2) of 15.8577 and DF (degrees of freedom)
equal to 7, which is very signiicant and expresses a high correlation between the method and low rates. These results conirm the hypothesis that the CN can be validated by the low.
Keywords: Canonical correlation; River basins; Model validation.
RESUMO/ RESUMEN
EFICIÊNCIA DO MÉTODO “CURVE NUMBER” DE RETENÇÃO DE ÁGUAS PLUVIAIS
Resultados de um estudo cujo objetivo geral foi veriicar a eiciência, com dados hidrológicos de vazão, o parâmetro “curve number” (CN) de retenção de águas pluviais em bacias hidrográicas, na escala regional, através da análise estatística multivariada visando contribuir para a gestão e manejo dos recursos hídri-cos. O CN faz parte do método de estimativa de vazões do Soil Conservation Service (SCS), um modelo chuva-vazão que é utilizado para estimar vazões em pequenas bacias com base em dados pedológicas e de evolução de uso e ocupação do solo. O método foi aplicado em 14 sub-bacias hidrográicas – PR, cujo exutório coincidisse com as estações de coleta de vazão, visando compor os pontos amostrais para a análise estatística multivariada de correlação canônica. O resultado da correlação canônica, representada pelo R canônico foi igual a 0.90 com R2 canônico igual a 0.81, qui-quadrado (χ2) de 15.8577 e GL (graus
de liberdade) igual a 7, o que é muito signiicativo e expressa alta correlação entre o método e as vazões. Estes resultados conirmam a hipótese de que o CN pode ser validado pela vazão.
Palavras-chave: Correlação canônica; Bacias hidrográicas; Validação de modelo.
EFICIENCIA DEL MÉTODO “CURVE NUMBER” DE RETENCIÓN DE AGUA DE LLUVIA
Los resultados de un estudio cuyo objetivo general fue veriicar la eiciência, utilizando los datos de lujo hidrológicos, el parámetro “curve number” (CN) de retención de agua de lluvia en las cuencas hidrográicas, a escala regional, mediante un análisis estadístico multivariante, para contribuir a la gestión y manejo de los recursos hídricos. La CN es parte de la estimación de lujo del Soil Conservation Service (SCS), un modelo de precipitación-lujo que se utiliza para estimar los caudales en cuencas pequeñas con base en datos del suelo y evolución del uso y la ocupación. El método se aplicó a 14 sub-cuencas – PR, exutório que coincidió con la colección luyen estaciones, Para componer los puntos de muestreo para el análisis multivariante de correlación canónica. El resultado de la correlación canónica representado por R canónica fue igual a 0,90 con R2 canónica igual a 0,81, chi-cuadrado (χ2) de 15.8577 y GL (grados de libertad) igual a 7, que es muy signiicativo y expresó alta correlación entre las tasas de método y de lujo. Estos resultados conirman la hipótesis de que la CN puede ser validada por el lujo.
: Correlación canónica; Cuencas hidrográicas; Validación del modelo. 1984-2201
Copyright © 2002, Universidade Federal do Ceará
SOARES, Marcia Regina Gomes de Jesus;a * FIORI, Chisato Oka;b
SILVEIRA, Claudinei Taborda da;cKAVISKI, Eloy d
(a) Phd in Geography, Federal University of Paraná (UFPr). http://lattes.cnpq.br/1076345085840555
(b) Federal University of Paraná (UFPr). Phd in Geoscience, State University of São Paulo Júlio de Mesquita Filho (UNESP/RC). http://lattes.
cnpq.br/5447522894267625
(c) Lecteur and Phd in Geography, Federal University of Paraná (UFPr). http://lattes.cnpq.br/4436295285744827 (d) Lecteur and Phd in Engineering, Federal University of Paraná (UFPr). http://lattes.cnpq.br/3275560911057775
A rti cl e h is tor y: Re ce ive
d 4 M
ay
, 2016
A
cc
ept
ed 28 j
une
, 2016
Publ
ishe
r 15 j
anua
ry
w
w
w
.me
rca
to
INTRODUCTION
Information on land use is important to establish basin management policies as it relects the evolution of the occupation of its surface and conservation activities. This data includes key elements of the iniltration capacity and water retention of the runof in a basin, such as the type of use and ground cover. This research aimed to evaluate the eiciency and feasibility of using the CN parameter (curve-number) of the rainfall-runof model developed by the Soil Conservation Service (SCS), an agency of the Department of Agriculture of the United States of America (USDA). This parameter is often used to estimate lows in small basins based on data that can be derived from remote sensing and Geographic Information Systems. Furthermore, the temporal evolution of the rainwater retention potential of river basins through the study of use and ground cover, derived from satellite images for the management of water resources was also observed.
A simple and widely used method in hydrological models of river basins worldwide, the CN method has been used by researchers such as Hawkins, 1993; Jacobs; Srinivasan, 2005; Tedela et al., 2008; Santos et al, 2007; Banasik; Woodward 2010; Dog et al., 2011; and Araujo Neto et al. 2012. The SCS method is based on the concept that the supericial laminar low produced in a given event is a function of the total height of the precipitated sheet and the losses that occur primarily due to iniltration, plant interception and retention in depressions in the terrain (TYAGI et al., 2008).
However, when working with methods that assign numerical weights to generate matrices resulting from the interrelationship of important variables such as slope, soil types and land use, the veracity of these results is questionable.
Under this assumption, the motivation for the development of this research is based on the intention to examine low variables for the analysis and management of physical elements in the landscape and its processes, which is extremely necessary to reach signiicant results. There is also a concern to ascertain whether methods that are based on assigning numerical weights to arrive at generalizations about the areas studied are consistent with reality.
This research takes into account the physical variables of soil, geomorphology and the evolution of use and occupation that were confronted with data on low and rainfall in order to discover the extent to which CN can be considered an eicient method for hydrological surveying.
STUDY AREA
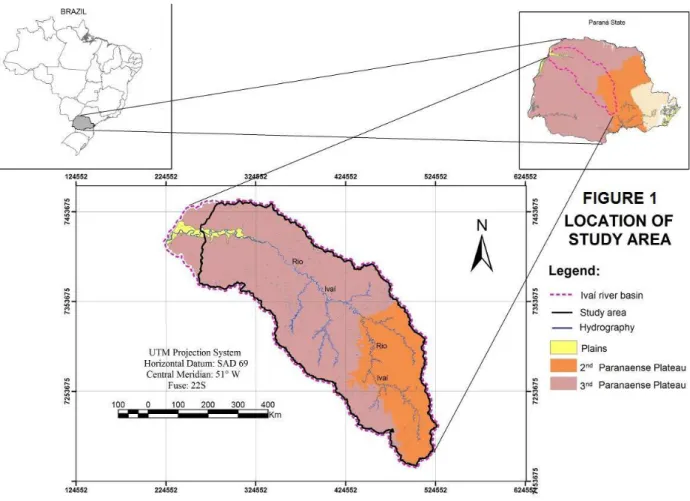
The study area of this research, the Ivaí river basin (Figure 1), was selected as it presents low and rainfall data that match the proposed objectives, as well as regional maps on a 1: 250,000 scale, in order to check if the method being analyzed is compatible with this scale, with the images in the raster format and the hydrological data.
The Ivaí basin, fully contained in the State of Paraná, in the regions comprising the second and third plateaus, it is located between the UTM coordinates 224,214.2 m and 7,465,630.6 m; 525,920.2 m and 7,170,625.7 m; it has a total area of 35,845 km2. However, it was necessary to reduce the study area from the total area of the basin (Figure 1), given that the last low collection station, right on the mouth of the Ivaí River, showed no consistent data and so had to be discarded, which reduced the study area to 34,419 km2.
The Ivaí River arises from the conluence of the Dos Patos and São João rivers, in the southern portion of the State of Paraná, speciically in the Serra da Boa Esperança region on the border of the municipalities of Prudentópolis and Ivaí (BALDO, 2006).
to
r.
u
fc.
b
r
Botucatu desert; the sandstone Caiuá Formation of the Bauru group; and in some places, partially covered by unconsolidated sediments (BALDO, 2006).
Figure 1 – Location of the study area: Ivaí River Basin – PR
According to Maack (1981), the orographic system of the Ivaí basin clearly shows the correla-tion between existing forms and the geological formacorrela-tion. Altitudes in the basin range from below 300 to over 1300 meters from the mouth to the source. The Ivaí River begins in the Second Plateau and cuts through the whole of the Third Plateau in a northwest direction.
As this basin has a large territory it also has a very wide range of soils. Among the most com-monly found are: Cambisols, Oxisols, Ultisols, Nitosols and Neosols, according to the classiica-tion of the Brazilian Agricultural Research Corporaclassiica-tion EMBRAPA (2008), updated from the data obtained from EMBRAPA (1984).
According to the Agronomical Institute of Paraná (IAPAR, 1994) the climate of the study area falls into in two main types; the irst is tropical and covers the lower reaches and the middle of the basin and the second is subtropical and comprises the upper reaches of the basin. In the lower Ivaí, the highest average total temperatures, above 22 ° C, occur in October, January and December, while the lowest, around 9 ° C, occur in August, July and April (Caramori, 1989) and are associated with the predominant type of soil cover, favoring the development of forest vegetation (Seasonal Semi-deciduous Forest and Mixed Ombrophile Forest).
MATERIAL AND METHODS
w
w
w
.me
rca
to
Using Landsat 5 satellite images and ensuring the same seasonality, the survey had a multi-temporal period of twenty-ive years (1986 and 2011). A supervised classiication of the multispectral images was carried out using the ENVI version 4.5 software developed by ENVI® (1997).
The classiier used was the Minimum Distance, which compared to the other alternatives (Pa-rallelogram, MAXVER, Mahalanobis, among others), presented the smallest confusion matrix. In this method the class models are characterized by spectral symmetry, where the minimum distance method assigns each unknown pixel to a class with the closest average. The categories of use adapted from the Technical Manual of Soil Use (IBGE, 2013) for this research were Water Bodies, Natural Forests and/or Forestry, Pasture, Agriculture and Urban Areas.
THE CURVE NUMBER METHOD OF THE SOIL
CONSERVATION SERVICE (SCS)
The Soil Conservation Service (SCS) of the United States Department of Agriculture has proposed a simpliied method for estimating runof in small rural basins. This estimate is based on data that are relatively easily obtained, such as land use and cover, rainfall and soil type. The method became popular in hydrological studies because of its easy application. Subsequently, ways of estimating the input parameters from satellite pictures have been proposed, such as the study by Ragan and Jackson (1980), which introduced an adaptation and simpliication of its parameters. The method is to estimate the efective rainfall (Equation 1), the portion of the volume precipitated that forms the surface runof, and with this supericial runof.
The efective rainfall is given by:
Q = ((P - 0.3s) 2) / (P 0.7s) (Equation 1)
Where,
Q = low time of the laminate in mm P = precipitation in mm
S = maximum charging capacity of the basin after a 5-day precipitation history, in mm
The maximum recharge capacity is associated with the physical characteristics of the basin, in terms of soil and vegetation cover (Equation 2).
S = (24500 / CN) - 254 (Equation 2)
For this calculation, the CN parameter, Curve Number, should be determined. This is a standard value that describes the combination of soil type, prior moisture and the use and cover in the basin.
As a basin does not have uniform characteristics in terms of soil and vegetation cover, the representative value of the basin can be obtained by weighting each value present in the basin area by the proportion of the area associated with the value:
��=∑ ����� � �=1
� (Equation 3)
Where
CN = curve number; A = area of the basin;
cn = curve number of a part of the basin;
to
r.
u
fc.
b
r
In this study, to derive the value of the CN parameter the associations between the classes of coverage and occupation obtained from the orbital images and the hydrological group of the soil were analyzed. For this hydrological classiication, the soil information used was provided by EMBRAPA (1984).
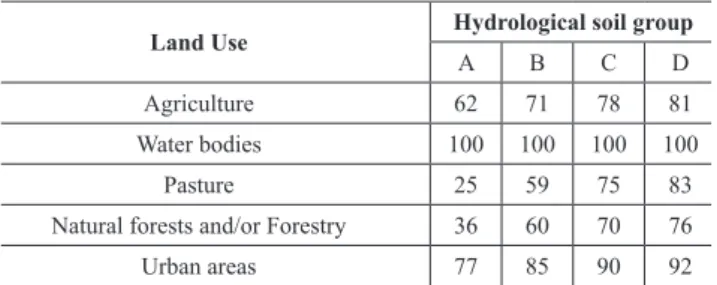
The original table of the SCS method is wide and has a large number of combinations. In the study by Ragan and Jackson (1980), this amount of possibilities was restricted due to the ability to map the cover using satellite images. Based on this simpliication, and considering the classes present in the study area, a simpliied table was proposed, according to Table 1:
Table 1 - SCS simpliied curve number CN
Land Use Hydrological soil group
A B C D
Agriculture 62 71 78 81
Water bodies 100 100 100 100
Pasture 25 59 75 83
Natural forests and/or Forestry 36 60 70 76
Urban areas 77 85 90 92
The duration curve is an important source pointing to potential water regulation, and it was produced by placing the daily low rates observed during the period considered in descending order. With the range of variation of low, the class intervals were deined and the intervals were placed in descending order and the number of events in each interval was checked against the absolute frequency. The relative frequency (absolute frequency/data number) was calculated for each interval and accumulated following the previous order. Charts were plotted with the lower limit of each range (ordinate) and the corresponding cumulative relative frequency (abscissa). The standard deviations were also calculated from the mean and coeicient of variation (ratio of standard deviation and mean).
The same procedure was applied to produce the annual maximum low and minimum of 7 days, 15 days, 30 days, 60 days and 90 days.
CANONICAL CORRELATION ANALYSIS (CCA)
The purpose of the canonical correlation is to simultaneously relate multiple independent and dependent variables. The canonical correlation measures the strength of the association between the two sets of variables. The strength of the relationship between pairs of variables is relected mainly by irst function canonical coeicients (R canonical). When squared (R2 canonical), these coei-cients represent the amount of variance in a linear compound of the canonical function assigned to another compound of the same function. The aim of the canonical correlation analysis is primarily to verify the association between two groups of variables, thus being able to relate certain hydro-logical data with variables that show the physical state of the river basin. It is the technique that yielded the best results, since the cluster analysis and factor analysis did not have positive results.
To carry out the multivariate statistical analysis, we used the free Statistical BioEstat 5.3 sof-tware (AYRES et al., 2007), developed by the Department of Statistics at the Federal University of Pará in Brazil.
w
w
w
.me
rca
to
RESULTS AND DISCUSSION
The result of the subdivision of the Ivai river basin into fourteen (14) sub-basins equivalent to 14 sampling points, as statistical data can be seen in Table 2.
The percentages of the areas are given in relation to sub-basin 14 whose conluence coincides with the last collection points of low of the study area. In addition to 1 to 5, the sub-basins that do not receive contributions from hydrographic areas from sub-basins upstream are 7, 10 and 13.
Table 2 – Ivaí river basin area per compartment
Compartmentalization Area (km2) Percentage (%)
Sub 1 1054.1 3
Sub 2 1089.6 3
Sub 3 3566.5 10
Sub 4 8545.2 25
Sub 5 2611.9 8
Sub 6 12703.8 37
Sub 7 3277.1 10
Sub 8 19436.1 56
Sub 9 1553.3 5
Sub 10 854.2 2
Sub 11 22498.5 65
Sub 12 28403.1 83
Sub 13 802.5 2
Sub 14 34419.3 100
Figure 2 shows the permanence curve of the average monthly low rates of the total area of this research (Sub-basin 14), i.e., the retention capacity of surface water and duration of low. It is also related to the frequency of occurrence of diferent magnitudes of low. These results are the average values in the time interval of 27 years, including the monthly data for the years 1985 to 2012, both for the duration curve, maximum, minimum, standard deviation and coeicient of variation. Since the average is a value that represents various others, often it is not suicient to evaluate a set of data. More steps are important, to show the diference (dispersion) that exists between the mean and the values of the set. Therefore this research is noteworthy for using the standard deviation and coeicient of variation in addition to mean values.
The duration curve of the low shows signiicant curvature (Figure 2). The shape of the curve has signiicance and relects the rate of low conditions in the basin and in the river channel. Accor-ding to Destefani (2005), the greater the curvature the greater the variability of the low caused by fast low rates and low low basis. Figure 2 shows this situation precisely for the Ivaí river basin,
as in approximately 10% of the total low time the low goes from 2,500 to 500 m3/s, a variation
to
r.
u
fc.
b
r
Figure 2 – Permanence curve.
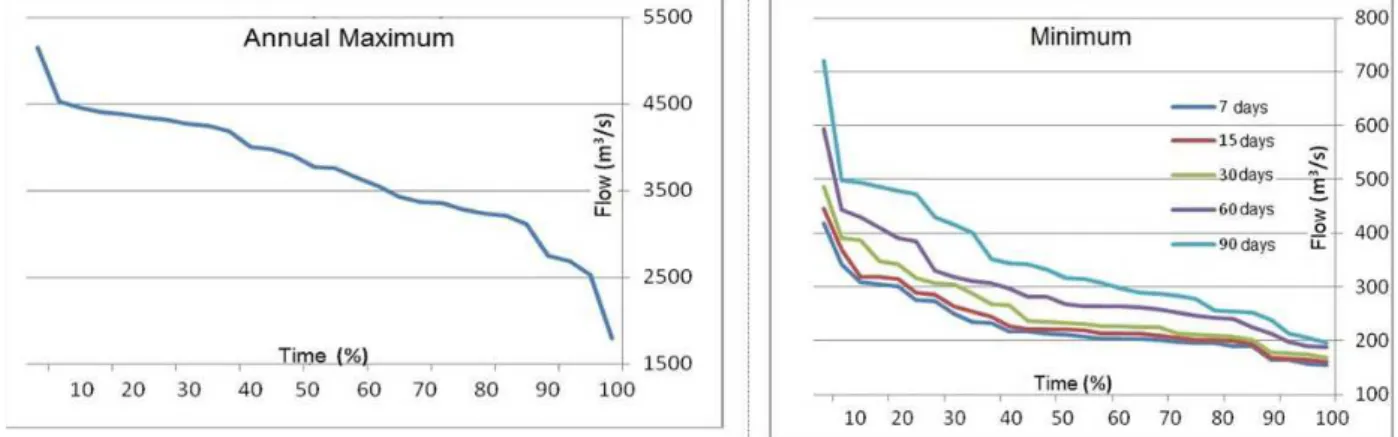
This condition has been noted for the Ivaí River, which has an extremely oscillatory river low with little contribution from the water table. This is observed during the very low lows during dry periods. These diferences are shown by the results of the low of the historical average: annual maximum and minimum for the same period, 1985-2012, shown in Figure 3.
Figure 3 – Average Daily Flows: Annual Maximum and Minimum of the Ivaí River Basin – PR. (1985-2012)
According to Destefani (2005), among the knowledge of the hydrological regime of river systems, high magnitude and intensity lows are receiving increased attention because it is during the period when rivers reach the high water phase that the most rapid and signiicant environmental changes have been found, from the geomorphological aspect (sculpturing and modiication of the bed forms, margins and even the plain), depending mainly on the ecological situation (connectivity between the channel and the plain) and the human context (loss of crops, destruction of homes and businesses, with material and often human losses). These aspects show that loods are hydrological events that can cause environmental and economic instability. The large magnitude lows have high water, discharge and volume levels that could cause looding. They are portrayed by lood and loo-ding events that difer mainly in their magnitude and efect, as the loods exceed the low capacity of the channel causing overlows and spreading water in low-lying areas adjacent to the channel.
w
w
w
.me
rca
to
to deine a wave or lood peak according to their research objectives. In general, monthly or yearly highs correspond to peak maximum discharge occurring during the months or years respectively, regardless whether it spreads as looding or not (Destefani, 2005).
As can be seen in Figure 3, the variation of the annual maximum occurs between 1,800 and
5,144 m3/ S, characteristic of the most natural regulation, presented by the shape of the curvature.
For the minimums, which represent the periods of drought, the duration curve has less inclination for the 7-day dry period and is more inclined in the 90-day dry period, with lower extreme values.
They varied 155-719 m3/s.
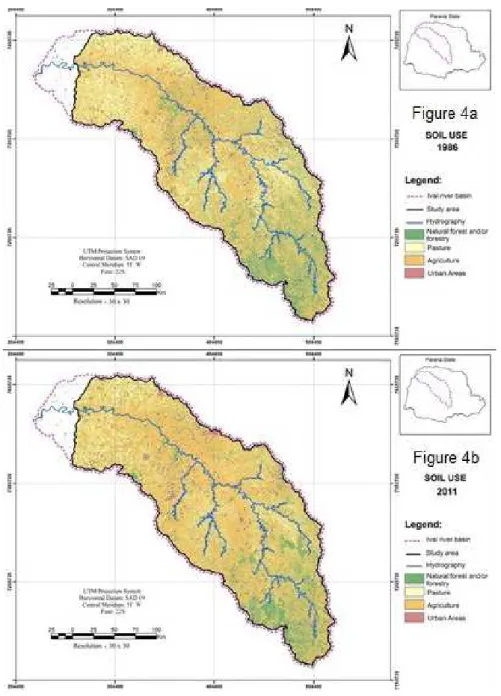
The total area of the basin comprises 34,419 km2. This area was classiied on two dates: 1986
and 2011, to verify the changes that can be observed in this period. The result of the classiication is shown in Figures 4a and 4b.
Figure 4 – Use and occupation: (a) - 1986 and (b) - 2011.
to
r.
u
fc.
b
r
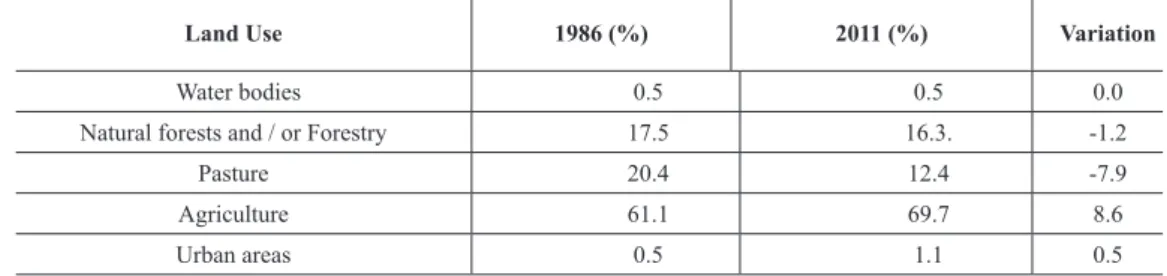
Table 3 – Evolution of the use and occupation of land in the Ivaí river basin, PR
Land Use 1986 (%) 2011 (%) Variation
Water bodies 0.5 0.5 0.0
Natural forests and / or Forestry 17.5 16.3. -1.2
Pasture 20.4 12.4 -7.9
Agriculture 61.1 69.7 8.6
Urban areas 0.5 1.1 0.5
It was found that the most signiicant occupations in the Ivaí river basin are agriculture and pasture concentrated throughout the area, especially in the central part toward the mouth of the main river and next the areas of natural forests, which are concentrated in the top, near the head water.
The soil type was derived from soil maps on a scale of 1: 250,000, EMBRAPA (1984). The pedological distribution of the study area is shown in Figure 5.
Figure 5 – Soil Map.
w
w
w
.me
rca
to
Figure 6 – Percentage of soil classes – Ivaí river basin, PR.
These data allowed the spatial distribution of the hydrological soil classiication to be deter-mined, as shown in Figure 7.
Figure 7 – Hydrological soil classiication.
to
r.
u
fc.
b
r
and consisted of more than 99% Neosols and less than half a percent of Gleysols and Organosols, which present characteristics of very impermeable soils with heavy clay.
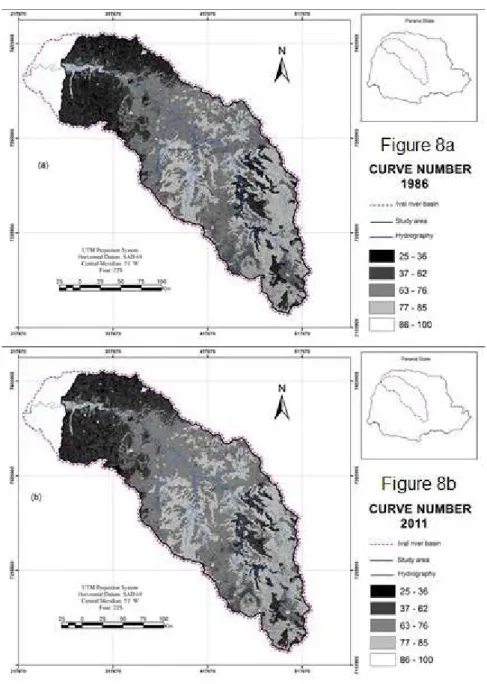
Using the factors shown in Table 1, it was possible to determine the values of the curve number (CN) for each pixel of the image and thus obtain the spatial distribution of the parameter in the basin on the two dates in question. The result is shown in Figure 8. Dark shades are associated with low values of the parameter, whereas light shades correspond to high values of the CN.
Comparing the igures of the two dates shows that in the northern part of the basin low CN values were replaced by higher values, relecting the expansion of agriculture (Figure 8).
Figure 8 – Maximum soil retention Map: (a) - 1986 and (b) - 2011.
w
w
w
.me
rca
to
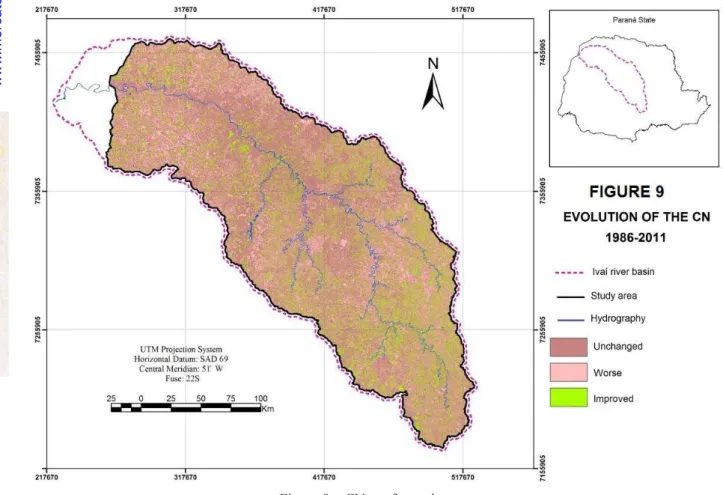
Figure 9 – CN confrontation map.
This analysis shows that a large part of the basin remains unchanged, that is, around 63% of the Ivaí basin area continues with the same CN value. It was also observed that 22% of the pixels relected the increase in the impermeability and 15% indicated a decrease (Figure 10).
Figure 10 – Permeability change from 1986 to 2011.
It was observed that the main cause of the increase in impermeability was that urbanization and agricultural use also increased 0.5% and 8.6% respectively in areas of fragile soils and high concentrations of clay, which favors runof over iniltration. Although the use of pasture decreased by 7.9%, the space was mostly illed by urban areas, resulting in an increased low curve, or the worsening of the CN values.
CN AVERAGE FOR SUB-BASIN
to
r.
u
fc.
b
r
Table 4 – Potential degradation by sub-basin - Ivaí river basin
Sub-basin year 1986 year 2011 CN Average (%)
CN (0-100%) CN (0-100%)
1 67 68 68
2 68 68 68
3 70 71 70
4 69 70 69
5 71 73 72
6 69 71 70
7 75 76 75
8 71 72 72
9 69 71 70
10 69 70 69
11 71 72 72
12 69 71 70
13 53 56 54
14 66 68 67
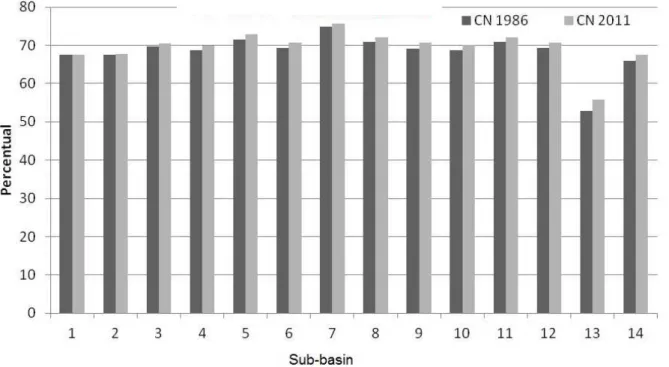
As can be seen from Table 4 and Figure 11, sub-basin 2 was the only one that did not show variations in the results of the CN in the years analyzed (1986 and 2011).
Figure 11 – Comparative data of the CN by sub-basin (1986 and 2011).
The sub-basin that had the lowest percentage of soil impermeability was 13 (emphasis mainly on the year 1986) and the sub-basins of the highest percentages of CN’s or low potential were 7, 5, 8 and 11. In general, the basin of the Ivaí River, represented by sub-basin 14, has the potential low of medium to high, with a percentage of 68 in 2011; this percentage declined in relation to 1986. These data were used to validate the method, discussed below.
CANONICAL CORRELATION ANALYSIS (CCA)
w
w
w
.me
rca
to
retention in hydrographic basins (second group of variables - CN). Thus, the group of dependent variables are 09: average low - Q (TP); maximum low rate - Q (max), the minimum low rates (7, 15, 30, 60 and 90 days), the standard deviation (STD) and the coeicient of variation (CV), for the average period 1985-2012.
Table 5 – Key hydrological parameters by sub-basin – Ivaí River PR
Sub-basin Q (TP) SD CV Q (max) Q (min7) Q (min15) Q (min30) Q (min60) Q (min90)
1 27.7. 26.88 0.92 291.7 3.6 4.1 5.0 6.7 9.3
2 26.6 24.89 0.86 286.5 3.7 4.2 5.1 6.6 9.3
3 23.1. 21.70 0.26 332.0 2.9 3.3 4.1 5.5 9.1
4 24.4 20.39 0.10 245.3 3.9 4.6 5.4 6.8 9.0
5 20.9 18.83 0.35 335.8 2.4 2.7 3.3 4.5 6.7
6 22.5 18.62 0.07 244.9 3.9 4.4 5.1 6.4 8.5
7 23.4 22.46 0.29 447.4 1.8 2.1 2.7 3.9 6.4
8 23.4 19.93 0.04 272.0 3.7 4.1 4.8 6.3 8.4
9 22.0 9.70 0.28 149.1 8.7 9.8 10.9 12.3 13.3
10 23.1. 10.06 0.51 89.0 8.2 9.6 11.2 13.2 14.6
11 22.6 16.82 0.03 206.8 5.1 5.5 6.2 7.6 9.6
12 20.2 14.13 0.02 152.6 5.6 6.0 6.6 7.8 9.5
13 17.4. 5.41. 0.39 76.3 10.8. 11.3. 11.8 12.7 13.3
14 19.6 12.53 0.02 107.5 6.7 7.0 7.6 8.7 10.1.
Key: Q = Flow; TP = Dwell Time; SD = Standard Deviation; CV = Coeicient of Variation; Q (max) = Maximum Annual Flow rates (mean values); Q (min) = minimum low rates (average values).
The results of the canonical correlation applied to the CN can be seen in Table 6 below.
Table 6 – Canonical correlation: CN related to low – Ivaí river basin.
R canonical R2 canonical Chi-square GL p-value
CN 0.90 0.81 15.8577 7 0.03
For the CN the result of canonical correlation, represented by R canon was equal to 0.90 with
high canonical R squared of 0.81, chi-square (χ2) of 15,857 and GL (Degrees of Freedom) equal to
7, which is very signiicant and expressed a high correlation between the method and low rates, especially as regards the coeicient of variation at p <0.05, which relates the standard deviation to the average. In addition, the minimum low of 30, 60 and 90 days were also explained by the CN with p <0.05. These results conirm the hypothesis that the CN can be validated by the low, because according to the results, they are not independent and are highly related (AYRES et al., 2007; BOGO et al., 2010).
FINAL CONSIDERATIONS
In conclusion, it is clear that CN methodology is a good tool to identify fragile areas and cons-traints when considering the evolution of land use and occupation by multi-temporal analysis. The main objective of the analysis of canonical correlation applied to the frequency matrix obtained through the database allows the association of the various types of low, with the CN method, thus being able to verify the eicacy of the method. The results of the analysis performed showed that:
1. The canonical correlations were high considering the level of signiicance of 5%;
to
r.
u
fc.
b
r
independent, that is, the groups considered are strongly correlated;
3. These results demonstrate that the CN method relects the reality of the physical elements of the landscape and its processes and that assigning numerical weights to arrive at generali-zations about the areas studied are consistent with reality.
The method permits the consideration of important variables for the analysis and management of physical elements of the landscape and its processes when working with sets of data, which is essential to obtain full and efective results.
BIBLIOGRAPHIC REFERENCES
ARAÚJO NETO, J. R.; PALÁCIO, H.; ANDRADE, E.; SANTOS, J.; PINHEIRO, E. Otimização do número de curva (CN-SCS) para diferentes manejos na região semiárida, Ceará, Brasil. Irriga, Botucatu, Edição Especial, p. 264 - 279, 2012.
AYRES, M., AYRES JR., M., AYRES, D. L., SANTOS, A. S. BioEstat. Versão 5.3, Sociedade Civil Ma-mirauá, MCT – CNPq, Belém, Pará, Brasil. 2007.
BALDO, M.C. Variabilidade pluviométrica e a dinâmica atmosférica na bacia hidrográica do rio Ivaí
– PR. Presidente Prudente, 2006. 172p. Tese (Doutorado em Geograia), Universidade Estadual Paulista. BANASIK, K.; WOODWARD, D. Empirical determination of runof curve number for a small agricultural watershed in Poland. 2nd Joint Federal Interagency Conference, Las Vegas, NV, June 27 - July 1, 2010. BOGO, R. L.; GRAMANI, L. M.; NETO, A. C.; BALBO, F. A. N. Análise de correlação canônica aplicada ao luxo de tráfego veicular – estudo de caso da rodovia federal BR-116. Asociación Argentina de Mecánica
Computacional. Vol. XXIX, p. 2071-2081. Buenos Aires, Argentina, 2010.
CAO, H.; VERVOORT, R. W.; DABNEY, S. M. Variation in curve numbers derived from plot runof data for New South Wales (Australia). Hydrological Processes, v. 25, p. 3774-3789, 2011.
CARAMORI, P. H. Caracterização Climática. In: Instituto Agronômico do Paraná. Potencial de Uso agrícola das áreas de várzea do Estado do Paraná: bacia hidrográica do baixo Ivaí. Boletim Técnico. Londrina, n.24, v.1, p.65-69, 1989.
DESTEFANI, E. V. Regime hidrológico do rio Ivaí - PR. Maringá, 2005. 93p. Dissertação (Mestrado em Geograia), Universidade Estadual de Maringá, 2005.
EMBRAPA. Centro Nacional de Pesquisa de Solos. Sistema brasileiro de classiicação de solos. Rio de Janeiro: Embrapa Solos, 2008.
EMBRAPA. Levantamento de reconhecimento dos solos do estado do Paraná. SLNCS, 1984.
ENVI®. Tutorials better solutions Consulting Limited Liability Company Lafayette. Colorado, USA, 370p., 1997.
HAWKINS, R. H. Asymptotic determination of curve numbers from data. Journal of Irrigation and Drainage Division, American Society of Civil Engineers, v. 119, n. 2, p. 334-345, 1993.
IAPAR – INSTITUTO AGRONÔMICO DO ESTADO DO PARANÁ. Cartas climáticas do Estado do
Paraná. Londrina, IAPAR, 1994. 49 p. (Documento, 18).
IBGE – INSTITUTO BRASILEIRO DE GEOGRAFIA E ESTATÍSTICA. Manual Técnico da Vegetação
Brasileira. Rio de Janeiro, 2013.
JACOBS, J. H.; SRINIVASAN, R. Efects of curve number modiication on runof estimation using WSR-88D rainfall data in Texas watersheds. Journal of Soil and Water Conservation, v. 60, n. 5, p. 274-279, 2005. MAACK, R. Geograia Física do Estado do Paraná. Rio de Janeiro: Livraria José Olympio Edit., 1981. RAGAN, R M.; T J JACKSON (1980). Runof Synthesis Using Landsat and SCS Model, Journal of
w
w
w
.me
rca
to
SANTOS. C. A. G.; VAJAPEYAM. R. M. S.; SRINIVASAN, S. Análise das perdas de água e solo em diferentes coberturas supericiais no semiárido da Paraíba. Revista OKARA: Geograia em debate, João Pessoa, v. 1, n. 1, p. 1-152, 2007.
TEDELA, N., MCCUTCHEON, S.; RASMUSSEN, T.; TOLLNER, W. Evaluation and Improvements
of the Curve Number Method of Hydrological Analysis on Selected Forested Watersheds of Georgia.
Report submitted to Georgia Water Resources Institute. Available at http:/water.usgs.gov/wrri/07grants/ progress/2007GA143B .pdf. Accessed 01 Agosto 2013. 2008.