© Science Publications, 2005
Corresponding Author: Dollaris R. Suhadi, Department of Environmental Management, Faculty of Environmental Studies, Universiti Putra Malaysia, 43400 UPM Serdang, Selangor, Malaysia
Tel: +60-12-2641 E-mail: DSuhadi@ssafara.net
Review of Photochemical Smog Pollution in Jakarta Metropolitan, Indonesia
Dollaris R. Suhadi, M. Awang, M.N. Hassan, Ramdzani Abdullah and Azizi Hj. Muda
Department of Environmental Management, Faculty of Environmental Studies,
Universiti Putra Malaysia, 43400 UPM Serdang, Selangor, Malaysia
Abstract: An analysis of photochemical smog pollution in Jakarta was attempted using data from the existing air quality monitoring stations. Ground-level ozone potential is high in Jakarta due to the high traffic emissions of ozone precursors and the favorable surface meteorological conditions. Despite the frequent missing data during the 1996-1999 monitoring, which resulted in lower ozone values, ozone episodes were significantly recorded in 1997-1998. The number of hours on which ozone concentrations exceed the 1-hour standard (100 ppb) at an ambient station located in Kelapa Gading (10 km northeast of city center) was 186 hrs in 1997 and 571 hrs in 1998. El Niño phenomenon in 1997-1998 had affected the local meteorology leading to more favorable conditions for photochemical production of ozone. The annual ozone averages in ambient stations located off the city center have exceeded the 1-year standard limit (15 ppb). Although the annual average and 95-percentile values indicated an increasing trend from 1996 to 1998, the trend remains to be seen in the future as more complete data could be expected from the new monitoring system. The number of hours on which ozone exceed the 1-hour standard and the annual average tend to be increasing since 2001 to 2002 in all 3 newly operated stations. The seasonal variations of ozone indicate that ozone level is highest in the dry season (September-November) and is lowest in the wet season (December-March). Correlation between ozone level and meteorological attributes (solar radiation, relative humidity and temperature) was significant at 0.01 confidence level. The diurnal cycle of ozone and its precursors is clearly shown and is typical for polluted urban areas. Improvement of the database of air quality monitoring is very critical for Jakarta. Through better database management, the development and monitoring of cost-effective air pollution control strategy can be made.
Key words: Ozone, Ozone Precursors, Traffic Emissions, Meteorological Conditions
INTRODUCTION
Photochemical smog is a condition that develops when primary pollutants (oxides of nitrogen-NOx and volatile
organic compounds-VOC created from burning of fossil fuels and biomass) interact in the presence of sunlight to produce a mixture of hazardous secondary pollutants [1]. The major constituent of photochemical smog is ground-level ozone (O3), which is not emitted
directly into the atmosphere but formed as the product of photochemical reactions of precursors, NOx and
VOC [2]. Basic photochemical cycle of NO, NO2 and
O3 involves the following reactions: when NO and NO2
are present in sunlight, ozone formation occurs as a result of the photolysis of NO2 at wavelength < 424 nm,
NO2 + hv NO + O (1)
O + O2 + M O3 + M (2)
where, M represents N2 or O2 or another third molecule
that absorbs the excess energy and thereby stabilize the O3 molecule. There are no other significant sources of
O3 in the atmosphere other than reaction (2). Once
formed, O3 reacts with NO to regenerate NO2.
O3 + NO NO2 + O2 (3)
Development of photochemical smog is typically associated with specific climatic conditions. Local meteorological factors that influence the formation of photochemical smog include solar radiation, cloud cover, temperature and precipitation. Other factors such as wind speed, mixing height and topography determine the dispersion of O3 in the boundary layer. High
temperatures are frequently associated with high pressure, stagnant conditions that lead to suppressed vertical mixing and increased O3 levels.
111 ozone can be quite evident because of the rapid reaction between O3 and NO.
This study reviews the status of photochemical smog pollution in Jakarta Metropolitan during a period of 7 years, 1996-2002 with focus on ozone and NOx
pollutants. Average monthly and diurnal concentrations of ozone and its precursor are also evaluated in relation to variations in meteorological conditions.
STUDY AREA AND DATA COLLECTION
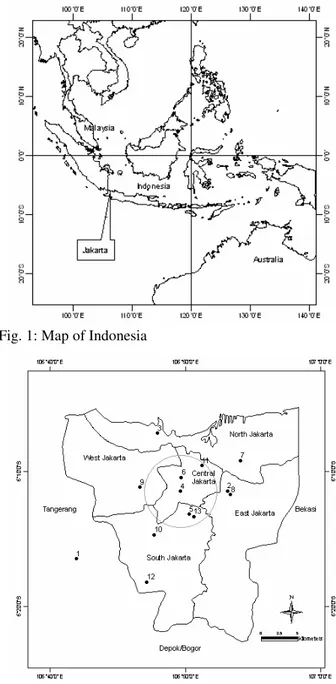
Jakarta is the capital city of Indonesia located in the northern part of Java Island, at 106° East and 6° South. The area of Jakarta is approximated at 664 square kilometers with flat topography, close to the shore and has an average elevation of 7 meter above sea level. Jakarta is part of the greater Jabodetabek (Jakarta, Bogor, Depok, Tangerang and Bekasi); bordering with Tangerang in the west, with Bogor and Depok in the south and Bekasi in the east. The total population of Jakarta was estimated at 9 million in 2002, whereas total population of Jabodetabek exceeded 22 million people in 2002. In the meantime, total commuters from Bodetabek to Jakarta today exceed 3 million everyday. Climate in Indonesia is largely influenced by monsoon systems, both Asia and Australian winter monsoons. During wet months (October-March), wind direction extends from west to southwest transporting moist air from Asia continent; while during dry months (April-September) wind direction is from north up to northeast which transports dry air from southern hemisphere. Besides the monsoon systems, the climate is also affected by global circulation occurring on a time scale of several years known as El Niño/Southern Oscillation (ENSO). In 1997, extreme meteorological values were recorded in Indonesia and the region as a result of ENSO phenomenon. The climate in Jakarta is very hot and humid. Because Jakarta lies so close to the equator, the solar heating during the day and the earth cooling during the night may produce local land-sea breeze. The winds are generally weak. Calm conditions often prevail at night. In the afternoon, winds are quite moderate because of the effects of local winds that modify the monsoon winds.
Jakarta has experienced serious air pollution problem, which is largely contributed from traffic sources accounting for approximately 70% of the total emissions. The vehicular emissions in Jakarta contributed 69% of total NOx emissions, whereas CO and HC emissions from vehicular sources amount to 564,000 ton and 98,000 ton per year respectively [3]. The data used for this study were collected from the Local Environmental Management Agency (BPLHD) of DKI Jakarta and the National Environmental Management Center (EMC). During a period of 1996-1999, data was supplied from an air quality monitoring network which comprises of 6 stations that monitor NOx, CO, PM10, NMHC, THC, O3 and SO2
parameters using designated absorption methods. In 2000, the prevailing stations were overhauled and
Fig. 1: Map of Indonesia
Fig. 2: The Area of Jakarta and Air Quality Monitoring Locations with Station No.4 Being Located in the City Center
replaced with the new monitoring stations, which are operated automatically from the central computers at the BPLHD. Two 2 new stations started operating in 2001 while the remaining 3 stations started operating in the following year. These new stations are equipped with measurement analyzers to monitor NO/ NO2, SO2,
CO, O3 and PM10. Specifically, hourly data of O3, NO,
NO2, CH4, NMHC and CO from both monitoring
112
Table 1: Monitoring Locations and Year of Data Recorded
Name Location 96 97 98 99 00 01 02
EMC (1) Serpong, southwest of Jakarta. No nearby specific emission sources. Pulogadung (2) East Jakarta, industrial park.
Pluit (3) North Jakarta, residential area.
Thamrin (4) Central Jakarta, at curbside near Thamrin roundabout. Casablanca (5) Central Jakarta, commercial and residential area. Gambir (6) Central Jakarta, at curbside.
Kelapa Gading (7) North Jakarta, residential area. Pulogadung* (8) East Jakarta, industrial park.
Kebon Jeruk* (9) West Jakarta, commercial and residential area. Senayan* (10) South Jakarta, commercial area
Kemayoran* (11) Central Jakarta, commercial area
Pondok Indah* (12) South Jakarta, commercial and residential area. BPLHD* (13) South/central Jakarta, commercial and residential area *New monitoring stations (2000-present)
Source: BPLHD DKI Jakarta, 2001
Table 2: Emission Standards for O3 and NO2 for Jakarta
1 hour 24 hour 1 year
NO2 400 µg m3(200 ppb) 92.5 µg m3 (50 ppb) 60 µg m3(30 ppb)
O3 200 µg m3(100 ppb) - 30 µg/m3(15 ppb)
Source: BPLHD DKI Jakarta, 2001
stations, which are equipped with basic meteorological sensors at 10 m height above the ground.
RESULTS AND DISCUSSION
Status of Ozone Pollution: Table 3 through 6 present a summary of ozone and NO2 pollution levels for Jakarta
during the four-year monitoring period from 1996 to 1999 and the two-year period from 2001 to 2002. In general, the highest ozone was found at ambient station number 7 (Kelapa Gading) located approximately 10 km northeast of the city center. The highest hourly maximum level was recorded at 964 ppb at this station. Although this figure looks highly suspicious as if someone was doing a range check on the ozone instrument, it was noted that the total number of hours on which ozone exceed the standard were quite high reaching 186 hrs and 570 hrs in 1997 and 1998 respectively. Station 7 also held the highest average hours per year of ozone exceeding the standard, followed with station 2 and 3. Where ozone data are available in 1996-1999, 1998 was characterized by the highest ozone values (average and 95 percentile) at station 2. At stations 3 and 7, the highest ozone values were recorded in 1997. The discussion on the relation between ozone episodes and the El Niño phenomenon during 1997-1998 is discussed later in the next section. Lower ozone was detected at curbside station 4 and ambient station 5 of which these stations are located closest to the city center. The major factor that caused low ozone values at these stations was due to destruction of ozone by NO. Since most of the NOx is
emitted in the form of NO, it can be expected that with high emission of NO from traffic in curbside station, ozone level becomes lower (reaction 3). The processes of destruction and formation of ozone in a large urban
Fig. 3: O3 Annual Trend Averaged for 3 Stations
(Station 2, 3 and 7)
area such as Jakarta should be competing at any location. Over the city, ozone level is found to be relatively high except at the very heavy traffic city center and curbside where the ozone destruction by NO is very apparent. However, it is very difficult to make further assessment as to the transport of ozone and its precursors over the larger area of Jakarta (beyond the 15 km perimeter of the city center) because all stations are located within.
Frequent missing data and limitation of the current two-year monitoring (2001-2002) make the assessment of ozone annual trend very premature. The initial ozone trend averaged for 3 ambient stations (station 2, 3 and 7) indicated an increase of ozone values from 1996 to 1999; but a substantial drop was noted from 1998 to 1999 (Fig. 3). The substantial drop of ozone level was significantly contributed from station 7. Thus, besides the low percentage of data completeness, other factors such as the change in meteorological conditions and in emission of O3 precursors in the upwind area of station
113
Table 3: Ozone Pollution Level Exceeding the Jakarta Air Quality Standard (1996-1999, 2001-2002)
Number of hours on which O3 exceeds the standard Hourly data count (% data completeness)
--- --- Station 1996 1997 1998 1999 2001 2002 1996 1997 1998 1999 2001 2002
Pulogadung (2)a 11 2 268 18 44% 74% 20% 17%
Pluit (3)b 5 42 3 1 83% 75% 22% 27%
Thamrin (4)c 1 0 * 0 94% 58% - 16%
Casablanca (5)d ** ** 0 0 - - 30% 95%
Gambir (6) ** ** ** ** - - - -
Kelapa Gading (7)e ** 186 567 2 - 23% 58% 68%
Pulogadung (8) 67 72 91% 85%
Kebon Jeruk (9)f 5 174 17% 84%
Senayan (10)g 44 190 28% 97%
aMissing data: June-November 1996; May-November 1998; January-February and April-July and November 1999 bMissing data: January and November 1997; July-December 1998; January-April and October-December 1999 cMissing data: April-July and December 1997; January-November 1999
dMissing data: January-August 1998
eMissing data: January-June and November-December 1997; September-December 1998; February-March, July, September and December
999
fMeasurement started in September 2001 g
Measurement started in August 2001. Missing data: December 2001 *No data available
**No measurement
Table 4: Average Number of Hours per Year on which Ozone Exceeds the Standard (100 ppb)
Station no.(1996-1999) Station no. (2001-2002) Pollution exceeding --- ---
the standard 2 3 4 5 6 7 8 9 10
Total hours 13 12 1 0 - 573 139 179 234
Average hours per year* 11 7.58 0.66 0 - 454.62 78.91 176.94 188.89 * Calculated based on available database
Station 2, station 3 and station 4 based on the two-year data (1996-1997) Station 5 based on the one-year data (1999)
Station7 based on the two-year data (1998-1999)
The assessment of ozone level in the background area (station 1) was not done due to unavailability of ozone data. It can be expected that O3 concentration in this
background area is fairly high. Rural environments tend to be characterized by relatively high VOC-to-NOx
ratios because of rapid removal of NOx from distant
sources compared to that of VOC [2]. In general, increasing VOC concentrations means more ozone. Transport of ozone from a very photochemically active source region (Jakarta urban center) is also a possible candidate of potential source of ozone enhancement in the background area.
For the current air quality monitoring which uses telemetric equipment, the number of hours on which ozone exceeds the standard indicated a steady increase since 2001 to 2002 in all three new stations. Although the trend remains to be seen in the future, the potential for ozone episodes in Jakarta metropolitan and its surrounding area of Bodetabek is very high. Given the fact that no counter measures are put in place to reduce air pollution at this time, an increasing trend of ground ozone pollution is very likely in the immediate future, as the emission of ozone precursors from traffic source remains high.
Ozone Seasonal Variations and Related Meteorological Conditions: Table 7 presents the total number of hours on which ozone exceeds 100 ppb at
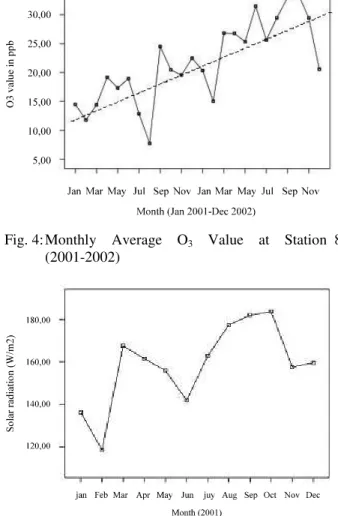
stations 2, 3 and 7. High ozone levels were generally recorded in May-September (dry months). Maximum monthly ozone averages at station 2 over 4 years were 47.28±11.49 ppb (in June 1996), 21.11±11.44 ppb (in May 1997), 148.92±201.02 ppb (in December 1998) and 72.61±14.3 ppb (in July 1999). At station 3, maximum monthly average was recorded in July 1996, July 1997, January 1998 and June 1999 with values of 22.78±19.32 ppb, 25.28±25.72 ppb, 19.83±21.60 ppb and 24.91±18.06 ppb respectively. Monitoring at station 7 showed highest monthly average in July 1997 (166.03±217.98 ppb), in September 1998 (77.03±53.23 ppb) and in September 1999 (11.46±7.12 ppb). Overall, standard deviation is high showing high fluctuation of ozone in monthly time scale. Figure 4 shows monthly average ozone value at station 8 in 2001-2002. The selection of this station is primarily due to relatively higher percentage of data completeness for two consecutive years. Although the annual cycle is not clearly shown, maximum ozone value is generally recorded during the September-November period. From December to March (wet season), ozone levels are minimum. Figure 4 also illustrates a constant increase of ozone concentration over two years from 2001 to 2002.
114
Table 5: NO2 Pollution Level Exceeding the one hour and 24 hour Air Quality Standard (200 ppb and 50 ppb)
Number of exceedances
---
1996 1997 1998 1999 2001 2002
--- --- --- --- --- --- Station Hours Days Hours Days Hours Days Hours Days Hours Days Hours Days
Pulogadung (2)a 0 0 1 3 0 6 0 0
Pluit (3)b 1 0 1251 125 295 96 8 0
Thamrin (4)c 24 26 1372 269 427 119 3 1
Casablanca (5)d 1 5 6 21 18 10 2 1
Gambir (6)e 258 48 30 99 5 147 * *
Kelapa Gading (7) ** ** 0 3 0 0 * *
Pulogadung (8)f 0 0 0 0
Kebon Jeruk (9)g 0 0 80 62
Senayan (10)h * * 18 39
Hourly data count (% data completeness)
---
1996 1997 1998 1999 2001 2002
---
Pulogadung (2)a 93% 84% 18% 80%
Pluit (3)b 86% 79% 42% 32%
Thamrin (4)c 97% 72% 39% 70%
Casablanca (5)d 87% 87% 83% 95%
Gambir (6)e 54% 83% 100% -
Kelapa Gading (7) - 15% 62% -
Pulogadung (8)f 65% 82%
Kebon Jeruk (9)g 29% 78%
Senayan (10)h - 77%
a
Missing data: January-February and May-November 1998
bMissing data: January and December 1997; January-March and May-June 1998; January-June and October-December 1999 cMissing data: January-May and October 1998; April-May 1999
dMissing data: May 1996; April 1997; June-July 1998
eMissing data: February-March, May and December 1996; April 1997 f
Missing data: September-December 2002
gMeasurement started in September 2001. Missing data: August-September 2002 hNo data available in 2001. Missing data: January-February 2002
*No data available **No measurement
Table 6: Summary of Annual Ozone Values (1996-1999, 2001-2002) Value in ppb
---
Station Year Average ± 1 SD Minimum Maximum Median 95-percentile Data count
Pulogadung (2) 1996 17.52±13.63 1 129 14 43 3836
1997 14.4±13.16 0 161 11 40 6455
1998 67.36±142.33 0 993 16 363.95 1762
1999 46.79±20.83 0 122 40 85 1505
Pluit (3) 1996 10.9±11.43 0 115 7 32 7320
1997 17.77±18.57 0 228 11 53 6564
1998 12.79±13.45 0 148 9 38 1965
1999 12.09±14.38 0 101 6 39 2386
Thamrin (4) 1996 9.66±9.91 0 104 7 30 8254
1997 5.1±5.45 0 78 4 14 5050
1999 8.08±0.58 0 88 3 31 1352
Casablanca (5) 1998 7.43±11.87 0 88 2 38 2565
1999 7.51±10.59 0 76 2 31 8326
Kelapa Gading (7) 1997 57.27±122.73 0 964 20.6 366.35 2007 1998 46.53±82.09 0 923.6 17.7 167.56 5097
1999 8.52±9.74 0 105.2 5.7 26.6 5944
115 Fig. 4: Monthly Average O3 Value at Station 8
(2001-2002)
Fig. 5: Monthly Average Solar Radiation (In Situ
Station 8), 2001
in 1997 and continued to increase towards 1998. Lowest humidity was recorded in October 1997 with 75% of relative humidity. Higher mean temperature and lower relative humidity in 1997 were associated with the El Niño phenomenon in that year. Particularly, strong El Niño extended from July 1997 to April 1998. In 1998 and 1999, the meteorological conditions returned to their normal averages (calculated based on a minimum 10 year meteorological observation). Wind direction extends mostly from west to southwest during November-March, except in January where wind direction is from west to north. Calm conditions significantly prevail in the months of May through October with frequency ranging from 18 to 26%. In addition, the NE wind balances the calm winds during that period, specifically in the months of July through Sept. The calm conditions are in favor of ozone enhancements in Jakarta during May-October (dry months). Local biomass burning is often active in dry months, especially towards the end of dry season, potentially contributing to maximum ozone.
In addition, In Situ meteorological observation at station 8 in 2001 Fig. 5 to 7 may explain the association
Fig. 6: Monthly Average Temperature (In Situ Station 8), 2001
Fig. 7: Monthly Average Relative Humidity (In Situ
Station 8), 2001
of high ozone levels Fig. 4 with warm temperatures, low humidity and high solar radiation. The local land-sea breeze may potentially influence ozone behavior in the area. Analysis of correlation using the two-year database at station 8 indicated that the correlation between ozone and solar radiation, between ozone and temperature and between ozone and humidity was all significant at the 0.01 level (two-tailed student t test) with the correlation coefficient (r) of 0.64, 0.67 and 0.63, respectively.
Surface meteorological observation indicates that the southerly to NE wind predominates over the period of May-October (dry season) transporting the ozone-enriched air masses towards neighboring Southeast Asian countries. Zhang et al. related the high ozone in the dry season in Bangkok to, among others, the regional transport of O3 and precursors from the Asian
continent associated with the NE monsoon.
116 23:00 21:00 19:00 17:00 15:00 13:00 11:00 9:00 7:00 5:00 3:00 1:00 80 70 60 50 40 30 20 10 0 CH4*60 (ppb) CO (ppm) NO (ppb) NO2 (ppb) NMHC*60 (ppb) O3 (ppb)
Fig. 8: Daily Average Concentration of Pollutants During the Dec-Mar Period at Station 2 In 1996 23:00 21:00 19:00 17:00 15:00 13:00 11:00 9:00 7:00 5:00 3:00 1:00 80 70 60 50 40 30 20 10 0 CH4*60 (ppb) CO (ppm) NO (ppb) NO2 (ppb) NMHC*60 (ppb) O3 (ppb)
Fig. 9: Daily Average Concentration of Pollutants During the Apr-Aug Period at Station 2 in 1996 23:00 21:00 19:00 17:00 15:00 13:00 11:00 9:00 7:00 5:00 3:00 1:00 80 70 60 50 40 30 20 10 0 CH4*60 (ppb) CO (ppm) NO (ppb) NO2 (ppb) NMHC*60 (ppb)
Fig. 10: Daily Average Concentration of Pollutants During the Sep-Nov Period at Station 2 in 1996
CH4 and NMHC. Thus, for the analysis of ozone
precursors (NO, NO2, CO, CH4, NMHC and O3), the
1996 data from stations 2, 3 and 4 were used.
23:00 21:00 19:00 17:00 15:00 13:00 11:00 9:00 7:00 5:00 3:00 1:00 60 50 40 30 20 10 0 CH4*60 (ppb) CO (ppm) NO (ppb) NO2 (ppb) NMHC*60 (ppb) O3 (ppb)
Fig.11: Daily Average Concentration of Pollutants During the Dec-Mar Period at Station 3 in 1996 23:00 21:00 19:00 17:00 15:00 13:00 11:00 9:00 7:00 5:00 3:00 1:00 60 50 40 30 20 10 0 CH4*60 (ppb) CO (ppm) NO (ppb) NO2 (ppb) NMHC*60 (ppb) O3 (ppb)
Fig.12: Daily Average Concentration of Pollutants During the Apr-Aug Period at Station 3 in 1996 23:00 21:00 19:00 17:00 15:00 13:00 11:00 9:00 7:00 5:00 3:00 1:00 70 60 50 40 30 20 10 0 CH4*60 (ppb) CO (ppm) NO (ppb) NO2 (ppb) NMHC*60 (ppb) O3 (ppb)
Fig. 13: Daily Average Concentration of Pollutants During the Sep-Nov Period at Station 3 in 1996
117
Table 7: Number of Hours Exceeding 100 ppb at Stations 2, 3, and 7 (1996-1999)
1996 1997 1998 1999
No.2 No.3 No.2 No.3 No.7 No.2 No.3 No.7 No.2 No.3 No.7
Jan 0 0 0 0 - 0 0 0 - - 0
Feb 0 0 0 0 - 0 0 0 - - -
Mar 0 0 0 0 - 2 0 62 0 - 0
Apr 0 0 0 0 - 0 0 42 - - 0
May 5 0 0 7 - 0 0 178 - 0 0
Jun 6 1 0 8 0 - 2 68 - 1 2
Jul - 4 0 19 171 4 1 41 1 0 0
Aug - 0 0 6 0 - - 92 9 0 0
Sept - 0 2 2 1 - - 84 6 0 0
Oct - 0 0 0 10 - - - 1 - 0
Nov - 0 0 - 4 - - - 0
Dec 0 0 0 - 0 262 - 0 1 - 0
Figure 8-13 presents the diurnal variation of pollutants during 1-year monitoring in 1996. The diurnal cycle of pollutants is typically shown for polluted urban areas. Indeed, this pattern is almost similar to the diurnal pattern of photochemical pollutants in Bangkok [5]. When the morning rush hours begin at around 7.00 a.m. to 8.00 a.m.; CO, NO, NMHC and CH4 also reaches its
peak at around 8.00 a.m. due to emissions from traffic. NO peaks at around 7.00 a.m., while NO2 peaks at
around 9.00 a.m. (about two hours after NO). NO concentration drops fast after 8.00 a.m. (after sunrise) as O3 increases reaching its highest at around
11.00-13.00. CO, NMHC, CH4 and NO2 also drop
when O3 reaches its maximum during the afternoon
hours. The reduction of these pollutant concentrations should be caused by the photochemical reactions that consume the pollutants such as reactions of pollutants with OH and HO2 radicals and the pollutant dispersion
factors such as mixing height and wind speed. As the boundary layer increases gradually due to convective heating during noon hours, the mixing of air in the lower heights with air in the higher heights causes pollutants to be ventilated upwards [5]. The local wind may also contribute to the pollutant dilution.
In the afternoon towards evening, the pollutant concentrations increase steadily as the traffic peaks again but the photochemical production of O3 ceases
due to a minimum-to-zero solar radiation. As the traffic subsides, the concentrations of NO, NO2, NMHC and
CO decrease slowly during night hours until before dawn. Interestingly, CH4 continues to increase slightly
in the early hours, which may be contributed from other sources than road transport, i.e. natural, fossil-fuel related and biospheric carbon sources.
In urban centers, when NOx predominates over VOC,
the OH-NO2 reaction will remove OH radicals retarding
the further O3 production. Because OH reacts more
rapidly with NO2 than with VOCs, NOx tends to be
removed faster than VOCs. In the absence of fresh NOx
emissions, NOx is depleted more rapidly leading to
increasing ratio of VOC to NOx. As a result, OH reacts
preferentially with VOCs to keep the ozone-forming
cycle going [1]. This chemistry plays an important role in the temporal variations of ozone. However, the ratio of VOC to NOx concentration was not evaluated in this
study due to limited VOCs data.
Pollutant daily maximum and average concentrations at station 2 are generally higher than at station 3 for all seasonal periods. Daily average value of NO, NO2,
NMHC, CH4 and CO at station 2 during the Dec-Mar
period are 26.94±15.65 ppb (average±1 SD), 15.94±4.47 ppb, 1114.93±250.5 ppb, 2213±287.28 ppb and 13.11±5.54 ppm respectively; as compared to values at station 3 which are 27.4±12.02 ppb, 8.7±2.02 ppb, 631.15±145.07 ppb, 1810.8±234.87 ppb and 9.33±3.10 ppm respectively. Station 2 is located downwind of station 3 during wet season when westerly wind predominates transporting pollutant-enriched air masses to station 2. In the dry season, wind is mostly from NE bringing air masses from biomass burning in the nearby area (Bekasi) to station 2.
23:00 21:00 19:00 17:00 15:00 13:00 11:00 9:00 7:00 5:00 3:00 1:00
O
3
v
a
lu
e
i
n
p
p
b
v
80
70
60
50
40
30
20
10
0
Dec-Mar
Apr-Aug
Sept-Nov
Fig. 14: Diurnal O3 Concentration Averaged for 3
118 This shall explain why higher pollutant concentrations are found in station 2 as compared to station 3, besides the fact that station 3 is located near to the coastal area. Daily average value of pollutants is generally higher in dry months. Figure 14 exhibits a comparison of diurnal O3 concentration during wet season,
transition period and dry season using the 2001-2002 data. It is clearly shown that the Sep-Nov period records the highest diurnal variation of O3
concentration.
CONCLUSION
Photochemical smog pollution potential in Jakarta metropolitan area is high due to the high traffic emissions of ozone precursors and the favorable surface meteorological conditions, i.e. warm temperature, high solar radiation and calm wind conditions. Over the two-year period from 2001 to 2002, the ground-level ozone indicates an upward trend. The trend remains to be seen in the future as more data is made available. Despite the frequent missing database, which produces uncertainty in analysis, ozone episodes are potentially detected at downwind area off the city center. Further investigation is needed with regard to the transport of ozone and its precursors over the larger area of Jakarta and Bodetabek.
The seasonal variations of ozone illustrate the effect of local meteorological conditions and regional monsoons on ozone formation and accumulation. Ozone level is highest in the dry season (September-November) and is lowest in the wet season (December-March). Correlation between ozone level and meteorological attributes (solar radiation, relative humidity and temperature) is significant. The lower ozone level at curbside stations reflects the destruction of ozone by NO, which is emitted from traffic sources. The diurnal variations of ozone and its precursors are clearly demonstrated and are typical for polluted urban areas. Improvement of the database of air quality monitoring is very critical for Jakarta. Areas of improvement shall include the development of national guidelines on the standard procedures of air quality monitoring including site location, instrumentation, quality assurance and statistical procedures for data analysis.
The local government implementation plans on collection and analysis of data and inventorying emissions from pollution sources is a key to the identification and selection of emissions control measures. This will lead to development of efficient and cost-effective control strategy.
ACKNOWLEDGMENTS
Special acknowledgments are extended to the Environment Provincial Office of DKI Jakarta (BPLHD DKI), Environmental Management Center in Serpong (EMC), Research and Development Center of the National Atomic Agency (BATAN) in Serpong and the Bureau of Statistics for kindly providing necessary related data.
REFERENCES
1. Stern, A.C., H.C. Wohlers, R.W. Boubel and W.P. Lowry, 1973. Fundamentals of Air Pollution. Academic Press, Inc., New York.
2. Seinfeld, J.H., 1998. Atmospheric Chemistry and Physics. John Wiley and Sons, Inc., New York. 3. Japan International Cooperation Agency (JICA),
Environmental Impact Management Agency (BAPEDAL) the Republic of Indonesia, 1997. The study on the integrated air quality management for Jakarta metropolitan area. Final Report, volume 2, Supporting Report. Nippon Koei Co., Ltd., Suuri keikaku Co., Ltd.
4. Chan, L.Y., H.Y. Liu, K.S. Lam, T. Wang, S.J. Oltmans and J.M. Harris, 1998. Analysis of the seasonal behavior of tropospheric ozone at Hongkong. Atmospheric Environment, 32: 59-168. 5. Zhang, B.N., Kim Oanh, N.T., 2002.
Photochemical smog pollution in the Bangkok Metropolitan Region of Thailand in relation to O3 precursor concentrations and