GENETIC AND PHENOTYPIC CHARACTERIZATION OF ISOLATES OF
Pyricularia grisea
FROM THE RICE CULTIVARS EPAGRI 108 AND 109
IN THE STATE OF TOCANTINS
ANNE S. PRABHU1, MARTA C. FILIPPI1, LEILA G. ARAUJO2 & JOSIAS C. FARIA1 1Embrapa Arroz e Feijão, Cx. Postal 179, CEP 75375-000, Santo Antônio de Goiás, GO, fax: (62) 533-2100, e-mail: [email protected]; 2Universidade Federal de Goiás (UFG), Cx. Postal 131, CEP 74001-970,
Goiânia, GO, e-mail: [email protected]
(Accepted for publication on 24/07/2002)
Corresponding author: Anne Sitarama Prabhu
PRABHU, A.S., FILIPPI, M.C., ARAUJO, L.G. & FARIA, J.C.Genetic and phenotypic characterization of isolates of Pyricularia grisea from the rice cultivars Epagri 108 and 109 in the State of Tocantins. Fitopatologia Brasileira 27:566-573. 2002.
ABSTRACT An epidemic of rice (Oryza sativa) blast occurred on cultivars
Epagri 108 and 109 in the municipalities of Lagoa da Confusão and Duerê in the State of Tocantins, during the rice-growing season 1998-99. DNA fingerprinting and virulence phenotype analysis were utilized to determine the diversity of Pyricularia grisea isolates collected from these cultivars in one epidemic year. Rep-PCR analysis of isolates was done by using two primer sequences from Pot2. Two distinct fingerprint groups or lineages were identified among 53 isolates collected from nine different commercial fields. The virulence pattern of isolates retrieved from these two cultivars was analyzed in artificial inoculation tests utilizing 32 genotypes in the greenhouse. A dendrogram constructed from virulence phenotype data showed a
single group considering 77% similarity level. The predominant pathotype IB-45 was represented by 47 of the 53 isolates corresponding to 83%. Four other pathotypes (IB-1, IB-9, IB-13 and IB-41) were identified at random among the isolates from these cultivars. There was no relation between rep-PCR grouping and pathotypes. The results showed that the isolates of P. grisea recovered from cultivars Epagri108 and 109 in farmers’ fields had narrow phenotypic and genetic diversity. The blast outbreak on these two cultivars one year after their introduction could be attributed to the new pathotype IB-45 or its increase, which was hitherto existing in low frequency.
Additional key words: Magnaporthe grisea, molecular markers, Oryza sativa, rep-PCR analysis, rice blast.
RESUMO
Caracterização genética e fenotípica de isolados de Pyricularia grisea coletados em lavouras das cultivares Epagri 108 e 109 no Estado do Tocantins
Foi constatada a ocorrência de uma epidemia de brusone, na safra 1998/99 nas cultivares de arroz (Oryza sativa) irrigado Epagri 108 e 109, nos municípios de Lagoa da Confusão e Duerê, do Estado do Tocantins, na safra 1998-99. Foram utilizados “DNA fingerprinting” e análise fenotípica de virulência para determinar a diversidade entre isolados de Pyricularia grisea coletados nestas duas cultivares no ano de epidemia. A análise de DNA dos isolados foi realizada utilizando rep-PCR para amplificação das sequências entre os elementos repetitivos Pot2. Dois grupos distintos de bandas polimórficas ou linhagens foram identificados entre os 53 isolados coletados em nove diferentes lavouras comerciais. O padrão de virulência dos isolados foi estudado através de inoculações artificiais em 32 genótipos, em casa de vegetação. O
dendrograma construído com base nos dados de virulência fenotípica, permitiu distinguir apenas um grupo, considerando o nível de similaridade de 77%. O patótipo predominante IB-45 foi representado por 47 dos 53 isolados correspondendo a 83%. Foram identificados quatro patótipos (IB-1, IB-9, IB-13 e IB-41) entre isolados coletados nestas duas cultivares. Não houve relação entre agrupamento dos isolados por rep-PCR e patótipos. Os resultados ainda demonstraram que os isolados de P. grisea provenientes das cultivares Epagri 108 e 109 apresentaram estreita diversidade fenotípica e genética. A epidemia da brusone nestas duas cultivares, um ano após o lançamento, pode ser atribuída ao surgimento do novo patótipo IB-45 ou à sua preexistência em baixa freqüência e rápido aumento no campo.
INTRODUCTION
Rice blast caused by Pyricularia grisea (Cooke) Sacc. [= Magnaporthe grisea (T.T.Herbert) Yaegashi & Udagawa] is the most destructive disease of irrigated rice (Oryza sativa
L.) in the State of Tocantins. Even though there are no exact estimates of yield losses, they are considered to be significant by the growers in the blast susceptible cultivar Metica 1. Two rice cultivars Epagri 108 (17719/5738/IR 21015-72-3-3-3-1) and Epagri 109 (CT7347/ IR 21015-72-3-3-3-21015-72-3-3-3-1) were
introduced from the State of Santa Catarina because of their high yield potential, grain quality and blast resistance. These two cultivars occupied approximately 20.000 hectares in the municipalities of Lagoa de Confusão and Duerê. The occurrence of blast epidemic was recorded, in different farms, at the vegetative phase, during 1998/99 rice-growing season a total breakdown of vertical resistance of these two cultivars in a year after their introduction (Prabhu & Filippi, 1999). The resistance breakdown of commercial rice cultivars was attributed to high pathogenic variability of P. grisea (Ou, 1980).
Most of the earlier studies in Brazil were concentrated on determining race composition, frequency of occurrence and compatibility with known resistance genes (Amaral et al., 1979; Ribeiro & Terres, 1987; Prabhu & Filippi, 1989; Urashima & Isogawa, 1990; Filippi et al., 1999). Pathogenic variation has been reported from single conidial isolates originating from a single lesion (Ou & Ayad, 1968; Bedendo et al., 1979), while some other studies showed that the isolates are pathogenically stable (Giatgong & Frederiksen, 1969; Bonman et al., 1987). The pathogenic diversity is generally very high in experimental fields and breeding sites commonly known as “hot spots” where conditions are highly favorable for the pathogen (Correa-Victoria & Zeigler, 1993; Zeigler et al., 1995; Filippi et al., 1999). However, there is no information in Brazil on the virulence diversity of the pathogen under natural conditions in farmer’s fields where there is very little or no allo-infection.
Strategies to incorporate the non-matching resistance genes to the existing pathogen population in the field require studies on virulence and molecular characterization. Characterization of pathogen populations of P. grisea is done both by conventional pathotyping based on the reaction on a set of differentials and molecular tools such as DNA-fingerprinting. The MGR586 element has been widely used as a probe for genetic analysis of the blast pathogen population. It has been shown that the isolates of P. grisea can be grouped into distinct lineages (Hamer, 1991; Levy et al., 1991; Levy et al., 1993; Zeigler et al., 1995; Filippi et al., 1999). Because of difficulties involved in RFLP analysis of large samples of P. grisea, George et al. (1998) developed a cost effective, simple, repetitive, element-based polymerase chain reaction (rep-PCR) fingerprinting method, specific for monitoring P. grisea populations. A close correspondence between the groupings of isolates based on Pot2 rep-PCR and those obtained by MGR586 was demonstrated.
The present paper reports the results of investigation on pathotyping and genetic diversity in isolates of P. grisea, retrieved from the commercial rice cultivars Epagri 108 and 109 planted in extensive areas, in the State of Tocantins.
MATERIALS AND METHODS
Isolates
Isolates of P. grisea were collected from nine rice farms
planted with cultivars Epagri 108 and 109 during the 1998-99 crop growing season in the municipality of Lagoa de Confusão, in Tocantins. Monoconidial isolates from the sporulating leaf lesions were obtained and maintained on sterilized filter paper discs.
DNA extraction
Isolates were grown on culture medium (10 g of dextrosesupplemented with 2 g of yeast extract per liter) in Erlenmeyer flasks for four days without agitation followed by ten days with constant agitation in the dark, at room temperature. One or two mycelial paper discs were transferred to Erlenmeyer flasks (cap. 250 ml) containing 150 ml of culture medium.
DNA extraction was performed utilizing the modified method of Raeder & Broda (1985). The harvested mycelia were freeze-dried, lyophilized and macerated in liquid nitrogen. About 300 mg of powdered mycelia was suspended in 700 µl of extraction buffer (50 mM Tris-HCl, pH 8.0; 50 mM EDTA; 3% sodium dodecyl sulfate, wt/vol and 1% of mercaptoethanol) at 65 ºC for at least 1 h. The cellular proteins were precipitated with 30 µl of potassium acetate (3 M and pH 5.2). DNA was precipitated in 200 µl of cold isopropanol, washed with 70% ethanol, dried under vacuum and resuspended in TE buffer (10 mM Tris-HCl, pH 8.0; 1.0 mM EDTA), containing 10 mg/ml of RNase A and incubated at 37 ºC for 30 min. The DNA concentration was estimated by fluorometer and adjusted to 10 ng/µl.
Primers
The oligonucleotide sequences were based on the primer sequence of the repetitive element Pot 2 (EMBL accession Z33638), an inverted repeat transposon found in approximately 100 copies in M. grisea (Kachroo et al., 1994). The two primers (Pot2-1 5´ CGGAAGCCCTAAAGCTGTTT 3´ and Pot2-2 5´CCCTCATTCGTCACACGTTC 3´) were designed from each end of Pot 2 in opposite orientation such that the 3´ends were directed outward from each element (George et al., 1998). The two primers, whose sequences are internal to the 43-bp inverted terminal repeats, amplify the flanking sequences on both sides of the repetitive element, generating fragments spanning the intervening sequences (George et al., 1998). The oligonucleotide sequences were synthesized by Federal University of Paraná, Brazil.
DNA Amplification
DNA amplification reactions were performed as described by Williams et al. (1990). Each 25 µl reaction contained: 50 ng of DNA, 2.5 µl of 10 X buffer reaction (200 mM Tris - HCl, pH 8.4 and 500 mM of KCl), 0.75 µl of 50 mM MgCl2; 0.5 µl of dNTP (10 mM of each dATP, dGTP, dCTP and dTTP); 0.5 µM each of the two opposing primers; 1.5 units of Taq polymerase, overlaid with 50 µl of mineral oil to prevent evaporation.
Williams et al. (1990) was found to be superior to the protocol adopted by George et al (1998). For this reason the following procedure was adopted. The enzymatic amplification was performed in a thermocycler (M.J. Research, Inc.), programmed for 40 cycles. Each cycle was composed of: 15 s at 94 ºC (DNA denaturation); 30 s at 35 ºC (annealing of the primers to the DNA template) and 1 min at 72 ºC (extension of the primers). After 40 cycles an extra extension step was performed for 7 min at 72 ºC. Amplification products were separated by gel electrophoresis on 1.4% agarose gel in TBE buffer (90 mM Tris-borate and 2 mM EDTA) containing 10 mg/ml of ethidium bromide. DNA bands were photographed under ultra violet light, utilizing the photo documentation system, Eagle Eye II (Stratagene).
Data analysis
The Pot2 rep-PCR profiles were analyzed based on the presence (1) or absence (0) of bands of same length. The data were analyzed using the program NTSYS-pc version 2.0/1997. The genetic distances were calculated by the coefficient of similarity of Jaccard. The matrix of genetic distances was used for grouping the isolates based on the method of Unweighted Pair-Group Method with Arithmetic Averages (UPGMA).
Virulence analysis
The phenotypic virulence of 53 isolates retrieved from cultivars Epagri 108 and Epagri 109 were tested on 32 genotypes, including 19 commercial irrigated rice cultivars, five near isogenic lines of CO39 and standard international differentials. Sixteen genotypes per plastic tray (30 x 15 x 10 cm) containing 3 kg of soil fertilized with NPK were planted. Ten to twelve seeds of each genotype were sown in 5 cm rows. Inoculations were made on 21-day-old plants with spore suspension (3 x 10⁵ conidia/ml) in the greenhouse. Leaf blast reaction was assessed seven to nine days after inoculation. The isolates that induced typical sporulating lesions were
considered virulent (4-9) and non-sporulating necrotic lesions (0-3) as avirulent according to Leung et al. (1988). The frequency of virulence was determined on the basis of total number of compatible reactions on 32 genotypes. In case of ambiguous or intermediate reaction, inoculation tests were repeated whenever necessary and the ones that gave consistent and uniform reaction were utilized for analysis. The pathotypes were determined based on the reaction type on eight international differentials.
The virulence pattern was analyzed based on the similarity of reaction type among isolates. A binary matrix indicating compatible reaction (1) and incompatible reaction (0) of each isolate was utilized for constructing a matrix of similarity between all pairs of isolates according to the coefficient of Jaccard. These data were used to calculate similarity coefficients and to construct dendrograms using the unweighted pair-group method with arithmetic averages (UPGMA) employing the SAHN program of the Numerical Taxonomy and Multivariate Analysis (NTSYS-pc version 2.0/ 1997).
RESULTS AND DISCUSSION
A distinct banding pattern was generated utilizing rep-PCR with two primer sequences from Pot2. The amplified bands ranged from 200 bp to 1300 bp in length (Figure 1). All isolates of P. grisea recovered from Epagri 108 and Epagri 109 showed three to nine polymorphic bands. Three of the 19 isolates, Nos. 5, 8, and 16 identified as pathotypes IB-13, IB-1 and IB-9, respectively, showed differences in DNA profiles compared to the 16 other isolates of the pathotype IB-45 (Figure 1).
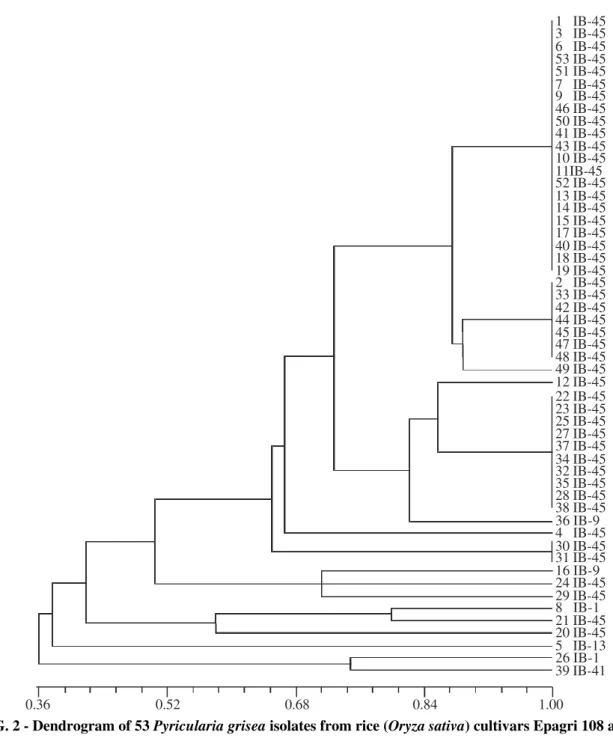
Cluster analysis (UPGMA) of 53 isolates showed two distinct groups, one formed by the isolates Nos. 26 and 39, and the other by the rest of the isolates, considering similarity coefficient of approximately 38% (Figure 2). Forty of the 47 isolates of pathotype IB-45 recovered from cultivars Epagri
FIG. 1 - Pot2 rep-PCR analysis showing DNA fingerprinting profiles of Pyricularia grisea isolates from rice (Oryza sativa) cultivars Epagri 108 and 109. M = Size marker Lambda 100 bp, Gibco BRL. Isolates numbers correspond to the numbers indicated in the dendrogram.
M 1 2 3 4 5 6 7 8 9 10 11 12 13 14 15 16 17 18 19 1500 bp
1 IB-45 3 IB-45 6 IB-45
7 IB-45
2 IB-45 9 IB-45 53 IB-45 51 IB-45
46 IB-45 50 IB-45 41 IB-45 43 IB-45
52 IB-45 13 IB-45 14 IB-45 15 IB-45 17 IB-45 40 IB-45 18 IB-45 19 IB-45 33 IB-45 42 IB-45 44 IB-45 45 IB-45 47 IB-45 48 IB-45 49 IB-45 12 IB-45 22 IB-45 23 IB-45 25 IB-45 27 IB-45 37 IB-45 34 IB-45 32 IB-45 35 IB-45 28 IB-45 38 IB-45 36 IB-9
30 IB-45 31 IB-45 16 IB-9 24 IB-45 29 IB-45
21 IB-45 20 IB-45
26 IB-1 39 IB-41
1.00 0.84
0.68 0.52
0.36
4 IB-45
8 IB-1
5 IB-13 10 IB-45 11IB-45
FIG. 2 - Dendrogram of 53 Pyricularia grisea isolates from rice (Oryza sativa) cultivars Epagri 108 and 109, constructed using UPGMA based an Jaccard’s similarity coefficients; data from Pot2 rep-PCR analysis; scale at the bottom represents coefficients of similarity.
108 and 109 formed a single group (Group I) considering Jaccard coefficient value of 70%. Even though the rest of the isolates did not form into a distinct group they were clustered into Group II. Group II with similarity coefficient values ranging from 0.36 to 1.0 was not well defined and could be considered as six subgroups, each comprised one to three isolates. The pathotypes other than IB-45 such as IB-9, IB-1, IB-13 and IB-41 were included in this group. There seems to be no relation between the pathotypes and rep-PCR based analysis. However, the cluster analysis of the PCR banding pattern of P. grisea isolates showed close correspondence between the groupings based on Pot2 and the phenotypic
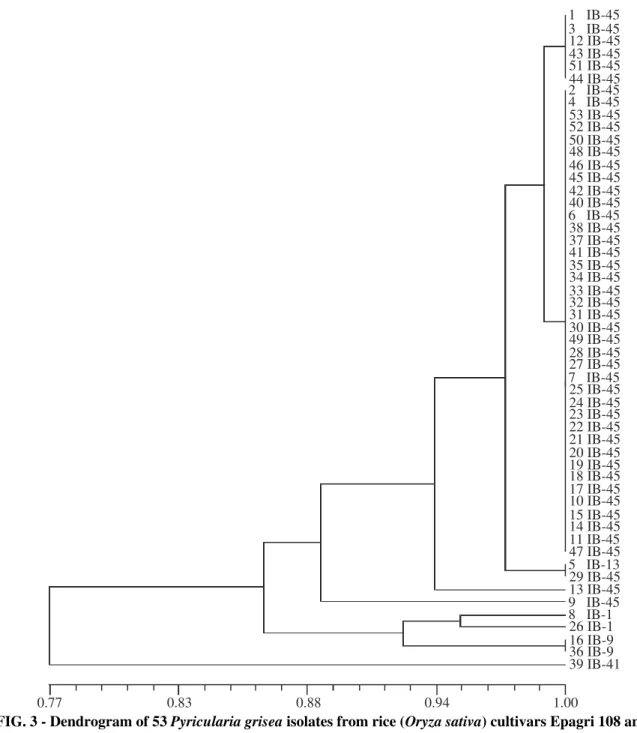
virulence (Figures 2 and 3). The correlation between Jaccard coefficients of rep-PCR and phenotypic virulence was positive and significant (r = 0.38; p = 0.01). Among the undefined group of isolates, genetic diversity was evident even though it was not exhibited in phenotypic virulence analysis. These results indicate the utility of rep-PCR analysis for identifying genetic differences among isolates which are not evident otherwise.
FIG. 3 - Dendrogram of 53 Pyricularia grisea isolates from rice (Oryza sativa) cultivars Epagri 108 and 109, constructed using UPGMA based an Jaccard’s similarity coefficients; data from phenotypic virulence analysis; scale at the bottom represents coefficients of similarity.
0.77 0.83 0.88 0.94 1.00
1 IB-45 3 IB-45
2 IB-45 4 IB-45
6 IB-45
7 IB-45
5 IB-13
9 IB-45 8 IB-1 12 IB-45 43 IB-45 51 IB-45 44 IB-45
53 IB-45 52 IB-45 50 IB-45 48 IB-45 46 IB-45 45 IB-45 42 IB-45 40 IB-45
38 IB-45 37 IB-45 41 IB-45 35 IB-45 34 IB-45 33 IB-45 32 IB-45 31 IB-45 30 IB-45 49 IB-45 28 IB-45 27 IB-45
25 IB-45 24 IB-45 23 IB-45 22 IB-45 21 IB-45 20 IB-45 19 IB-45 18 IB-45 17 IB-45 10 IB-45 15 IB-45 14 IB-45 11 IB-45 47 IB-45
29 IB-45 13 IB-45
26 IB-1 16 IB-9 36 IB-9 39 IB-41
IB-41. The predominant pathotype IB-45 was represented by 47 of the 53 isolates corresponding to 83%.
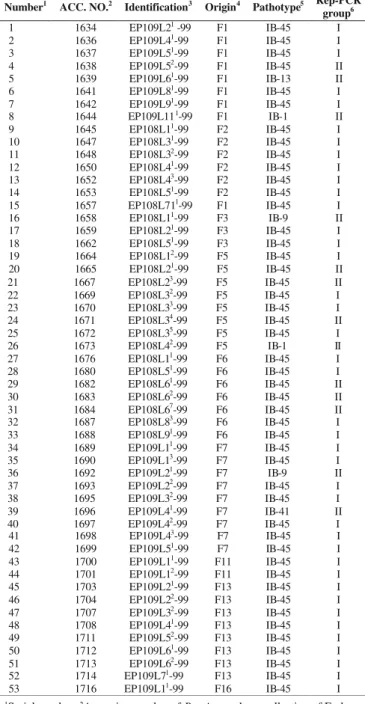
The results of pathotype analysis as well as rep-PCR grouping of isolates collected from nine different farms in the municipality of Lagoa da Confusão during 1998-99 growing season are summarized in Table 1. All 53 isolates collected from cultivars Epagri 108 and Epagri 109 showed a similar reaction pattern on the eight standard international differentials with few exceptions. Forty-seven of the 53 isolates pertained to the pathotype IB-45. Four other pathotypes identified among the isolates collected from these cultivars were in low frequency. They included two each of pathotypes
Number1 ACC. NO.2 Identification3 Origin4 Pathotype5 Rep-PCR
group6
1 1634 EP109L21 -99 F1 IB-45 I 2 1636 EP109L41-99 F1 IB-45 I 3 1637 EP109L51-99 F1 IB-45 I 4 1638 EP109L52-99 F1 IB-45 II 5 1639 EP109L61-99 F1 IB-13 II 6 1641 EP109L81-99 F1 IB-45 I 7 1642 EP109L91-99 F1 IB-45 I 8 1644 EP109L111-99 F1 IB-1 II 9 1645 EP108L11-99 F2 IB-45 I 10 1647 EP108L31-99 F2 IB-45 I 11 1648 EP108L32-99 F2 IB-45 I 12 1650 EP108L41-99 F2 IB-45 I 13 1652 EP108L43-99 F2 IB-45 I 14 1653 EP108L51-99 F2 IB-45 I 15 1657 EP108L711-99 F1 IB-45 I 16 1658 EP108L11-99 F3 IB-9 II 17 1659 EP108L21-99 F3 IB-45 I 18 1662 EP108L51-99 F3 IB-45 I 19 1664 EP108L12-99 F5 IB-45 I 20 1665 EP108L21-99 F5 IB-45 II 21 1667 EP108L23-99 F5 IB-45 II 22 1669 EP108L32-99 F5 IB-45 I 23 1670 EP108L33-99 F5 IB-45 I 24 1671 EP108L34-99 F5 IB-45 II 25 1672 EP108L35-99 F5 IB-45 I 26 1673 EP108L42-99 F5 IB-1 II 27 1676 EP108L11-99 F6 IB-45 I 28 1680 EP108L51-99 F6 IB-45 I 29 1682 EP108L61-99 F6 IB-45 II 30 1683 EP108L62-99 F6 IB-45 II 31 1684 EP108L67-99 F6 IB-45 II 32 1687 EP108L83-99 F6 IB-45 I 33 1688 EP108L91-99 F6 IB-45 I 34 1689 EP109L11-99 F7 IB-45 I 35 1690 EP109L13-99 F7 IB-45 I 36 1692 EP109L21-99 F7 IB-9 II 37 1693 EP109L22-99 F7 IB-45 I 38 1695 EP109L32-99 F7 IB-45 I 39 1696 EP109L41-99 F7 IB-41 II 40 1697 EP109L42-99 F7 IB-45 I 41 1698 EP109L43-99 F7 IB-45 I 42 1699 EP109L51-99 F7 IB-45 I 43 1700 EP109L11-99 F11 IB-45 I 44 1701 EP109L12-99 F11 IB-45 I 45 1703 EP109L21-99 F13 IB-45 I 46 1704 EP109L22-99 F13 IB-45 I 47 1707 EP109L32-99 F13 IB-45 I 48 1708 EP109L41-99 F13 IB-45 I 49 1711 EP109L52-99 F13 IB-45 I 50 1712 EP109L61-99 F13 IB-45 I 51 1713 EP109L62-99 F13 IB-45 I 52 1714 EP109L71-99 F13 IB-45 I 53 1716 EP109L11-99 F16 IB-45 I
1Serial number; 2Accession number of P. grisea culture collection of Embrapa
Rice & Beans; 3EP refers to Epagri, L indicates lesion number, superscript
refers to conidial number, two last digits indicate the year of collection; 4farm
number from which the isolates were collected; 5Pathotypes were identified
using eight international differentials; 6Groups based on clusters analysis of
PCR banding patterns.
TABLE 1 -Isolates collected from rice (Oryza sativa) cultivars Epagri 108 and Epagri 109, their origin, international pathotypes and lineages of Pyricularia grisea based on Pot2 rep-PCR analysis
pathotype, possibly in low frequency, in other cultivars which caused the sudden outbreak of blast when Epagri 108 and Epagri 109 were introduced in the state of Tocantins.
Conidia derived from different lesions L11, L6 and L52 originating from the same cultivar Epagri 109 and farm
(F1) were identified as pathotypes IB-1, IB-13 and IB-45, respectively. They were all clustered in rep-PCR group II. Furthermore, different monoconidial isolates obtained from the same lesion (EP108L32, EP108L33, EP108L34, EP108L35) and the same farm (F5) were encountered both in rep-PCR groups I and II but classified as the same pathotype IB-45. These results suggest that there is no direct relation between the Pot2 grouping and pathotypes similar to that observed for the relation between lineages and virulence (Zeigler et al., 1995).
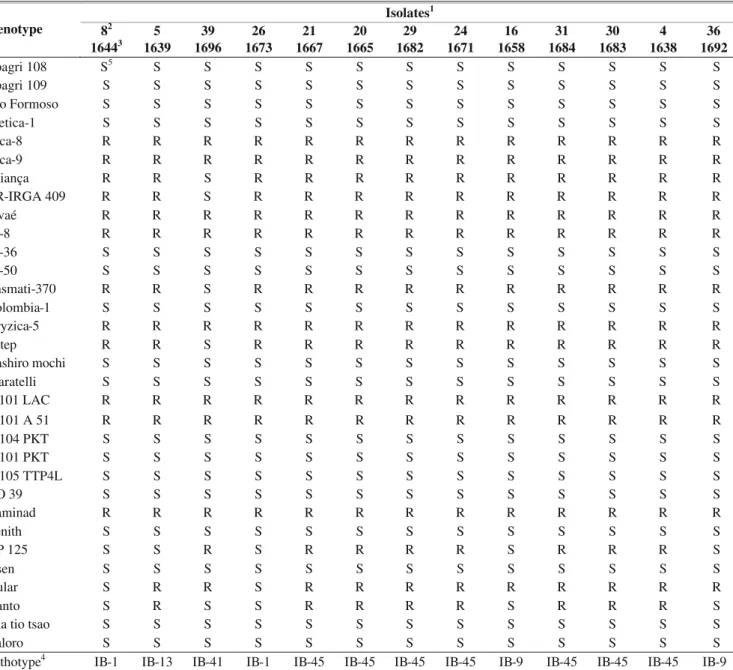
The virulence pattern of the isolates clustered into group II by rep-PCR analysis, on 32 genotypes is shown in Table 2. Four pathotypes (IB-1, IB-9, IB-13, IB-41) recovered at random from cultivars Epagri 108 and Epagri 109 from different farms, as well as seven isolates of pathotype IB-45 pertained to this undefined group. They showed no difference in virulence on NIL’s. Also, all 53 P. grisea isolates tested were avirulent (100%) to the genes Pi-1 (C101 LAC) and 2 (C101 A51) and virulent to 3 (C104PKT), Pi-4a(C101 PKT) and Pi-4b (C105 TTP4L). The genes Pi-1 and Pi-2 could be incorporated in susceptible rice cultivars Rio Formoso, Epagri 108 and 109. The reaction of the 13 isolates on nine commercial rice cultivars was similar, except for one isolate (No 39) identified as pathotype IB-41. Cultivars Aliança and BR-IRGA 409 among the commercial cultivars and Tetep, utilized as resistant check, showed susceptible reaction.
The pathotype IB-45 was highly virulent on Rio Formoso (17719/5738/IR 21015-72-3-3-3-1), which has the same parentage as Epagri 108 (17719/5738/IR 21015-72-3-3-3-1), whose resistance was overcome one year after its release for cultivation by Embrapa Rice & Beans. The field population of P. grisea was avirulent to some test genotypes (Table 2); therefore, they can be utilized as parents in crosses with commercial cultivars.
TABLE 2 - Virulence analysis of Pyricularia grisea isolates that showed different Pot2 rep-PCR banding patterns (group II) on 32 rice (Oryza sativa) genotypes
Isolates1
Genotype 82
16443
5 1639
39 1696
26 1673
21 1667
20 1665
29 1682
24 1671
16 1658
31 1684
30 1683
4 1638
36 1692
Epagri 108 S5 S S S S S S S S S S S S
Epagri 109 S S S S S S S S S S S S S
Rio Formoso S S S S S S S S S S S S S
Metica-1 S S S S S S S S S S S S S
Cica-8 R R R R R R R R R R R R R
Cica-9 R R R R R R R R R R R R R
Aliança R R S R R R R R R R R R R
BR-IRGA 409 R R S R R R R R R R R R R
Javaé R R R R R R R R R R R R R
IR-8 R R R R R R R R R R R R R
IR-36 S S S S S S S S S S S S S
IR-50 S S S S S S S S S S S S S
Basmati-370 R R S R R R R R R R R R R
Colombia-1 S S S S S S S S S S S S S
Oryzica-5 R R R R R R R R R R R R R
Tetep R R S R R R R R R R R R R
Yashiro mochi S S S S S S S S S S S S S
Maratelli S S S S S S S S S S S S S
C 101 LAC R R R R R R R R R R R R R
C 101 A 51 R R R R R R R R R R R R R
C 104 PKT S S S S S S S S S S S S S
C 101 PKT S S S S S S S S S S S S S
C 105 TTP4L S S S S S S S S S S S S S
CO 39 S S S S S S S S S S S S S
Raminad R R R R R R R R R R R R R
Zenith S S S S S S S S S S S S S
NP 125 S S R S R R R R S R R R S
Usen S S S S S S S S S S S S S
Dular S R R S R R R R R R R R R
Kanto S R S S R R R R S R R R S
Sha tio tsao S S S S S S S S S S S S S
Caloro S S S S S S S S S S S S S
Pathotype4 IB-1 IB-13 IB-41 IB-1 IB-45 IB-45 IB-45 IB-45 IB-9 IB-45 IB-45 IB-45 IB-9
1Isolates retrieved from cultivars EPAGRI 108 and 109 in nine different farms; 2The numbers refer to isolates indicated in dendrograms; 3Accession number of P. grisea culture collection of Embrapa Rice & Beans; 4Pathotypes were identified using eight international differentials; 5S = susceptible reaction; R = resistant reaction.
LITERATURE CITED
AMARAL, R.E.M., SOUZA, D.M., MALAVOLTA, U.M.A & ISSA, E. Raças fisiológicas de Pyricularia grisea Cav. no Estado de São Paulo. O Biológico 45:205-208. 1979.
BEDENDO, I.P., RIBEIRO, A.S. & CARDOSO, C.N. Variabilidade do fungo Pyricularia oryzae, agente causal da brusone no arroz. Summa Phytopathologica 5:106-109. 1979.
BONMAN, J.M., VERGEL de DIOS, T.I., BANDONG, J.M. & LEE, E.J. Pathogenic variability of monoconidial isolates of Pyricularia oryzae in Korea and in the Philippines. Plant Disease 71:127-130. 1987.
CORREA-VICTORIA, F.J. & ZEIGLER, R.S. Pathogenic variability in Pyricularia grisea at a rice blast “hot-spot” breeding site in Eastern Colombia. Plant Disease 77:1029-1035. 1993. FILIPPI, M.C., PRABHU, A.S. & LEVY, E.M. Differential
compatibility of Pyricularia grisea isolates with some Brazilian irrigated rice cultivars. Fitopatologia Brasileira 24:447-450. 1999.
FILIPPI, M.C., PRABHU, A.S. & LEVY, E.M. Espectro de virulência de isolados e linhagens de Pyricularia grisea em arroz. Fitopatologia Brasileira 21:398. 1996. (Resumo). This pathotype, which pre-existed in low frequency, became
GEORGE, M.L.C., NELSON, R.J., ZEIGLER, R.S. & LEUNG, H. Rapid population analysis of Magnaporthe grisea by using rep-PCR and endogenous repetitive DNA sequence. Phytopathology 88:223-228. 1998.
GIATGONG, P. & FREDERIKSEN, R.A. Pathogenic variability and cytology of monoconidial subcultures of Pyricularia oryzae. Phytopathology 59:1152-1157. 1969.
HAMER, J.E. Molecular probes for rice blast disease. Science 252:632-633. 1991.
KACHROO, P., LEONG, S.A. & CHATOO, B.B. Pot2, an inverted repeat transposon from the rice blast fungus Magnaporthe grisea. Molecular General Genetics 245:339-348. 1994. LEUNG, H., BORROMEO, E.S., BERNARDO, M.A. &
NOTTEGHEM, J.L. Genetic analysis of virulence in the blast fungus Magnaporthe grisea. Phytopathology 78:1227-1233. 1988.
LEVY, M., CORREA-VICTORIA, F.J., ZEIGLER, R.S., XU, S. & HAMER, J. Genetic diversity of the rice blast fungus in a dis-ease nursery in Colombia. Phytopathology 83:1427-1433. 1993. LEVY, M., ROMÃO, J., MARCHETTI, M.A. & HAMER, J.E. DNA fingerprinting with a dispersed repeated sequence resolves pathotype diversity in the rice blast fungus. Plant Cell 3:95-102. 1991.
OU, S.H. & AYAD, M.R. Pathogenic races of Pyricularia oryzae originating from single lesions and monoconidial cultures. Phytopathology 58:179-182. 1968.
OU, S.H. Pathogenic variability and host resistance of the rice blast fungus, Pyricularia grisea Cavara. Annual Review of
Phytopathology 18:167-187. 1980.
PRABHU, A.S. & FILIPPI, M.C. Physiologic races of Pyricularia oryzae virulent on improved upland rice cultivars. Fitopatolologia Brasileira 14:140. 1989. (Resumo).
PRABHU, A.S. & FILIPPI, M.C. Padrão de virulência dos isolados de Pyricularia grisea provenientes da cultivar Epagri 108, de lavouras de arroz. Fitopatolologia Brasileira 24:319. 1999. (Resumo).
RAEDER, U. & BRODA, P. Rapid preparation of DNA from filamentous fungi. Letters in Applied Microbiology 1:17-20. 1985.
RIBEIRO, A.S. & TERRES, A.L.S. Variabilidade do fungo Pyricularia oryzae e sua relação com cultivares resistentes à brusone. Fitopatolologia Brasileira 12:316-321. 1987. URASHIMA, A.S. & ISOGAWA, Y. Identification of races of
Pyricularia oryzae causing blast disease in variety IAC 4440 in Paraíba Valley-SP. Summa Phytopathologica 16:243-247. 1990.
VAN DER PLANK, J.E. Host-pathogen interaction in plant disease. London. Academic Press. 1982. 207p.
WILLIAMS, J.G.K., KUBELIK, A.R., LIVAK, K.J., RAFALSKI, J.A. & TINGELYS, V. DNA polymorphism amplified by arbitrary primers are useful as genetic markers. Nucleic Acids Research 18:6531-6535. 1990.
ZEIGLER, R.S., COUC, L.X., SCOTT, R.P., BERNARDO, M.A., CHEN, D.H., VALENT, B. & NELSON, R.J. The relationship between lineage and virulence in Pyricularia grisea in the Philippines. Phytopathology 85:443-451. 1995.