Orlando Peixoto de Morais(2) and José Manoel Colombari Filho(2)
(1)Universidade Federal de Goiás, Departamento de Genética e Melhoramento de Plantas, Campus Samambaia, Avenida Esperança s/no, CEP 74690-900 Goiânia, GO, Brazil. E-mail: [email protected], [email protected] (2)Embrapa Arroz e Feijão, Rodovia GO-462, Km 12, Caixa Postal 179, CEP 75375-000 Santo Antônio de Goiás, GO, Brazil. E-mail: [email protected], [email protected]
Abstract ‒ The objective of this work was to estimate genetic and phenotypic parameters among progenies of the CNA6 population of upland rice (Oryza sativa) for grain yield and plant height in four cycles of recurrent selection, in order to evaluate the genetic variability and the genotype × location interaction. The experimental data were obtained from yield trials of S0:2 progenies, which were carried out in the experimental design
of Federer’s augmented blocks, without replications for progenies within each location. The effect of S0:2
progenies was significant in all cycles for grain yield and in the first three cycles for plant height, indicating the maintenance of the population’s genetic potential to generate transgressive progenies. The participation of the component of the progeny × location interaction in phenotypic variance was of high magnitude. The genetic variability of the CNA6 population of upland rice is maintained for grain yield and plant height during the four cycles of recurrent selection.
Index terms: Oryza sativa, genotype × environment interaction, population improvement, quantitative genetics, variance components.
Variabilidade genética durante quatro ciclos de seleção recorrente em arroz
Resumo ‒ O objetivo deste trabalho foi estimar parâmetros genéticos e fenotípicos entre progênies
da população CNA6 de arroz (Oryza sativa) de terras altas para os caracteres produtividade de grãos e altura de plantas, em quatro ciclos de seleção recorrente, para análise da variabilidade genética e da interação genótipo × local. Os dados experimentais foram obtidos de ensaios de rendimentos de progênies S0:2, conduzidos em
delineamento experimental de blocos aumentados de Federer, sem repetição para progênies por local. O efeito de progênies S0:2 foi significativo em todos os ciclos para produtividade de grãos e nos três primeiros ciclos para
altura de plantas, o que é indicativo da manutenção do potencial genético da população em gerar progênies transgressivas. A participação do componente da interação progênie × local na variância fenotípica foi de alta magnitude. A variabilidade genética da população CNA6 de arroz de terras altas quanto à produtividade de grãos e à altura de plantas é mantida durante os quatro ciclos de seleção recorrente.
Termos para indexação: Oryza sativa, interação genótipo × ambiente, melhoramento populacional, genética quantitativa componentes de variância.
Introduction
Rice (Oryza sativa L.) is the main component of the
staple diet of the world’s population; therefore, it is extremely important in terms of food safety. In Brazil, considered the main producer of this cereal among the countries in the Western Hemisphere, the focus of the genetic breeding programs is to increase yield potential by developing superior genotypes, such as cultivars (Breseghello et al., 2011; Colombari Filho et al., 2013). However, to reach the desired genetic gains, it is necessary to choose correctly both the strategies
to manipulate the available genetic variability and the methods to be used (Châtel et al., 2008).
combinations are maintained at very low frequencies, which makes selection impossible (Ramalho et al., 2012). However, an important advantage of recurrent selection is promoting the greatest increases in the frequency of favorable genetic combinations right in the first recombinations of the superior genotypes of a population, which usually also presents a wider genetic base because it is obtained preferentially from crossings among multiple parents. In addition, continuous recombination, which is part of recurrent selection, causes a rupture in genic blocks and increments both the frequency of some favorable genetic combinations and the available genetic variability (Hallauer et al., 2010). This way, recurrent selection is a dynamic method that, in each cycle, produces superior genotypes and facilitates the incorporation of exotic germoplasm into the breeding program. However, it should be noted that, this method may be hindered by the exhaustion of the genetic variability of a population (Geraldi, 1997), which makes it necessary to evaluate the available genetic variability of recurrent selection populations throughout the selection cycles.
The estimate of genetic and phenotypic parameters is one of the most important contributions of quantitative genetics, since they aid in decision-making regarding the selective strategies to be used and allow predicting the genetic gains of future selection cycles and evaluating the viability of the breeding program (Hallauer et al., 2010; Ramalho et al., 2012). Although several works have estimated the genetic parameters of autogamous species, such as rice (Bueno et al., 2012; Colombari Filho et al., 2013; Ahmad et al., 2015; Tuhina-Khatun et al., 2015), Falconer & Machay (1996) pointed out that the obtained results are only valid for the material of the researched population and for the environmental conditions in which the study was carried out. For this reason, the continuous study of the estimates of the variance components of a population is essential to guide genetic breeding in recurrent selection, in which the magnitude of genetic variability during the selection cycles may be affected by several different factors, such as, for example, the size of the sample for recombination, which, in turn, depends on the effective size of the recombination unit (Bernardo, 2010).
The objective of this work was to estimate genetic and phenotypic parameters among progenies of the CNA6 population of upland rice for grain yield and
plant height in four cycles of recurrent selection, in order to evaluate the genetic variability and the genotype × site interaction.
Materials and Methods
The genetic material used consisted of S0:2 progenies of the CNA6 upland rice population of recurrent selection, developed by Empresa Brasileira de Pesquisa Agropecuária (Embrapa). This population was synthesized in the 1993/1994 crop year by incorporating alleles from 27 parents into the CNA-IRAT 5/2/1 population. More detailed information about the composition and the development of the CNA6 population are presented by Morais Júnior et al. (2015).
In the present study, data on the traits grain yield (GY, in kg ha-1) and plant height (PH, in cm), obtained from yield trials of S0:2 progenies conducted in the 2000/2001, 2003/2004, 2006/2007, and 2009/2010 crop years, corresponding to cycles 3, 4, 5, and 6, respectively, were used. In each cycle, the trials were carried out in different locations and consisted of S0:2 progenies from the respective cycle with at least three checks (Table 1).
The experimental design adopted was Federer’s augmented blocks, with one replication within the location. The plots consisted of four 5-m-long rows, spaced 0.30 m, with sixty seeds per meter sowed either manually or by machine. To evaluate GY, the two central lines were harvested, and first and last 0.50 m of each row were not used; then, the grains were weighed after dried, with values corrected for 13% humidity. For PH, the average of three readings of the distance from the base of the plant to the end of the panicle, at full maturity, was recorded. The yield trials of the S0:2 progenies were performed similary to those in technical recommendations for the crop, but fungal diseases were not chemically controlled to allow for selection of S0:2 progenies with genetic resistance.
Analyses of joint variance, including locations within each cycle, were performed according to the linear model: yijkm = µ +lk+bj/k+tm+gi/m+tlmk+glik+εijkm,
where yijkm is the observation of genotype i, in block
j, in location k, belonging to type m; µ is the constant inherent to all observations; lk is the fixed effect of
location k (k=1, 2, ..., K); bj/k is the fixed effect of block
type m (M=2, with a group of progenies and another of checks); gi/m is the effect of genotype i (progenies
of random effect and checks of fixed effect) in type m (i=1, 2, ..., P, P+1, P+2, ..., P+C, where P is the number of progenies and C is the number of checks), considering gi m/ ~NID( ,0 σg2); tl
mk is the fixed effect of
the interaction between type m and location k; glik is
the random effect of the interaction between genotype i and location k, considering glik ~NID( ,0 σgl2); and ε
ijkm
is the average experimental error associated with the ijkmth plot, considered as independent and identically
distributed, under NID(0, σ2).
Based on the mathematical expectation of the mean squares with the inclusion of all locations per cycle, the following variance components and genetic and phenotypic parameters were estimated, using the expressions: error variance among plots (σ2), σ2=
MSE;
variance of the progeny × location interaction
(σ ),σ ( ) / ;
pl pl MSPL MSE k 2 2
1
= − genetic variance
among progenies S0 2 p p MSP MSE k
2 2
2
: (σ ),σ =( − ) / ;
phenotypic variance among averages of progenies
S0 2 F F MSP k
2 2
2
: (σ ),σ / ;
= and broad-sense heritability
coefficients among averages of progenies
S0 2 hp hp p F
2 2 2 2
100
: ( ), ( / ) .
= σ σ In these expressions, MSP is
the mean square of S0:2 progenies; MSPL is the mean square of the interaction between progeny and location; and k1 and k2 are the values of the coefficients associated with the estimate of the variance component in the expressions E MS( PL)=σ2+klσpl2 E MS( P)=σ2+k σp,
2 2 and
resulting from the unbalanced experimental data set. In order to estimate these parameters, the confidence intervals (CI) were obtained for (1-α)=95% probability, according to Burdick & Graybill (1992), since the size of the sample directly affects the precision of the estimates (Souza Júnior, 1989).
Estimates for the parameters coefficients of experimental and genetic variation, in percentage, and of the b-variation index were also obtained according to Vencovsky (1987). For each cycle, selective accuracy (rgg), was estimated using the expression
r F
gg=( − / ) ,
/
1 1 1 2 where F is the value of the variance
ratio associated with the combined analysis of variance (Resende & Duarte, 2007). For each pair of locations per cycle, Pearson’s correlation coefficient was estimated, which is used to phenotypically correlate the averages among genotypes ( ),rF which include S0:2 progenies and checks. The t-test was used to determine the significance of the correlations, associated with (n - 2) degrees of freedom. All the statistical analyses were performed with the SAS software (SAS Institute Inc., Cary, NC, USA) through the GLM, Varcomp, and IML procedures.
Results and Discussion
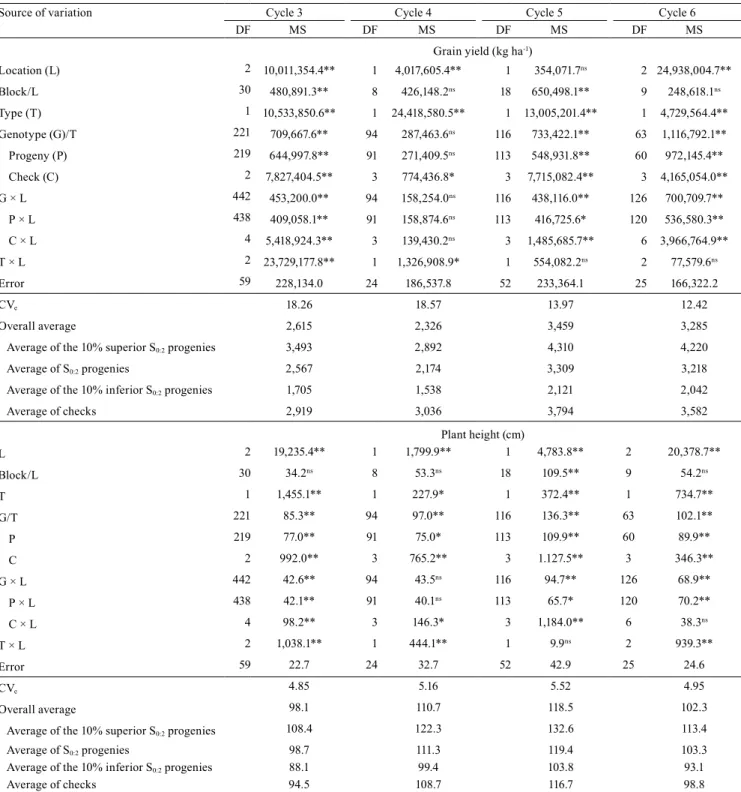
The analysis of variance of GY and PH showed satisfactory experimental precision in the four cycles of recurrent selection due to the low magnitudes of the coefficient of experimental variation (CVe), similar to those found for upland rice crop by Costa et al. (2002) and Bueno et al. (2012). Greater estimates of the CVe were obtained for GY, which was expected, because this trait is the one of more complex genetic inheritance and is strongly affected by the environment (Table 2).
Differences were observed for the effect of progenies in cycles 3, 5, and 6 for GY (Table 2). The significant contrasts and high amplitudes among the
S0:2 progenies, 10% superior (Ps) and 10% inferior (Pi),
in all cycles, are an indicative of the presence of favorable genetic variability in the population. The P
s
averages were above those of the checks in cycles 3, 5, and 6, highlighting the potential of the population to generate transgressives for GY. Since GY is
Table 1. Location, cultivars used as checks, and number
of progenies in each selection cycle (3, 4, 5, and 6), in the yield trials of S0:2 progenies of the CNA6 upland rice (Oryza
sativa) population.
Description Number of progenies
3 4 5 6
Location (geographic coordinates)(1)
Santo Antônio de Goiás, GO (16°40'S, 49°15'W) 1 1 1 1
Primavera do Leste, MT (5°33'S, 54°17'W) 1
Sinop, MT (11°52'S, 55°29'W) 1 1
Vilhena, RO (12°44'S, 60°08'W) 1
Teresina, PI (05°05'S, 42°48'W) 1
Paragominas, PA (02°59'S, 47°21'W) 1
Check
BRS Primavera 1 1 1 1
Guarani 1 1 1
Carajás 1 1 1
BRS Bonança 1 1 1
BRSMG Curinga 1
BRS Sertaneja 1
Progenies S0:2 220 92 114 61
correlated to several other traits and diseases were not chemically controlled, one of the possible reasons for the higher P
s averages is the higher genetic resistance
of the S0:2 progenies to diseases, especially rice blast
(Magnaporthe grisea), responsible for the greatest
losses in rice (Wang & Valent, 2009).
For PH, differences were found regarding the effect of progenies in all cycles, evidencing a significant contrast among the averages of the progenies. The amplitudes among the P
s and Pi averages were
uniform, considering the first and the last cycle for PH (Table 2). Just as for GY, it is possible to infer that the genetic variability for PH was also maintained in the population throughout the recurrent selection cycles.
The effect of the progeny × location (P×L) interaction was nonsignificant only in cycle 4 for both traits (Table 2). The effect of the P×L interaction may interfere in the selection of superior progenies with high adaptability, if the interaction to be of the crossover type, which is an indicative of the inconsistency in the superiority of genotypes among environments (Vencovsky & Barriga, 1992). For both traits evaluated, the effect of the check × location (C×L) interaction was more evident than that of the P×L interaction on the interaction behavior with the environment – possibly due to the genetic nature (degree of endogamy) of the genotypes (progenies or lines). According to Cockerham (1963), this can be explained by the fact that the genotypic variance within
S0:2 progenies – which would be equivalent to the F2:4 generation for the allelic frequency of 0.5 – is close to 3/4 of the additive variance and 3/8 of the dominance variance. However, genetic variance within endogamic lines, corresponding to the checks, is equal to zero.
For both traits, the CIs associated with the estimates of genotypic variance among S0:2 (σp
2)
progenies were consistent, since the estimates differed statistically from zero (≤0.05), indicating good precision (Table 3). A higher number of samples allows obtaining more precise estimates (Souza Júnior, 1989). However, in the present study, the estimates for the CI were not significantly affected by the number of samples, even in cycles 4 and 6 in which fewer S0:2 progenies were evaluated (Table 1). Therefore, it is possible to infer that the genotypic variance among
S0:2 progenies was maintained during the selection cycles for GY and PH. These results indicate that no genetic derivation was observed when samples of
superior genotypes were selected for recombination in each cycle; or, in case genetic derivation occurred, the genotypic variance among S0:2 progenies may have been maintained due to the rupture of genic blocks through the recombinations performed in each new cycle (Bearzoti & Vencovsky, 2002).
The CIs associated with the estimates of the P×S (σpl2 ) interaction for GY and PH, as well as those
related to σp2, were consistent throughout the cycles,
except in cycle 4 (Table 3), in which σpl2 showed a
negative CI for PH, being considered equal to zero. For PH, although the estimate of σpl2 did not show negative
CI, it had a high amplitude. The inconsistency of the CIs for the estimates in cycle 4 was attributed to the absence of a significant effect and to the low number of degrees of freedom related to the P×L interaction. Overall, a good precision was observed for the estimates, with relatively uniform amplitudes of the CIs throughout the four cycles of recurrent selection. The high σpl2 detected and the significance of the effect
of the P×L interaction (Tables 2 and 3) are indicators of the different behavior of the S0:2 progenies among locations, for both traits.
The estimates of the broad-sense coefficient of heritability among the averages of the S0:2 progenies (hp
2), were precise throughout the selection
cycles, based on their low CIs for GY and PH. The exception was cycle 4 for GY, in which hp
2
did not differ statistically from zero (α=0.05) due to the strong effect of residual variance (σ2) (Tables 2 and 3). The magnitude of the hp2 obtained in the present
study for both traits (Table 3) is similar to those found in other works with upland rice crops (Colombari Filho et al., 2013; Ahmad et al., 2015; Tuhina-Khatun et al.,
2015).
the unit (1.36), which allows predicting significant
genetic gain in GY for the next recurrent selection cycle (Table 3). As to PH, the b estimates, as well as those of h
p
2 and CVg, remained relatively constant throughout
Table 2. Summary of the combined analysis of variance of each recurrent selection cycle, with their respective coefficients
of experimental variation (CVe), overall average, averages of the S0:2 progenies, averages of the 10% superior and 10%
inferior S0:2 progenies, and average of the checks for the traits grain yield and plant height of the CNA6 upland rice (Oryza
sativa) population.
Source of variation Cycle 3 Cycle 4 Cycle 5 Cycle 6
DF MS DF MS DF MS DF MS
Grain yield (kg ha-1)
Location (L) 2 10,011,354.4** 1 4,017,605.4** 1 354,071.7ns 2 24,938,004.7**
Block/L 30 480,891.3** 8 426,148.2ns 18 650,498.1** 9 248,618.1ns
Type (T) 1 10,533,850.6** 1 24,418,580.5** 1 13,005,201.4** 1 4,729,564.4**
Genotype (G)/T 221 709,667.6** 94 287,463.6ns 116 733,422.1** 63 1,116,792.1**
Progeny (P) 219 644,997.8** 91 271,409.5ns 113 548,931.8** 60 972,145.4**
Check (C) 2 7,827,404.5** 3 774,436.8* 3 7,715,082.4** 3 4,165,054.0**
G × L 442 453,200.0** 94 158,254.0ns 116 438,116.0** 126 700,709.7**
P × L 438 409,058.1** 91 158,874.6ns 113 416,725.6* 120 536,580.3**
C × L 4 5,418,924.3** 3 139,430.2ns 3 1,485,685.7** 6 3,966,764.9**
T × L 2 23,729,177.8** 1 1,326,908.9* 1 554,082.2ns 2 77,579.6ns
Error 59 228,134.0 24 186,537.8 52 233,364.1 25 166,322.2
CVe 18.26 18.57 13.97 12.42
Overall average 2,615 2,326 3,459 3,285
Average of the 10% superior S0:2 progenies 3,493 2,892 4,310 4,220
Average of S0:2 progenies 2,567 2,174 3,309 3,218
Average of the 10% inferior S0:2 progenies 1,705 1,538 2,121 2,042
Average of checks 2,919 3,036 3,794 3,582
Plant height (cm)
L 2 19,235.4** 1 1,799.9** 1 4,783.8** 2 20,378.7**
Block/L 30 34.2ns 8 53.3ns 18 109.5** 9 54.2ns
T 1 1,455.1** 1 227.9* 1 372.4** 1 734.7**
G/T 221 85.3** 94 97.0** 116 136.3** 63 102.1**
P 219 77.0** 91 75.0* 113 109.9** 60 89.9**
C 2 992.0** 3 765.2** 3 1.127.5** 3 346.3**
G × L 442 42.6** 94 43.5ns 116 94.7** 126 68.9**
P × L 438 42.1** 91 40.1ns 113 65.7* 120 70.2**
C × L 4 98.2** 3 146.3* 3 1,184.0** 6 38.3ns
T × L 2 1,038.1** 1 444.1** 1 9.9ns 2 939.3**
Error 59 22.7 24 32.7 52 42.9 25 24.6
CVe 4.85 5.16 5.52 4.95
Overall average 98.1 110.7 118.5 102.3
Average of the 10% superior S0:2 progenies 108.4 122.3 132.6 113.4
Average of S0:2 progenies 98.7 111.3 119.4 103.3
Average of the 10% inferior S0:2 progenies 88.1 99.4 103.8 93.1
Average of checks 94.5 108.7 116.7 98.8
the selection cycles, but with a lower estimate for cycle 4 due to the greater experimental error (σ2) and to
the presence of a strong P×L interaction. Therefore, it is possible to conclude that the genotypic variance observed in the last recurrent selection cycle, for both traits, represents the possibility of selection gains in the next cycles.
For autogamous species (Menezes Júnior et al., 2008; Breseghello et al., 2009; Niu et al., 2010; Benites & Pinto, 2011; Morais Júnior et al., 2015), recurrent selection has shown good results both for high- and low-heritability traits. Long-term genetic gains in recurrent selection are a result of the continuous increase in the frequency of favorable alleles in the population, pointing the average values of the population to the desired direction. However, the genetic variability of the traits subjected to selection should not be reduced to allow selection. In a study using simulation, Bearzoti & Vencovsky (2002) found genetic gains in more than 36 recurrent selection cycles for a low-heritability trait (10%), with effective size equal to 20, i.e., 20 progenies (S0:1, S0:2, or superior generations) recombined in a circular diallel mating design. This result indicates the possibility of genetic gains with recurrent selection during a long period, even in populations with a small effective size, probably because recurrent selection promotes the rupture of genic blocks, which increases both the frequency of some favorable genetic combinations and the available genetic variability. However, it is necessary to recombine samples with an adequate effective size, which take into account the genetic parentage among the selection units, in order to maintain the genetic variability of the recurrent selection populations. In the case of recurrent selection programs for rice, which use male sterility and S0:1 (Ne=1) seeds for recombination, the size of this sample is equal to 50 progenies (Morais Júnior et al., 2015).
Resende & Duarte (2007) recommend adopting genetic and statistical approaches for progeny tests. The authors also suggest using selective accuracy (rgg ) to assess the efficiency of the inferences on the
genotypic values of the evaluated genotypes and as a measure of the degree of experimental precision. The rgg estimates for GY showed values considered
moderate, in cycle 4, and very high, in cycle 6 (Table 3). Regarding PH, the rgg values were considered
high for all cycles. It was observed that rgg estimates
presented a direct relationship with the hp 2, CV
g and b estimates; the same explanation applies for the magnitude of all four parameters. Resende & Duarte
Table 3. Estimates of the genetic and phenotypic parameters
for the traits grain yield and plant height of the CNA6 upland rice (Oryza sativa) population in four selection cycles and their respective superior (SL) and inferior (IL) limits of confidence intervals(1).
Parameter Cycle 3 Cycle 4 Cycle 5 Cycle 6
Grain yield (kg ha-1)
SL 214,592.2 667,578.3 338,369.6 494,311.3
σp 2
144,709.2 45,185.4 173,770.8 293,592.5
IL 105,540.2 15,410.1 111,736.7 198,769.5
SL 371,881.5 -29,991,760.9(2) 528,258.6 669,016.8
σpl2
188,423.3 -29,454.0 201,806.6 404,697.9
IL 120,034.6 -5,862.8 106,967.9 272,283.6
SL 339,366.5 361,007.4 355,652.8 316,931.7
σ2 228,134.0 186,537.8 233,364.1 166,322.2
IL 163,910.5 113,730.8 164,906.5 102,298.1
SL 77.08 66.19 73.83 91.66
hp 2
64.63 31.27 57.49 82.89
IL 48.00 -23.60 33.61 68.03
CVg 14.82 9.78 12.59 16.84
b 0.81 0.53 0.90 1.36
r
gg 0.80 0.56 0.76 0.91
Plant height (cm)
SL 26.44 55.06 66.23 46.21
σp2
18.86 22.55 36.86 23.81
IL 14.28 13.19 24.08 15.26
SL 37.18 8.022.90 104.32 90.53
σpl2
20.21 7.88 25.05 49.83
IL 13.05 1.57 11.01 32.92
SL 33.74 63.23 65.69 46.86
σ2 22.68 32.67 42.91 24.59
IL 16.29 19.92 30.23 15.12
SL 80.92 78.58 76.05 86.66
h2p
70.55 56.45 60.94 72.66
IL 56.71 21.69 38.85 48.91
CVg 4.40 4.27 5.09 4.72
b 0.91 0.83 0.91 0.97
r
gg 0.84 0.75 0.78 0.85
(1)σ
p 2
, genetic variance among progenies S0:2; σpl2 , variance of the progeny × location interaction; σ2, residual variance;
hp2,
(2007) showed that the parameter selective accuracy is more adequate than the coefficient of experimental variation to evaluate experimental precision in trials for progeny testing, since these are associated with greater genotypic variance and lower residual variance.
High magnitudes of the mean squares of the G×L interaction (MSGL) were detected for all pairs of
locations, except for two pairs: the municipality of Primavera do Leste, in the state of Mato Grosso, and the municipality of Vilhena, in the state of Rondônia; and the municipality of Santo Antônio de Goiás, in the state of Goiás, and the municipality of Sinop, in the state of Mato Grosso (cycle 4), all in Brazil (Table 4). Although most of the estimates of phenotypic correlation among averages (rF) were significant, all of them showed
low magnitudes due to the lack of correlation among genotype (S0:2 progenies and controls) performance and locations, both for GY and PH, evidencing the strong presence of GxL interaction of crossover type. Therefore, this type of GxL interaction is another factor that may have been affected by the variance components and, possibly, the selection gains in the population. The G×L interaction is considered one of the main limiting factors to the response to selection and, in general, to the efficiency of the genetic breeding programs aiming the average performance of genotypes, since, in upland rice, reducing the effects of the G×L interaction is important, because lines that are widely adapted, and not specific to locations or regions, are targeted (Colombari Filho et al., 2013).
The GY averages of the S0:2 progenies in cycles 5 and 6 were greater than those in the first cycles, which indicates the possible genetic progress of the trait (Table 2). However, for PH, the results were not as favorable, since the averages of the S0:2 progenies remained constant throughout the selection cycles, which probably did not contribute to increase the average lodging tolerance of the population due to the lower frequency of short plants. This is possibly attributed to the recombination performed in the field with the male-sterility gene, where the tallest, fertile male plants, originated from segregation within progenies, were favored by the dispersion of pollen in relation to the lowest, fertile male plants, contrary to selection aiming lower PH. Therefore, when genetic male sterility is used, removing the taller plants (roguing) is recommended during the recombination
of the population, in order to assure the expected response to selection for PH.
The breeding program for recurrent selection of upland rice of Embrapa aims to genetically improve the populations for a geographic region that is characterized by diverse soils and climatic conditions (Breseghello et al., 2011; Colombari Filho et al., 2013). Therefore, in the next selection cycles, even if genetic variability is maintained for GY and PH in the CNA6 population due to the strong effect of the G×L interaction, it is still necessary to increase the number of replications and locations in order to obtain selection gains superior to those of previous cycles (Morais Júnior et al., 2015), even when satisfactory selection gains are reached. The reason do to this is to increase the heritability among the averages of progenies and, consequently, the expected response to selection (Bernardo, 2010). In addition, changing locations should be avoided during selection cycles, since indirect selection may make null or reduce genetic gain due to the low correlation among genotype performance and locations.
Table 4. Estimates of the mean squares of the genotype ×
pair of locations interaction (MSGL) and of the phenotypic
correlation of genotypes (rF) among pairs of locations (A1
and A2), for grain yield and plant height of the CNA6 upland
rice (Oryza sativa) population, in each cycle of recurrent
selection.
Cycle Location(1) Grain yield (kg ha-1) Plant height (cm)
A1 A2 MSGL rF MSGL
rF
3 SAG PRI 517,004.50** 0.08ns 34.86ns 0.25**
3 SAG VIL 384,000.60* 0.05ns 46.79** 0.15*
3 PRI VIL 326,007.50ns 0.22** 44.60* 0.23**
4 SAG SIN 158,874.60ns 0.21** 40.07ns 0.26**
5 SAG TER 416,725.60* 0.18** 65.66* 0.27**
6 SAG SIN 677,458.48** 0.10ns 83.75* 0.20ns
6 SAG PAR 394,141.83* 0.26** 40.32ns 0.07ns
6 SIN PAR 553,398.48** 0.17** 87.78** -0.13*
Mean 0.16 0.16
Conclusions
1. The genetic variability of the CNA6 upland rice (Oryza sativa) population regarding grain yield and
plant height is maintained during the four cycles of recurrent selection.
2. The progeny × location interaction affects the estimates of genetic parameters, and the crossover type is predominant.
Acknowledgments
To the team of the genetic breeding program of Empresa Brasileira de Pesquisa Agropecuária (Embrapa), for support; to research assistants and field workers, for data collection; and to Coordenação de Aperfeiçoamento de Pessoal de Nível Superior (Capes), for the scholarship granted.
References
AHMAD, F.; HANAFI, M.M.; HAKIM, M.A.; RAFII, M.Y.; AROLU, I.W.; ABDULLAH, S.N.A. Genetic divergence and heritability of 42 coloured upland rice genotypes (Oryza sativa) as revealed by microsatellites marker and agro-morphological traits. PLoS One, v.10, p.1-18, 2015. DOI: 10.1371/journal.pone.0138246. BEARZOTI, E.; VENCOVSKY, R. Simulation of marker-assisted recurrent selection in autogamous species. Crop Breeding and Applied Biotechnology, v.2, p.1-10, 2002. DOI: 10.12702/1984-7033.v02n01a01.
BENITES, F.R.G.; PINTO, C.A.B.P. Genetic gains for heat tolerance in potato in three cycles of recurrent selection. Crop Breeding and Applied Biotechnology, v.11, p.133-140, 2011. DOI: 10.1590/S1984-70332011000200005.
BERNARDO, R. Breeding for quantitative traits in plants. 2nd ed. Woodbury: Stemma Press, 2010. 400p.
BRESEGHELLO, F.; MORAIS, O.P. de; PINHEIRO, P.V.; SILVA, A.C.S.; CASTRO, E. da M. de; GUIMARÃES, E.P.; CASTRO, A.P. de; PEREIRA, J.A.; LOPES, A. de M.; UTUMI, M.M.; OLIVEIRA, J.P. de. Results of 25 years of upland rice breeding in Brazil. Crop Science, v.51, p.914-923, 2011. DOI: 10.2135/ cropsci2010.06.0325.
BRESEGHELLO, F.; MORAIS, O.P.; CASTRO, E.M.; PRABHU, A.S.; BASSINELLO, P.Z.; PEREIRA, J.A.; UTUMI, M.M.; FERREIRA, M.E.; SOARES, A.A. Recurrent selection resulted in rapid genetic gain for upland rice in Brazil. International Rice Research Notes, v.34, p.1-4, 2009.
BUENO, L.G.; VIANELLO, R.P.; RANGEL, P.H.N.; UTUMI, M.M.; CORDEIRO, A.C.C.; PEREIRA, J.A.; FRANCO, D.F.; MOURA NETO, F.; MENDONÇA, J.A.; COELHO, A.S.G.; OLIVEIRA, J.P. de; BRONDANI, C. Adaptabilidade e estabilidade de acessos de uma coleção nuclear de arroz. Pesquisa
Agropecuária Brasileira, v.47, p.216-226, 2012. DOI: 10.1590/ S0100-204X2012000200010.
BURDICK, R.K.; GRAYBILL, F.A. Confidence intervals on variance components. New York: Marcel Deckker, 1992. 211p. CHÂTEL, M.; OSPINA, Y.; RODRIGUEZ, F.; LOZANO, V.H.; DELGADO, H. Upland rice composite population breeding and selection of promising lines for Colombian savannah ecosystem. Pesquisa Agropecuária Tropical, v.38, p.1-5, 2008.
COCKERHAM, C.C. Estimation of genetic variances. In: HANSON, W.D.; ROBINSON, H.F. (Ed.). Statistical genetics and plant breeding. Washington: National Academy of Sciences, 1963. p.53-93.
COLOMBARI FILHO, J.M.; RESENDE, M.D.V. de; MORAIS, O.P. de; CASTRO, A.P. de; GUIMARÃES, E.P.; PEREIRA, J.A.; UTUMI, M.M.; BRESEGHELLO, F. Upland rice breeding in Brazil: a simultaneous genotypic evaluation of stability, adaptability and grain yield. Euphytica, v.192, p.117-129, 2013. DOI: 10.1007/s10681-013-0922-2.
COSTA, N.H. de A.D.; SERAPHIN, J.C.; ZIMMERMANN, F.J.P. Novo método de classificação de coeficientes de variação para a cultura do arroz de terras altas. Pesquisa Agropecuária Brasileira, v.37, p.243-249, 2002. DOI: 10.1590/S0100-204X2002000300003.
FALCONER, D.S.; MACKAY, T.F.C. 4th ed. Introduction to quantitative genetics. Edinburgh: Longman, 1996. 464p. FAO. Food and Agriculture Organization of the United Nations. Faostat: crops. Rome, 2013. Available at: ˂http://faostat.fao.org/ site/567/DesktopDefault.aspx?PageID=567#ancor˃. Accessed on: July 23 2016.
GERALDI, I.O. Selección recurrente en el mejoramiento de plantas. In: GUIMARÃES, E.P. (Ed.). Seleción recurrente em arroz. Cali: CIAT, 1997. p.3-11.
HALLAUER, A.R.; CARENA, M.J.; MIRANDA FILHO, J.B. Quantitative genetics in maize breeding. New York: Springer, 2010. 663p.
MARTÍNEZ, C.P.; TORRES, E.A.; CHATEL, M.; MOSQUERA, G.; DUITAMA, J.; ISHITANI, M.; SELVARAJ, M.; DEDICOVA, B.; TOHMÉ, J.; GRENIER, C.; LORIEUX, M.; CRUZ, M.; BERRÍO, L.; CORREDOR, E.; SAN MARTIN, G.Z. de; BRESEGHELLO, F.; PEIXOTO, O.; COLOMBARI FILHO, J.M.; CASTRO, A.P. de; LOPES, S.I.G.; BARBOSA, M.; FUNCK, G.R.D.; BLANCO, P.; VIDA, F.P. de; MOLINA, F.; ROSAS, J.; MARTÍNEZ, S.; BONNECARRERE, V.; GARAYCOCHEA, S.; CARRACELAS, G.; MARIN, A.; CORREA-VICTORIA, F.; CAMARGO, I.; BRUZZONE, C.B. Rice breeding in Latin America. In: JANICK, J. (Ed.). Plant Breeding Reviews. New Jersey: J. Wiley & Sons, 2014. v.38, p.187-277. DOI: 10.1002/9781118916865.ch05.
MENEZES JÚNIOR, J.Â.N.; RAMALHO, M.A.P.; ABREU, Â. de F.B. Seleção recorrente para três caracteres do feijoeiro. Bragantia, v.67, p.833-838, 2008. DOI: 10.1590/S0006-87052008000400004.
PEREIRA, J.A.; WRUCK, F.J.; COLOMBARI FILHO, J.M. Genetic progress after cycles of upland rice recurrent selection. Scientia Agricola, v.72, p.297-305, 2015. DOI: 10.1590/0103-9016-2014-0137.
NIU, N.; ARIEF, V.N.; DELACY, I.H.; LUSH, D.; SHEPPARD, J.; ZHANG, G.; DIETERS, M.J. Genetic gain in yield and protein over two cycles of a wheat recurrent selection program. Breeding Science, v.60, p.181-186, 2010. DOI: 10.1270/jsbbs.60.181.
RAMALHO, M.A.P.; ABREU, Â. de F.B.; SANTOS, J.B. dos; NUNES, J.A.R. Aplicações da genética quantitativa no melhoramento de plantas autógamas. Lavras: Ed. da UFLA, 2012. 522p.
RESENDE, M.D.V. de; DUARTE, J.B. Precisão e controle de qualidade em experimentos de avaliação de cultivares. Pesquisa Agropecuária Tropical, v.37, p.182-194, 2007.
SOUZA JÚNIOR, C.L. de. Componentes da variância genética e suas implicações no melhoramento vegetal. Piracicaba: FEALQ, 1989. 134p.
TUHINA-KHATUN, M.; HANAFI, M.M.; RAFII YUSOP, M.; WONG, M.Y.; SALLEH, F.M.; FERDOUS, J. Genetic variation, heritability, and diversity analysis of upland rice (Oryza sativa L.) genotypes based on quantitative traits. BioMed Research International, v.2015, p.1-7, 2015. DOI: 10.1155/2015/290861. VENCOVSKY, R. Herança quantitativa. In: PATERNIANI, E.; VIEGAS, G.P. (Ed.). Melhoramento e produção de milho. Campinas: Fundação Cargill, 1987. p.135-214.
VENCOVSKY, R.; BARRIGA, P. Genética biométrica no fitomelhoramento. Ribeirão Preto: Revista Brasileira de Genética, 1992. 496p.
WANG G.-L.; VALENT, B. (Ed.). Advances in genetics, genomics and control of rice blast disease. New York: Springer, 2009. 430p. DOI: 10.1007/978-1-4020-9500-9.