Two Brazilian Upland Rice Cultivars
Anne S. Prabhu,1 Leila G. Araújo,1 Gisele B. Silva1 & Maria G. Trindade2
1Embrapa Arroz e Feijão, Cx. Postal 179, CEP 75375-000, Santo Antônio de Goiás, GO, e-mail: prabhu@cnpaf.embrapa.br;
2Embrapa Trigo, Cx. Postal 179, CEP 75375-000, Santo Antônio de Goiás, GO
Author for correspondence: Anne S. Prabhu
PRABHU, A.S., ARAÚJO, L.G., SILVA, G.B. & TRINDADE, M.G. Virulence and rep-PCR analysis of Pyricularia grisea isolates from two Brazilian upland rice cultivars. Fitopatologia Brasileira 32:013-020. 2007.
ABSTRACT
The phenotypic and genetic diversity of 77 isolates of Pyricularia grisea collected from two upland rice cultivars, Maravilha and Primavera, was studied. Isolates exhibiting compatible reaction to cv.Primavera were incompatible to cv.Maravilha and vice versa, with the exception of six isolates that were compatible to both cultivars. The virulence of
isolates from cv. Maravilha on 32 test genotypes of rice was significantly higher (t = 9.09, p ≤ 0.0001) than the isolates
from cv.Primavera. A phenogram constructed from virulence data showed two main groups, one constituted mainly of isolates from cv.Primavera (97.6%) and the other of isolates from cv.Maravilha (91.17%). Rep-PCR analysis of isolates using two primers designed from sequences of Pot2 showed that isolates could be clustered broadly into two groups.
The average similarity within a cluster of isolates from cv.Primavera was significantly greater than the average similarity among the isolates of cv.Maravilha (t = 5.37, p ≤ 0.0001). There was close correspondence between clusters based on PCR and virulence data (r = 0.48, p ≤ 0.011). The results showed that isolates of P. grisea were cultivar specific and had low
phenotypic and genetic diversity.
Additional keywords: Oryza sativa, rice blast, Magnaporthe grisea, pathotypes, genetic diversity.
RESUMO
Análise de virulência e rep-PCR de isolados de Pyricularia grisea de duas cultivares brasileiras de arroz de terras altas
A diversidade fenotípica e genética de Pyricularia grisea foi avaliada em uma amostra de 77 isolados coletados das cultivares de arroz de terras altas Maravilha e Primavera. Isolados que apresentaram reações compatíveis em cv. Primavera foram incompatíveis em cv.Maravilha e vice versa, com exceção de seis isolados que foram compatíveis nas duas cultivares.
A virulência de isolados provenientes da cv. Maravilha, em 32 genótipos de arroz foi significativamente maior (t = 9,09; p ≤
0,0001) que dos isolados da cv. Primavera. O fenograma construído a partir dos dados fenotípicos mostrou dois grupos, um constituído principalmente por isolados da cv. Primavera (97,6%) e outro de isolados da cv. Maravilha (91,17%). A análise de rep-PCR dos isolados, utilizando os primers Pot2., revelou dois grupos distintos. A similaridade média dos isolados da
cv. Primavera dentro de grupo foi maior do que a similaridade média dos isolados da cv. Maravilha (t = 5,37; p ≤ 0,0001). Observou-se uma correspondência entre a análise de agrupamento baseada em PCR e virulência fenotípica (r = 0,48; p ≤0,011). Os resultados mostraram ainda uma alta especificidade de isolados de P. grisea para cada cultivar e baixa variação fenotípica e genética.
Palavras-chave adicionais: Oryza sativa,brusone, Magnaporthe grisea, patótipos, diversidade genética.
INTRODUCTION
Rice blast caused by Pyricularia grisea Sacc. [teleomorph Magnaporthe grisea (T.T. Hebert) M.E. Barr] is the major yield constraint in upland rice in Brazil. It is widely recognized that when a cultivar with moderate resistance is extensively grown, pathotypes matching their resistance genes will increase in frequency resulting in greater susceptibility (Filippi & Prabhu, 2001). The susceptibility of the widely grown upland rice cultivars Maravilha and Primavera has increased since their release, and currently the grain yield losses are considered significant.
Studies leading to determine the virulence diversity of pathogen populations isolated from widely grown cultivars
is important for blast resistance breeding. Rice blast fungus populations are composed of pathotypes or physiological races with distinct virulence characteristics. These pathotypes are identified based on reaction types on a set of eight standard international differentials (Atkins etal., 1967).
In Brazil and many other countries, a great number of physiological races have been reported indicating changes
in virulence frequencies (Ou, 1980; Bonman et al., 1987). In
an earlier investigation, the pathotypes IC-1 and IB-9 were found to be predominant in a sample population of P. grisea isolates collected from the cv. Primavera. In contrast, a relatively high frequency of isolates from the cv. Maravilha
were identified as pathotypes IB-41 and IB-9 (Prabhu et
IB-41 among isolates of Maravilha was also encountered among isolates of P. grisea retrieved from other upland rice cultivars (Filippi & Prabhu, 2001). The pathotype IC-1 was encountered at a high frequency only among isolates of cv. Primavera, whereas the pathotype IB-9 was commonly found among isolates of both cultivars Primavera and Maravilha. The pathotypes representing other groups (IA and ID) were obtained from the cultivars Primavera and Maravilha at low frequency (Prabhu et al., 2003).
As the information about virulence and genetic diversity of isolates retrieved from widely grown commercial cultivars is available their value and potential use in breeding for blast resistance increases. The genetic diversity of P. grisea is commonly assessed employing molecular techniques. Distinct DNA fingerprint groups or lineages were identified using the probe MGR586 (Filippi et al., 1999; Hamer, 1991; Zeigler et al., 1995). Many of these clonal lineages have been shown to exhibit restricted diversity (Levy et al., 1993; Xia et al., 1993; Chen et al.,
1995; Roumen et al., 1997; Don et al., 1999; Park et al.,
2003; Rathour et al., 2004). Because of difficulties in
large scale use of RFLP analysis, a rep-PCR technique with two primer sequences from Pot2 has been developed. Comparison of groupings of isolates based on Pot2 rep-PCR and those obtained using MGR586 showed a close correspondence (George et al., 1998). Analysis of P.
grisea isolates from irrigated rice cultivar Metica-1 using rep-PCR with two primer sequences from Pot2 generated fingerprint profiles ranging from one to nine bands (Filippi et al., 2002). Two distinct fingerprint groups or lineages were identified among 53 isolates collected from nine different commercial irrigated rice fields grown with cultivars Epagri 108 and 109 in the State of Tocantins, Brazil (Prabhu et al., 2002). Javan-Nikkhah et al. (2004) reported a low level of genetic diversity in the Iranian
P. grisea population similar to that reported elsewhere, using Pot2 rep-PCR analysis. The present paper reports the genetic and virulence diversity of populations of P.
grisea from two cultivars sampled from 1997 to 2001.
MATERIALS AND METHODS
Isolates
A collection of isolates of P. grisea was obtained from sporulating lesions on leaves and panicles of the cultivars Primavera and Maravilha, grown in experimental plots located at the Embrapa Arroz e Feijão, Santo Antonio de Goiás and in farmers’ fields in the State of Mato Grosso, during 1997/01. Single conidial isolates
were maintained on sterilized filter paper discs at 4 °C
+ 1 °C in the refrigerator. Forty-six isolates of P. grisea collected from cv. Primavera and 31 from cv. Maravilha were used in inoculation tests.
Virulence analysis
The virulence of each isolate was tested under
controlled greenhouse conditions, based on inoculation of 32 rice genotypes, including six elite upland rice breeding lines (CNAs 8711, CNAs 8934, CNAs 8812, CNAs 8170, CNAs 8540, CNAs 8983), twelve commercial rice cultivars (Aimoré, Bonança, Canastra, Carisma, Carajás, Confiança, Maravilha, Primavera, Progresso, Caiapó, 47, IAC-201), a somaclone of cultivar Araguaia (SC 09) with a known gene as a control for vertical resistance, besides eight standard international differentials (‘Raminad Str 3’, ‘Zenith’, ‘NP125’, ‘Dular’, ‘Kanto 51’, ‘Usen’, ‘Caloro’, ‘Sha-tia-tsão’) and five near isogenic lines of the cultivar ‘CO 39’ (‘C 101 LAC’, ‘C101A 51’, ‘C104 PKT’, ‘C101 PKT’, ‘C101- TTP-4L-23’). The test material was planted in plastic trays (30 x 15 x10 cm) containing 3 kg of soil fertilized with NPK (5g of 5-30-15 + Zn and 3g of ammonium sulfate per 3 kg of soil). An additional 2g of ammonium sulfate was applied 20 days after planting. Ten to twelve plants of each entry were sown in 0.4 m long rows, totaling 16 rows per tray.
Mycelial growth, sporulation on culture medium and inoculation procedure were adapted as described earlier (Filippi & Prabhu, 2001). Leaf blast reactions were assessed as compatible and incompatible, seven to nine days after inoculation. Lesion types 0, 1, 2, and 3 were considered incompatible and 4 to 9 as compatible in a 0-9 scale (IRRI, 1988). Inoculation tests were repeated twice and in case of ambiguous or intermediate reactions, the test was repeated again and the ones that gave consistent and uniform reaction were utilized. A tray containing international and Brazilian differential hosts was maintained as non-inoculated control to ensure that no contamination occurred during the inoculation.
DNA extraction and amplification
The molecular characterization of P. grisea isolates was done employing the DNA-fingerprinting protocol described by George et al. (1998). DNA extraction was performed using the modified method of Raeder & Broda (1985). Isolates were grown on culture medium (10 g dextrose supplemented with 2 g yeast extract per liter) in Erlenmeyer flasks for four days without agitation followed by 10 days with constant agitation in the dark, at room temperature. One or two mycelial paper discs were transferred to Erlenmeyer flasks containing 150 mL of culture medium.
The harvested mycelia were freeze-dried, lyophilized and macerated in liquid nitrogen. About 300 mg of powdered mycelium was suspended in 700 µl of extraction buffer (50 mM Tris-HCl, pH 8.0; 50 mM EDTA; 3% sodium dodecyl sulfate, wt/vol and 1% of mercaptoethanol) at 65ºC for at least one hour. Proteins were precipitated with 30 µl of potassium acetate pH 5.2. DNA was precipitated in 200 µl of cold isopropanol, washed with 70% ethanol, dried under vacuum and resuspended in TE buffer (10 mM Tris-HCl, pH 8.0; 1.0 mM EDTA) containing 10 mg/mL of RNase A and incubated at 37ºC for 30 minutes. The DNA concentration
The oligonucleotide sequences were based on the primer sequence of the repetitive element Pot 2 (EMBL accession Z33638), an inverted repeat transposon found in approximately 100 copies in M. grisea genome (Kachroo et al., 1994). The two primers ( Pot2-1 5´ CGGAAGCCCTAAAGCTGTTT 3´ and Pot2-2 5´CCCTCATTCGTCACACGTTC 3´) were designed from each end of Pot 2 in opposite directions so that the 3´ends were directed outward from each element.
DNA amplification reactions were performed as described by George et al. (1998), with the following modification: each 25 mL reaction contained: 50 ng DNA, 2.5 µl 10X buffer reaction (200 mM Tris - HCl, pH 8.4 and 500 mM of KCl), 2.0 µl 50 mM MgCl2; 0.5 µl dNTP
(10 mM each dATP, dGTP, dCTP and dTTP); 1.25 µl of
each primer (100mM); 5 units of Taq polymerase. Amplification products were separated by gel electrophoresis on 1.4% agarose gel in TBE buffer (90 mM Tris-borate and 2 mM EDTA) containing 10 mg/mL of ethidium bromide. DNA fragments were photographed under ultra-violet light, utilizing the photo documentation system, Eagle Eye II (Stratagene).
Data analysis
The virulence frequency of each isolate was calculated as the percentage of compatible reactions on 32 test genotypes. A binary matrix was created from phenotypic virulence analysis by assigning 1 to compatible reaction and 0 to incompatible reaction on test varieties before constructing a matrix of similarity between all pairs of isolates according to the Simple Matching coefficient (Sokal & Michener, 1958). The phenograms of the isolates were constructed based on the matrix of similarity using the unweighted pair groups with arithmetical averages (UPGMA) algorithm with NTSYS-pc version 2.2/1997 (Rohlf, 1997).
Fingerprinting patterns were determined based on the presence (1) or absence (0) of each fragment. The data were analyzed using the program NTSYS-pc version 2.0/1997. Genetic distances were calculated by Jaccard´s coefficient of similarity (Clifford & Stephenson, 1975). The matrix of genetic distances was used for cluster analysis using the UPGMA algorithm.
To determine the association between virulence and rep-PCR patterns, the similarity matrices based on virulence and rep-PCR data were compared by correlation analysis using the matrix comparison (MXCOMP) program of the NTSYS-pc. The significance of correlation was tested by Mantel test with 1,000 random permutations.
RESULTS
The virulence frequency of P. grisea isolates from the cultivars Primavera and Maravilha ranged from 25 to 75 percent and 46 to 75 percent, respectively
(Table 1). The mean virulence of the isolates from cv. Maravilha (63.58%) was significantly higher (t = 9.09, p = 0.0000), as compared to the isolates from cv. Primavera (41.80%). The majority of isolates exhibiting compatible reaction with cv.Primavera were incompatible with cv. Maravilha and vice versa (Table 2). However, six isolates from Primavera and 11 isolates from cv. Maravilha showed compatible reaction with both cultivars. Two isolates from cv.Primavera and three from cv. Maravilha were not found to be compatible with the cultivars of their origin under greenhouse test conditions.
The virulence frequency of isolates of P. grisea from Maravilha, on twelve commercial upland rice cultivars, was also greater compared to the ones from Primavera (Figure 1). Similarities in phenotypic virulence on 32 rice genotypes are shown in phenogram (Figure 2). All isolates were associated at 58% Simple Match similarity coefficient. At 74% similarity, two main groups were recognized: one constituted mainly of isolates from cv. Primavera (97.61%) and the other of the isolates from Maravilha (91.17%). There was no correlation between pathotype and virulence structure determined based on test genotypes for cultivar Primavera (R2 = 0.045, p ≤ 0.3843) and Maravilha (R2
= 0.1167, p ≤ 0.3495).
The rep-PCR fingerprint profiles of 26 of the 77 isolates tested are shown in Figure 3. The isolates exhibited differences and similarities in banding pattern varying from 4 to 15 fragments of 300 bp to 3.5 Kb in length. The banding pattern of twenty sample isolates from cv.Primavera (#27 to 46) was distinctly different from six isolates (#47 to 52) retrieved from cv.Maravilha.
The similarity coefficients varied from 0.3 to 1.0 and could be clustered broadly into two groups or lineages (Figure 4). At 24% similarity, two main groups were recognized; one was constituted only of isolates from cv. Primavera and the other of isolates from cv. Maravilha (95.65%). The average similarities within a cluster of isolates from cv. Primavera (0.50±0.020) were significantly greater than the average similarities among isolates of cv. Maravilha (0.33±0.019), t = 5.37, p = 0.0000. Forty-four of 46 isolates retrieved from cv. Primavera, with the exception of two isolates (#38 and 9) were clustered into one group. The similarity coefficients within the group constituted by isolates from cv. Primavera were greater than 0.50. The correlation coefficient between matrixes of rep-PCR and virulence was of 0.48, p ≤ 0.011 indicating significant association.
DISCUSSION
TABLE 1 -Isolates, collection site, year of collection and virulence frequency of Pyricularia grisea collected from the rice cultivars Primavera and Maravilha
aSerial number indicated in the phenogram; 1-46= isolates from cv. Primavera, 47-77= isolates from cv. Maravilha; baccession number of P. grisea culture collection of Embrapa Arroz e Feijão, code number is followed by lesion number (L) and the conidial number as an exponent; cCapivara = experimental station of Embrapa Arroz e Feijão, GO, Jaciara= experimental station of Empaer, MT, Palmital= experimental station of Embrapa Arroz e Feijão, GO; dvirulence frequency was calculated as the percentage of the total number of compatible reactions in relation to 32 test genotypes.
Number a Identification b Location/year c Virulence frequency d
1 Py 1300 -L1
2
Capivara/1997 56 2 P y 2379 -L3
1
Capivara/2000 38 3 Py 1303 -L2
1
Capivara/1997 44 4 Py 2376 - L1
1
Capivara /2000 38 5 Py 2389 -L4
5
Capivara/2000 32 6 Py1309 -P1
1
Capivara /1997 47 7 Py 2385 -L4
1
Capivara/2000 34 8 Py 2380 -L3
2
Capivara/2000 55 9 Py 1302 - L1
4
Capivara/1997 56 10 Py 1310 -P1
4
Capivara/1997 50 11 Py 2388 -L4
2
Capivara/2000 53 12 Py 1306 -L2
4
Capivara/1997 47 13 Py 2650 -L7
1
Jaciara/2001 44 14 Py 2651 -L8
1
Jaciara/2001 28 15 Py 2636 -1L31 Palmital/2001 47 16 Py 2644 - L1
1
Jaciara/2001 32 17 Py 2653 -L9
1
Jaciara/2001 50 18 Py 2648 -L6
1
Jaciara/2001 32 19 Py 2672 -L7
1
Jaciara/2001 38 20 Py 2721 -L2
1
Jaciara/2001 44 21 Py 2726 -L3
1
Jaciara/2001 38 22 Py 2734 -L7
1
Jaciara/2001 41 23 Py 2660 -L2
1
Jaciara/2001 38 24 Py 2732 -L4
1
Jaciara/2001 75 25 Py 2662 -L3
1
Jaciara/2001 41 26 Py 2667 -L5
1
Jaciara/2001 34 27 Py 2664 -L4
1
Jaciara/2001 34 28 Py 2669 -L6
1
Jaciara/2001 38 29 Py 2656 - L1
1
Jaciara/2001 38 30 Py 2689 -L12
1
Jaciar/2001 25 31 Py 2753 -L15
1
Jaciara/2001 25 32 Py 2684 -L11
2
Jaciara/2001 69 33 Py 2694 -L13
4
Jaciara/2 001 34 34 Py 2745 -L12
1
Jaciara/2001 34 35 Py 2741 -L11
1
Jaciara/2001 28 36 Py 2739 -L10
1
Jaciara/2001 47 37 Py 2748 -L13
1
Jaciara/2001 41 38 Py 2698 -L15
2
Jaciara/2001 65 39 Py 2754 -L15
2
Jaciara/2001 38
40 Py 2713 -L19 Jaciara/2001 34 41 Py 2538 -L2
3
Ca pivara/2000 38 42 Py 2623 -L1
1
Palmital/2001 69 43 Py 2758 -L16
1
Palmital/2001 32 44 Py 2768 -L18
1
Palmital/2001 32 45 Py 2704 -L17
1
Palmital/2001 38 46 Py 2634 -L2
1
Palmital/2001 32 47 Py 1383 -L1
1
Capivara/1997 59 48 Py 1388 - L1
6
Capivara/1997 56 49 Py 1389 - L2
1
Capivara/1997 46 50 Py 1390 - L2
2
Capivara/1997 59 51 Py1600 - P1
1
Capivara/1998 56 52 Py 1601 - P1
2
Capivara/1998 59 53 Py 1604 - P2
2
Capivara/1998 53 54 Py 1607 - P4
3
Capivara/1998 53 55 Py 2002 - L1
2
Capivara/1999 69 56 Py 2003 - L1
3
Capivara /1999 65 57 Py 2004 - L2
1
Capivara/1999 63 58 Py 2006 - L2
4
Capivara/1999 71 59 Py 2007 - L2
5
Capivara/1999 59 60 Py 2434 - L1
2
Capivara/2000 46 61 Py 2437 - L2
2
Capivara/2000 63 62 Py 2441 - L3
1
Capivara/2000 71 63 Py 2447 - L4
3
Capivara/2000 71 64 Py 25 84 - L3
1
Capivara/2001 71 65 Py 2586 - L4
1
Capivara/2001 65 66 Py 2588 - L5
1
Capivara/2001 75 67 Py 2594 - L7
1
Capivara/2001 71 68 Py 2595 - L8
1
Capivara/2001 71 69 Py 2597 - L9
1
Capivara/2001 75 70 Py 2600 - L10
1
Capivara/2001 65 71 Py 2603 - L11
1
Capivara /2001 69 72 Py 2606 - L12
1
Capivara/2001 75 73 Py 2608 - L13
1
Capivara/2001 63 74 Py 2614 - L16
1
Capivara/2001 63 75 Py 2615 - L17
1
Capivara/2001 59 76 Py 2618 - L1
1
Capivara/2001 65 77 Py 2621 - L2
1 Capivara/2001 65 1 Number a Identification b Location/year c Virulence frequency d
three from cv. Maravilha were not found to be compatible to cultivars of their origin. The extent of compatibility of isolates with cultivar of origin is variable. Chen et al. (1995) observed that only 41% of isolates were fully compatible to
FIG. 1 - Virulence frequency of isolates of Pyricularia grisea on commercial rice cultivars.
Primavera
Aimoré IAC-201 IAC-47 Caiapó
Carisma Canastra
Confiança Bonança Progresso Maravilha
Carajás
Cultivars
TABLE 2 - Compatibility frequency of Pyricularia grisea isolates to the cultivars Primavera and Maravilha
aSix isolates from Primavera and 11 isolates from Maravilha were compatible to both cultivars. bNumber of isolates from Primavera utilized in inoculation tests. cNumber of isolates from Maravilha utilized in inoculation tests.
V
irulence (%)
Number of compatible isolates
a
Cultivar
Primavera (n=46)
b
Maravilha (n=31)
c
Primavera 44 11
Maravilha 6 28
0 10 20 30 40 50 60 70 80 90
100 Primavera
Maravilha
with widely prevalent isolates of P. grisea and by Prabhu & Filippi (2002) in Brazil. These were considered to be opportunistic infections caused by members of the resident pathogenic lineages present in the field and might have exhibited partial compatibility to the host cultivars (Correa-Victoria & Zeigler, 1993). Ou (1980) attributed to variation in virulence pattern of conidia produced in culture media.
The greater virulence of P. grisea isolates from the cv. Maravilha on twelve commercial upland rice cultivars as compared to the ones from cv. Primavera can possibly be attributed to the years of cultivation, different lineage origin and area planted. Earlier studies have indicated that an increase in a certain pathotype as well as highly adapted isolates of blast pathogen in farmers’ fields was closely correlated with the area planted with a particular rice cultivar (Kiyosawa & Shiyomi, 1976). The cultivar Maravilha was released two years earlier than cv. Primavera. In the past, the rapid breakdown of resistance of newly released cultivars has been over-attributed to pathotype diversity, instability in isolates, disease escape
in breeding nurseries (Ou, 1980; Zeigler et al., 1995), rather
than to an increase in frequency of preexisting pathotypes
with the release of a new rice cultivar. The extensive and intensive use of a resistance gene in a determined cultivar exerts selection pressure on preexisting population of P.
grisea, favoring the increase of certain pathotypes with corresponding virulence gene (Ahn, 2000).
Population structure analyses of P. grisea using molecular markers have contributed to the knowledge on evolutionary dynamics. Studies on genetic structure of P. grisea population using MGR-DNA fingerprinting showed that even though each isolate had a unique fingerprint, they could be grouped into distinct lineages The results of the analysis of isolates from Primavera and Maravilha using rep-PCR in the present study are in accordance with the observations made in earlier investigations (Levy et al., 1991; Correa-Victoria &
Zeigler, 1993; Levy et al., 1993; Xia et al., 1993; Chen
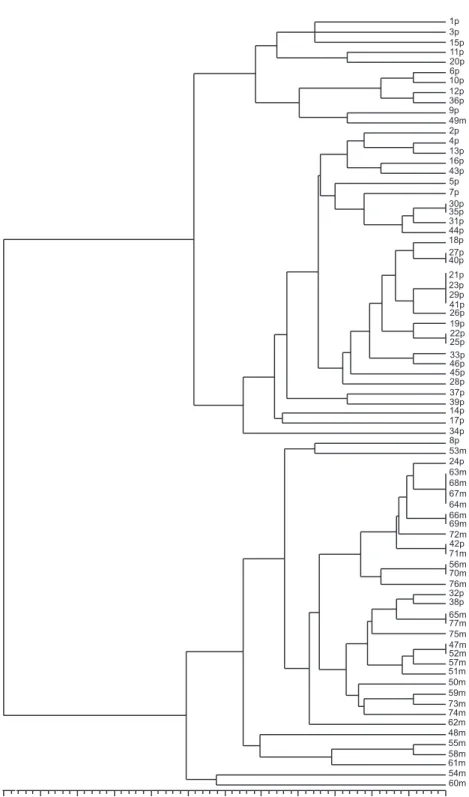
FIG. 2 - Phenogram of 77 Pyricularia grisea isolates from rice cultivars Primavera and
Maravilha, constructed using UPGMA based on Simple Match’s similarity coefficients; data from phenotypic virulence analysis; scale at the bottom represents coefficients of similarity. Co-phenetic coefficient of the dendogram was 0.91, p ≤ 0.002. The serial
numbers in the phenogram from 1 to 46 represent isolates from the cultivar Primavera and 47 to 77 the isolates from Maravilha.
0.58 0.61 0.65 0.68 0.72 0.75 0.79 0.82 0.86 0.89 0.93 0.96 1.00 1p 3p 15p 11p 20p 6p 10p 12p 36p 9p 49m 2p 4p 13p 16p 43p 5p 7p 30p 35p 31p 44p 18p
27p 40p
21p 23p 29p 41p 26p 19p 22p 25p
33p 46p 45p 28p 37p 39p 14p 17p 34p 8p 53m 24p 63m 68m 67m 64m 66m 69m 72m 42p 71m 56m 70m 76m 32p 38p
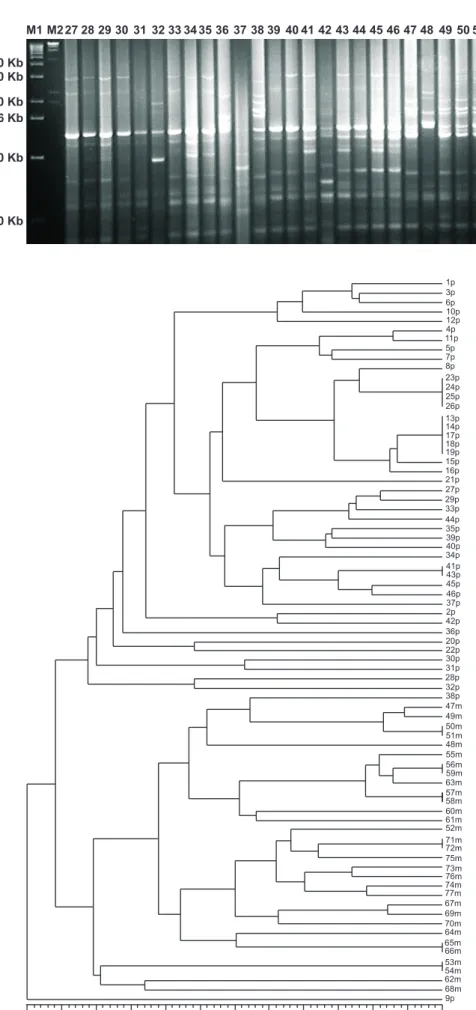
FIG. 3 Pot2 rep-PCR analysis
showing DNA fingerprinting profiles of Pyricularia grisea isolates from cultivars Primavera (#27 to 46) and Maravilha (#47-52). The DNA molecular size markers are on the lanes labeled M on the left M1 = Size marker
Lambda 1 kb, Gibco BRL; M2 = λ DNA/Hind III fragments. Isolates numbers correspond to the numbers indicated in the phenogram.
FIG. 4 - Phenogram of 77 Pyricularia grisea isolates from rice cultivars Primavera and Maravilha, constructed using UPGMA
based on Jaccard’s similarity coefficients;
data from Pot2 rep-PCR analysis; scale
at the bottom represents coefficients of similarity. Co-phenetic coefficient of the dendogram was 0.86, p ≤ 0.0004. The serial
numbers in the phenogram from 1 to 46 represent isolates from cv. Primavera and 47 to 77 the isolates from cv.Maravilha.
0.16 0.23 0.30 0.37 0.44 0.51 0.58 0.65 0.72 0.79 0.86 0.93 1.00 1p 3p
6p 10p 12p 4p 11p 5p 7p 8p
23p 24p 25p 26p
13p 14p 17p 18p 19p 15p 16p 21p 27p 29p 33p
44p 35p 39p 40p 34p
41p 43p 45p 46p 37p 2p 42p 36p 20p 22p 30p 31p 28p 32p 38p 47m 49m 50m
48m
56m 59m 63m
57m 58m 60m 61m 52m
71m 72m 75m 73m 76m 74m 77m 67m
69m 70m 64m
65m 66m
53m 54m 62m 68m 9p 51m
55m
M1 M2 27 28 29 30 31 32 33 34 35 36 37 38 39 40 41 42 43 44 45 46 47 48 49 50 51 52
4.0 Kb 3.0 Kb
2.0 Kb 1.6 Kb
1.0 Kb
Received 17 January 2006 - Accepted 28 December 2006 - FB 6002 cultivar-specific populations or lineages with a well
defined virulence pattern, because there was close correspondence between clusters based on rep-PCR and phenotypic virulence data based on 32 rice genotypes.
REFERENCES
AHN, S.W. Spatial and temporal stability of genetic resistance to rice blast. In: Tharreau, D., Lebrun, N.H., Talbot, N.J., & Notteghem, J.L. (Eds.) Advances in rice blast research. Dordrecht. Kluwer Academic Publishers. 2000. pp.162-171.
ATKINS, J.G., ROBERT, A.L., ADAAIR, C.R., GOTO, K., KOZAKA, T., YANAGIDA, R., YAMADA, M. & MATSUMOTO, S. An international set of rice varieties for differentiating races of Pyricularia oryzae. Phytopathology 57:297-301. 1967.
BONMAN, J.M., VERGEL, D.E., DIOS, T.I., BANDONG, J.M. & LEE, E.J. Pathogenic variability of monoconidial isolates of Pyricularia oryzae in Korea and in the Philippines. Plant Disease 71:127-130. 1987.
CHEN, D.H., ZEIGLER, R.S., LEUNG, H. & NELSON, R.J. Population structure of Pyricularia grisea at two screening sites in the Philippines, Phytopathology 85:1011-1020. 1995.
CLIFFORD, H. & STEPHENSON, W. An introduction to numerical
classification. London. Academic Press. 1975.
CORREA-VICTORIA, F.J. & ZEIGLER, R.S. Pathogenic variability in Pyricularia grisea at a rice blast “hot-spot” breeding site in Eastern Colombia. Plant Disease 77:1029-1035. 1993.
DON, L.D., KUSABA, M., URASHIMA, A.S., TOSA, Y., NAKAYASHIKI, H. & MQAYAMA, S. Population structure of the
rice blast fungus in Japan examined by DNA fingerprinting. Annals of
Phytopathological Society of Japan 65:15-24. 1999.
FELSENSTEIN, J. Confidence limits on phylogenies: An approach
using the bootstrap. Evolution 39:783-791. 1985.
FILIPPI, M.C. & PRABHU, A.S. Phenotypic virulence analysis of Pyricularia grisea isolates from Brazilian upland rice cultivars. Pesquisa Agropecuária Brasileira 36:27-35. 2001.
FILIPPI, M.C., PRABHU A.S. & LEVY, E.M. Differential compatibility of Pyricularia grisea isolates with some Brazilian irrigated rice cultivars. Fitopatologia Brasileira 24:447-450. 1999. FILIPPI, M.C., PRABHU, A.S., ARAÚJO, L.G. & FARIA, J.C.
Genetic and virulence pattern in field populations of Pyricularia grisea from rice cultivar Metica-1. Pesquisa Agropecuária Brasileira 37:1681-1688. 2002.
GEORGE, M.L.C., NELSON, R.J., ZEIGLER, R.S. & LEUNG, H. Rapid population analysis of Magnaporthe grisea by using rep-PCR and endogenous repetitive DNA sequence. Phytopathology 88:223-228. 1998.
HAMER, J.E. Molecular probes for rice blast disease. Science 252:632-633. 1991.
INTERNATIONAL RICE RESEARCH INSTITUTE. Standard evaluation system for rice. International rice testing program. 3rded.
Los Baños. 1988.
JAVAN-NIKKHAH, M., MCDONALD, B.A., BANKE, S. & HEDJAROUDE, G.A. Genetic structure of Iranian Pyricularia grisea
populations based on rep-PCR fingerprinting. European Journal of
Plant Pathology 110:909-919. 2004.
KACHROO, P., LEONG, A.S. & CHATOO, B.B. Pot2, an inverted repeat transposing from the rice blast fungus Magnaporthe grisea. Molecular Genetics 245:339-348. 1994.
KIYOSAWA, S. & SHIYOMI, M. Simulation of the process of breakdown of disease resistant varieties. Japan Journal of Breeding 26:339-352. 1976.
LEVY, M., CORREA-VICTORIA, F.J., ZEIGLER, R.S., XU, S. & HAMER, J. Genetic diversity of the rice blast fungus in a disease nursery in Colombia. Phytopathology 83:1427-1433. 1993.
LEVY, M., ROMÃO, J., MARCHETTI, M.A. & HAMER, J.E. DNA
fingerprinting with a dispersed repeated sequence resolves pathotype
diversity in the rice blast fungus. Plant Cell 3:95-102. 1991.
OU, S.H. Pathogenic variability and host resistance of the rice blast fungus, Pyricularia grisea Cavara. Annual Review of Phytopathology 18:167-187. 1980.
PARK, S.U., MILGROOM, M.G., HAN, S.S., KANG, S. & LEE Y.H.
Diversity of pathotypes and DNA fingerprint haplotypes in populations
of Magnaporthe grisea in Korea over two decades Phytopathology 93:1378-1385. 2003.
PRABHU, A.S., CASTRO, E.M., ARAÚJO, L.G. & BERNI, R.F. Resistance spectra of six elite breeding lines of upland rice to Pyricularia grisea. Pesquisa Agropecuária Brasileira 38:203-210. 2003.
PRABHU, A.S., FILIPPI, M.C., ARAÚJO, L.G. & FARIA, J.C. Genetic and phenotypic characterization of isolates of Pyricularia grisea from the rice cultivars Epagri 108 and 109 in the State of Tocantins. Fitopatologia Brasileira 27:566-573. 2002.
RAEDER, U. & BRODA, P. Rapid preparation of DNA from
filamentous fungi. Letters Applied Microbiology 1:17-20. 1985.
RATHOUR, R., SIGH, B.M., SHARMA, T.R. & CHAUHAN, R.S. Population structure of Magnaporthe grisea from North-western Himalayas and its implications for blast resistance breeding of rice Journal of Phytopathology 152:304-302. 2004.
ROHLF, F.J. NTSYSpc, version 2.02. Exeter Software, Applied Biostatistics Incorporated, 1997.
ROUMEN, J., LEVY, M. & NOTTEGHEM, J.L. Characterization of the European pathogen population of Magnaporthe grisea by DNA
fingerprinting and pathotype analysis. European Journal of Plant
Pathology 103:363-371. 1997.
SOKAL, R.R. & MICHENER, C.D. A statistical method for evaluating systematic relationships. University of Kansas Science Bulletin 38:1409-1 1438. 1958.
XIA, J.Q., CORRELL, J.C., LEE, F.N., MARCHETTI, M.A. &
RHOADS, D.D. DNA fingerprinting to examine micrographic
variation in the Magnaporthea grisea (Pyricularia grisea) population
in two rice fields in Arkansas. Phytopathology 83:1029-1035. 1993.