MOLECULAR AND PATHOGENIC VARIABILITY OF
Drechslera
ISOLATES FROM OATS
Y. R. MEHTA
Instituto Agronômico do Paraná-IAPAR, Cx. Postal 481, CEP 8600-970, Londrina, PR, e-mail: [email protected]
(Aceito para publicação em 17/04/2001)
MEHTA, Y. R. Molecular and pathogenic variability of Drechslera isolates from oats. Fitopatologia Brasileira 26:590-596. 2001.
ABSTRACT
Severe epidemics of leaf blotch and black leaf spot of oat (Avena sativa) caused by Drechslera avenae and Drechslera sp., respectively, are frequently observed in the
State of Paraná, Brazil. Although some morphological differences between the isolates causing two different symptoms were noticed, the genetic relationship between them was not clear. Twenty-four isolates of D. avenae and Drechslera sp, collected between 1996-98, were assessed for
the genetic variability by molecular and pathogenic analyses. The amplification products using primer pair ITS4/ITS5 showed a fragment length of approximately 600 bp for all the isolates except for one black spot isolate, where the fragment length was approximately 550 bp. Restriction
enzymes Hinf I and Taq I, that cut in the ITS region, produced
similar restriction patterns for all the isolates, whereas four others produced variable restriction patterns. RAPD analysis also showed distinctive patterns for some isolates. No clear difference between the black spot and the leaf blotch isolates was observed either by the molecular or by the pathogenicity analysis. Nonetheless, the rDNA analysis suggests that
Drechslera probably comprises at least three distinct taxa.
The results indicate that the difference observed between the isolates originating from two types of symptoms is due to intra-specific variants of D. avenae.
Key-words: Pyrenophora avenae, Avena sativa,
molecular characterization, varietal resistance.
RESUMO
Variabilidade molecular e patogênica de isolados de Drechslera de aveia
Epifitias severas de helmintosporiose e da mancha preta da aveia (Avena sativa) causadas por Drechslera avenae
e Drechslera sp., respectivamente, foram frequentemente
observadas no Estado do Paraná, Brazil. Embora algumas diferenças morfológicas entre os isolados causando os dois tipos de sintomas tenham sido verificadas, a relação genética entre eles não estava clara. Vinte e quatro isolados monospóricos de D. avenae e Drechslera sp. coletados durante
1996-98, foram analisados através de ensaios patogênicos e moleculares. Os produtos de amplificação utilizando par de primer ITS4/ITS5 demonstraram tamanho de fragmento aproximadamente de 600 pb para todos os isolados com excessão de um isolado da mancha preta onde o tamanho do
fragmento era aproximadamente de 550 pb. Enzimas de restrição Hinf I e Taq I, que cortaram na região de ITS,
produziram padrões de restrição similares, enquanto que outros quatro produziram padrão variável de restrição. A análise de RAPD também demonstrou padrões distintivos para alguns isolados. Diferença clara entre os isolados de mancha preta e helmintosporiose não foi encontrada tanto pelos ensaios patogênicos como também pelos ensaios moleculares. Entretanto, a análise de rDNA sugere que o Drechslera
provavelmente engloba pelo menos três taxas distintas. Os resultados demonstram que as diferenças entre os isolados originários de dois tipos de sintomas são devidos aos variantes intra-específicos de D. avenae.
INTRODUCTION
The use of oats (Avena sativa L.) in crop rotations is
of fundamental importance to the conservation tillage system. Oats are infected by a relatively small number of fungal diseases. The economically important oat diseases in the State of Paraná are leaf rust and especially the leaf blotch caused by Drechslera avenae (Eidam) Scharif. In recent years,
because of the rapid expansion of the crop, severe epidemics of leaf blotch and a black leaf spot caused by D. avenae and Drechslera sp., respectively, have frequently been observed
in the State of Paraná (Mehta, 1998a). Under field conditions symptoms of black spot and leaf blotch have been observed between 40-50 days after sowing.
Butler & Jones (1956) and Gair et al. (1978) described
two distinct phases of leaf blotch disease in oat. According to these authors, during the preliminary stage of the disease eliptical lesions are observed on the seedlings until the tillering stage, whereas during the secondary phase of the disease, small straw-colored lesions are formed on adult plants. Both of these disease phases were attributed to D. avenae. In Brazil,
typical leaf blotch symptoms are observed at the tillering-boot stage.
The black spot symptoms were characterized by elliptical to circular spots with a whitish center and a dark-brown to black border, 2-3 cm and rarely more than 5 cm in diameter. Sporulation is not observed in such lesions. The leaf blotch symptoms are characterized by straw-colored, elliptical lesions of varying sizes without any definite margin, and sometimes appearing as long stripes with abundant sporulation of conidia resembling D. avenae (Mehta, 1998a,1999). Mehta (1998) reported that
the conidia produced by the black spot isolates were slightly shorter than those produced by leaf blotch isolates, and that some of the leaf blotch isolates produced pycnidia on artificial media, whereas none of the black spot isolates produced any pycnidia (Mehta, 1999b). Although some morphological differences between the isolates causing two different symptoms were observed, the genetic relationship between them was not clear, and therefore work regarding breeding for resistance against these diseases was hampered.
Molecular analysis can be used to understand the genetic diversity of the pathogen population so that the germplasm of national importance is tested for resistance against all the potential pathotypes occurring accross the diverse oat growing areas of the State (Hamer, 1990; Williams
et al., 1990; Achenback et al., 1997; Machado et al., 1997;
Van Ginkel & Rajaram, 1998). The present study was carried out to assess the genetic variability among Drechslera
isolates in oats using PCR-RFLP analysis of the internal transcribed spacer (ITS4/ITS5) of ribosomal DNA (rDNA), random amplified polymorphic DNA (RAPD) analysis and pathogenicity tests.
MATERIALS AND METHODS
Pathogenic characterization: Three tests were carried out: 1) pathogenicity test of all the isolates on seedlings of susceptible cultivar IAC 7; 2) a general varietal screening test using D. avenae isolate number 14 (Table 1) against 18
oat cultivars; and 3) a specific test of virulence of 14 monosporic isolates selected at random (seven isolates from black spot symptoms and seven originated from leaf blotch symptoms) on 12 oat cultivars selected from the varietal screening test representing cultivars with a variable level of resistance to D. avenae.
Plant material
Seed material of 18 elite oat cultivars were obtained from the breeder´s germplasm collection. Oat seedlings were grown in 9-cm diameter pots or plastic trays (25 x 35 x 15 cm) containing an unsterilized soil/compost mixture in a glasshouse set at 20-24 oC and 12 h light/dark periods. In all tests, 20-day-old seedlings were inoculated.
For the varietal screening test, 18 cultivars were grown in plastic trays, each containing ten plants per cultivar. The
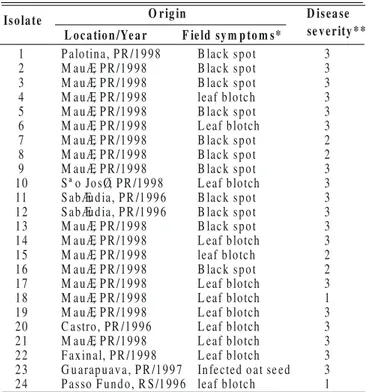
TABLE 1 - Drechslera spp. isolates used in the study
*Black spot symptoms are characterized as eliptical to circular spots with whitish center and dark-brown to black border, 2-3 cm in diameter, rarely >5 cm; leaf blotch symptoms are characterized as straw colored, eliptical lesions of varying sizes and without any definite margin, sometimes appearing as long stripes. **Inoculation was performed on susceptible cv. IAC 7. Disease severity was
assessed by visual observation of the % leaf area infected (LAI) (1= a few pin head size black spots<5% LAI; 2=eliptical lesions with or without chlorosis, LAI 6-25%; 3=eliptical lesions with chlorosis, LAI >26%). Isolates 1,2,3,9,12 & 16 produced black spot symptoms. Symptoms produced by other isolates were not distinctive.
Is o la te
1 B lack spot 3
2 B lack spot 3
3 B lack spot 3
4 M auÆ, P R /1998 leaf blotch 3
5 M auÆ, P R /1998 B lack spot 3
6 M auÆ, P R /1998 L eaf blotch 3
7 M auÆ, P R /1998 B lack spot 2
8 M auÆ, P R /1998 B lack spot 2
9 M auÆ, P R /1998 B lack spot 3
10 S ª o JosØ, P R /1998 L eaf blotch 3
11 S abÆudia, P R /1 996 B lack spot 3
12 S abÆudia, P R /1 996 B lack spot 3
13 M auÆ, P R /1998 B lack spot 3
14 M auÆ, P R /1998 L eaf blotch 3
15 M auÆ, P R /1998 leaf blotch 2
16 M auÆ, P R /1998 B lack spot 2
17 M auÆ, P R /1998 L eaf blotch 3
18 M auÆ, P R /1998 L eaf blotch 1
19 M auÆ, P R /1998 L eaf blotch 3
20 C astro, PR /1996 L eaf blotch 3
21 M auÆ, P R /1998 L eaf blotch 3
22 F axinal, P R /1998 L eaf blotch 3
23 G uarapuava, P R /1997 Infected oat se ed 3
24 P asso F undo, R S /1 996 leaf blotch 1
M auÆ, P R /1998 O r ig in
F ie ld sy m p to m s* L o c a tio n /Ye a r
D is ea se se v e r ity * * P alotina, P R /1998
M auÆ, P R /1998
18 cultivars were divided equally into two plastic trays, each containing ten plants per cultivar. The experiment was conducted in three replications in a completely randomized design. The data was analyzed using the Statistical Analysis System (SAS) (SAS Institute, 1985). Means were compared by the Tukey test.
For the virulence test, seedlings were grown in plastic trays, each containing one row of ten plants of each of the 12 cultivars in two replications. The trays were arranged in a randomized block design. Mean values were calculated and the data were submitted to analysis of variance using the computer program SANEST (Zonta & Machado, 1984). Differences between the isolates, genotypes and their interactions were analyzed. Means were compared by the Tukey test.
Fungal strains
Twenty four monosporic isolates of D. avenae and Drechslera sp. were obtained from the culture collection
Inoculum preparation and inoculation
Fungal colonies grown on three plates per isolate were used for inoculum preparation. Ten-day-old colonies were gently scraped on the potato dextrose agar (PDA) with 20 ml of sterile distilled water per plate. Inoculum contained mycelial fragments and conidia (approximately 9,000 conidia ml-1), to which a drop of Tween 20 was added. Seedlings were inoculated with a soft paint brush (Mehta, 1998b). The youngest fully expanded leaf of each plant was inoculated. Inoculated seedlings were incubated in a dew chamber for a period of 24 h at 21 oC and then transferred to the glasshouse. Uninoculated seedlings were maintained as controls. The disease symptoms produced on at least five inoculated leaves (one leaf per plant) per cultivar and per repetition, were evaluated eight days after inoculation. Assessment of disease intensity was made using a visual scale ranging from 0-99% of leaf area infected (LAI) (Mehta, 1998b).
Molecular analysis
For DNA extraction, all fungal cultures were grown in potato dextrose broth on a rotary shaker for four days, mycelia were filtered through Whatman No. 1 filter paper, washed twice with the TE buffer (10 mM Tris-HCl; 1 mM EDTA, pH 8.0) and total DNA was extracted as described by Raeder & Broda (1985). The amount of DNA was quantified by electrophoresis gels as well as by a DyNa Quant 200 Fluorometer (Pharmacia). The DNA samples were diluted in a 100 µl TE buffer, adjusted to 20 ng µl-1 and stored at –21 oC for further use. Samples that showed degradation of DNA in electrophoresis gels were discarded and DNA extraction was repeated. RNA was eliminated by adding 3 µl of RNAase (1.0mg/ml).
RAPD analysis
PCR reactions were performed in 25 µl volumes containing 10 mM Tris-HCl (pH 8.3), 50 mM KCl, 0.001% gelatin, 2 mM MgCl2, 200 µM of each dATP, dCTP, dGTP and dTTP, 5 picomoles of primer, 100 ng of genomic DNA, and 1 unit of Taq polymerase (Pharmacia, USA). Negative
controls without DNA were maintained in all experiments. Of the 28 decamer primers (Operon Technologies Inc., Alameda, CA) tested against four randomly selected D. avenae isolates, eight produced a reasonable good number of
bands, either polymorphic or monomorphic and hence were used for the present study. The primers used in this study were; OPA-03 (AGTCAGCCAC); OPH-19 (CTGACCAG CC); OPI-14 (TGACGGCGGT); OPJ-20 (AAGCGGCCTC); OPK-19 (CACAGGCGGA); OPX-04 (CCGCTACCGA); OPY-02 (CATCGCCGCA); and OPY-07 (AGAGCCGTCA). Amplification was performed in a thermal cycler (MJ Research, Inc. Watertown, MA, USA), according to the following program: 94 oC for 3 min followed by 40 cycles at 94 oC for 1 min, 40 oC for 1 min, 72 oC for 2 min, and a final extension at 72 oC for 5 min. Amplification products (25 µl) were electrophoresed in 1.4% agarose gels with TBE running buffer, stained with ethidium bromide and were scanned into
a computer imaging file using a Kodak EDAS 120 digital camera, supplied by Life Technologies. RAPD reactions were repeated once to confirm the banding pattern. Eight primers were used against all 24 fungal isolates, and the RAPD data were analyzed considering the presence or the absence of bands. A distance matrix was analyzed by the unweighted pair group method (UPGMA in the NTSYS-pc, version 1.8), using the Jaccard coefficient.
Amplification of the ITS regions
The rDNA (PCR-RFLP) analysis was performed through the amplification of ITS region. Sequences for the primers ITS4 and ITS5 regions were 5´-TCCTCCGCTTA TTGATATGC-3´ and 5´-GGAAGT AAAAGTCGTAAC AAGG-3´, respectively (White et al., 1990). Amplification
was performed in a thermal cycler (MJ Research, Inc. Watertown, MA, USA) using the following program: 94 oC for 3 min followed by 35 cycles of 94 oC for 1 min, 55 oC for 1 min, 72 oC for 2 min and a final extension at 72 oC for 5 min. Amplifications were performed in 50 µl volumes containing 10 mM Tris-HCl (pH 8.3), 50 mM KCl, 0.001% gelatin, 2 mM MgCl2, 200 µM of each dATP, dCTP, dGTP, dTTP, 25 pmol of each primer, 100 ng of genomic DNA, and 1 unit of Taq polymerase. Amplification products (5 µl
of a 50 µl reaction) were electrophoresed in 1.4% agarose gels with TBE running buffer, stained with ethidium bromide and photographed to verify fragment size. The amplified fragments were digested with six arbitrarily selected restriction enzymes (endonucleases) (Bgl II, EcoR I, Hind
III, Hinf I, Taq I, Xho I), in a 20 µl volume containing 1 µl of
the restriction enzyme. DNA digestion was performed following the manufacturer´s instructions and fragments were separated by electrophoresis in 2% agarose gels. All amplifications and digestions were repeated at least once to verify the reproducibility of the results.
RESULTS Pathogenicity tests
Black spot isolates Nos. 1, 3, 9, 12 and 16, produced typical black spot symptoms, whereas the symptoms produced by other isolates could not be clearly differentiated from each other (Table 1).
Varietal screening test
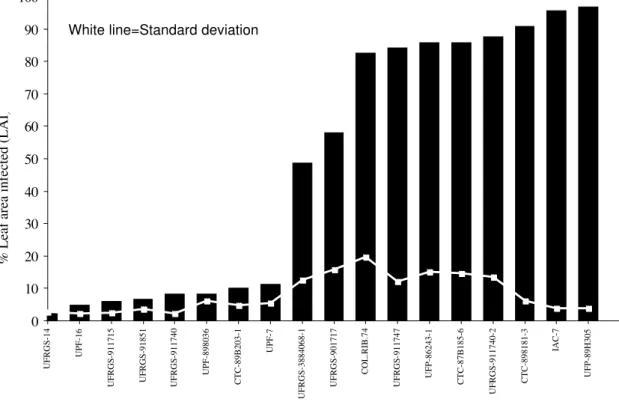
The first disease symptoms appeared four days after inoculation as small elliptical to circular spots, and well developed elliptical lesions were developed eight days after inoculation. None of the oat cultivars were completely resistant to the D. avenae isolate (number 14). The standard deviation
considered susceptible. Based on these results, a preliminary set of cultivars for virulence studies was created representing 12 cultivars with variable levels of resistance to D. avenae.
Virulence tests
Analysis of variance data showed significant differences between the oat genotypes, isolates and their interactions for disease severity. The mean square for genotypes was higher (14797.58) than that for isolates (6229.49). The mean square for the genotype x isolate interaction was very low (553.35). This indicates that there was more variation between genotypes than between the isolates of the pathogen. Cultivars CTC-898181-3, IAC-7 and UF-894-305, had differential reaction to some of the isolates but a similar susceptible reaction to most of the isolates. Leaf blotch isolate number 4, induced a highly susceptible reaction in all 14 genotypes (Table 2). Similarly, the moderately resistant cultivars UFRGS-91851, UF-898036, UPF-16 and UFRGS-14 showed a similar reaction for all the isolates. Although a few differences in disease severity in the virulence test were observed between isolates on cultivars UFRGS-901717, UFRGS-91851 and UFRGS-3884068-1, no grouping of the isolates could be clearly identified.
PCR-RFLP analysis
Variation was found in the organization of the internal transcribed spacer region of ribosomal DNA of some isolates
of Drechslera. The amplification products using primer pair
ITS4/ITS5 showed a fragment length of approximately 600 bp for all the isolates but for one black spot isolate number 7, where the fragment length was approximately 550 bp. The amplified fragments were digested with six restriction enzymes. Restriction enzymes Hinf I and Taq I, that cut the
ITS region, produced similar restriction patterns for all the isolates, whereas others produced variable restriction patterns. The restriction enzymes Bgl II, Hind III and Xho I, for
example, did not digest the fragments of one black spot isolate (number 7), whereas Xho I also did not digest the fragments
of one leaf blotch isolate (number 24) originated from Passo Fundo. One black spot and one leaf blotch isolate (numbers 6, 12), had distinct EcoR I sites that were absent from other
isolates. Isolates numbers 6 and 12 were closely related to each other but were distinct from the rest of the isolates (Figures 2-A, B, Table 3).
RAPD analysis
The eight primers used to amplify the DNA of 24
Drechslera isolates yielded 97 RAPD bands, most of which
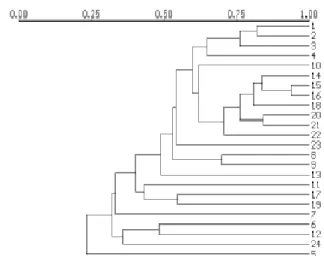
were polimorphic (89). A lot of variation was found in the RAPD banding patterns. Like rDNA analysis, the RAPD analysis also showed distinctive patterns for isolates numbers 6, 7, 12 and 24. Although no clear cut separation of the isolates into distinct groups was possible, most of the black spot isolates showed lower similarity with the leaf blotch isolates at the 0.5 similarity coefficient (Figure 3).
0 10 20 30 40 50 60 70 80 90 100
UFRGS-14
UPF-16
UFRGS-911715 UFRGS-91851 UFRGS-911740
UPF-898036
CTC-89B203-1
UPF-7
UFRGS-3884068-1
UFRGS-901717
COL.RIB.74
UFRGS-911747 UFP-86243-1 CTC-87B185-6
UFRGS-911740-2
CTC-898181-3
IAC-7
UFP-89H305
% Leaf area infected (LAI
)
White line=Standard deviation
FIG. 1 - Reaction of 18 oat (Avena sativa) cultivars to Drechslera avenae eight days after inoculation with isolate number 14.
DISCUSSION
The varietal screening test was performed mainly to determine a preliminary set of differential cultivars. Results showed that none of the oat cultivars were completely resistant to Drechslera spp. Further work is necessary to screen several
oat cultivars and identify those with contrasting highly resistant and highly susceptible reactions. However, the cvs. UFRGS-91851, UPF-898036, UPF-16 and UFGS-14 moderately resistant to D. avenae, as identified in the present
study, are some of the most desirable cultivars agronomically and industrially, and can be used for commercial cultivation as well as for breeding purposes. In the field trials conducted by Sousa (1998), the last two cultivars also showed the best performance against P. coronata and D. avenae.
The virulence test gave no clear evidence for the existence of different species or pathotypes among the
Drechslera spp. or D. avenae isolates. With some exceptions,
a clear difference between the black spot and the leaf blotch isolates was not observed. Detailed virulence studies conducted using a well defined set of differential oat cultivars are required to conclusively demonstrate the existence or non-existance of different pathotypes of the pathogen.
A range of variation was observed in the banding patterns of RAPD. Although most of the black spot isolates were included in a separate group at the 0.5 similarity coefficient, a clear cut distinction between the Drechslera
isolates originated from black spot and leaf blotch symptoms was not evident. Similarly, rDNA analysis did not separate the black spot isolates from the leaf blotch isolates, although it suggested the existence of at least three distinct groups in the genus Drechslera. Based on the rDNA analysis (Table 3,
Figure 2-A, B), the three groups may be separated as follows;
2 3 4 5 6 7 8 9 10 11 12
aMeans followed by the same lettter in a column are not significantly different (p < 0.01;Tukey 1%). For isolates see Table 1. The genotypes were: 1=UFRGS-91851;
2=CTC-898181-3; 3=UPF-898036; 4=UPF-16; 5=IAC-5; 6=UFRGS-901717; 7=UFRGS-911715; 8=UFRGS-911740-2;9=UFRGS-14; 10=UFRGS-3884068-1; 11=UFRGS-911740; 12=UPF-89H305.
1
1 0.0 b 14.5 b 0.0 b 0.0 b 66.0 abc 0.9 b 0.0 b 0.8 d 0.0 a 0.1 d 0.0 b 12.0 e 8.0 e
2 0.0 b 22.5 bcd 0.0 b 0.0 b 90.0 a 3.0 b 0.0 b 2.5 d 0.9 a 2.0 d 0.0 b 40.5 bcd e 13.5 de
3 0.0 b 30.5 bcd 0.0 b 0.2 b 87.0 a 10.0 b 0.0 b 31.5 cd 0.0 a 13.0 cd 0.3.b 65.0 abcd 19.8 cde
4 76.0 a 39.0 bcd 50.5 a 66.5 a 87.5 a 80.0 a 86.5 a 87.5 ab 20.0 a 72.0 ab 87.5 a 65.0 abcd 68.2 a
5 0.0 b 20.5 cd 0.0 b 0.0 b 69.0 abc 1.5 b 0.0 b 6.5 c 0.0 a 12.0 cd 7.5 b 48.0 abcde 13.8 de
6 2.0 b 52.5 abcd 0.0 b 0.5 b 69.5 abc 0.6 b 1.0 b 69.0 abc 0.0 a 56.5 abc 4.0 b 90.0 a 28.8 bc
7 0.8 b 49.0 abcd 0.0 b 0.0 b 70.0 abc 2.0 b 0.0 b 42.5 bcd 0.0 a 7.0 d 0.0 b 23.5 de 16.2 de
8 0.0 b 34.0 bcd 0.3 b 0.1 b 36.0 bc 0.9 b 0.0 b 12.0 d 0.0 a 0.1 d 0.0 b 17.5 de 8.4 e
9 7.0 b 31.1 d 0.6 b 3.1 b 29.0 c 2.0 b 4.0 b 5.5 d 0.5 a 5.1 d 4.1 b 27.0 cde 7.6 e
10 10.0 b 65.0 abc 0.0 b 0.0 b 82.5 ab 9.0 b 0.0 b 18.0 d 0.0 a 24.5 bcd 0.0 b 74.0 abc 23.6 cd
11 0.5 b 41.0 bcd 0.1 b 1.5 b 84.0 ab 1.0 b 1.0 b 68.5 abc 0.0 a 1.3 d 1.5 b 29.0 cde 19.1 cde
12 6.5 b 67.5 abc 0.0 b 0.5 b 77.0 abc 4.5 b 0.5 b 87.5 ab 0.0 a 41.0 abcd 0.5 b 62.5 abcd 29.0 bc
13 0.5 b 70.0 ab 0.0 b 0.0 b 77.5 abc 10.0 b 1.0 b 94.5 a 0.0 a 42.6 abcd 1.5 b 81.0 ab 31.6 bc
14 15.0 b 94.5 a 0.3 b 0.5 b 77.0 abc 31.5 ab 19.0 b 70.0 abc 3.0 a 87.5 a 9.0 b 63.5 abcd 39.2 b
M ean 8.4 d 43.1 b 3.7 d 5.2 d 71.6 a 11.2 d 8.1 d 42.6 b 1.7 d 26.0 c 8.3 d 49.9 b
Isolate Genotype
a
Mean
TABLE 2 -Mean percentage of leaf area infected (0-99%) on leaves of 12 oat (Avena sativa) genotypes eight days after inoculation with14 isolates of Drechslera spp.
group 1 = isolate number 7; group 2 = isolate number 24; and group 3 = the rest of the isolates. The sums of the approximate restriction band sizes for some isolates were a little smaller or a little larger than the uncut ones (Table 3). Such differences were attributed by Pimentel et al. (1998) to
difficulties in visualizing bands smaller than 50 bp, or errors in determining band sizes in agarose gels. The results indicate that the differences observed between the two types of isolates are due to the intra-specific variants of D. avenae. One of the
reasons for these variants might be the sexual hybridization occurring within the pathogen populations. Although the perfect state of D. avenae has not yet been observed in the
northern part of the State of Paraná, it is likely that it exists in the southern part of the State, which is agro-climatically similar to the State of Rio Grande do Sul, where the perfect state is known to occur in abundance (Reis et al, 1999). In
the absence of the sexual stage, different variants of the pathogen may have been transmitted through seed from one State to another.
In general, RAPD analysis is useful in detecting inter and intra-specific variation in plant pathogenic fungi, whereas PCR-RFLP analysis of rDNA regions (ITS and IGS) is not always efficient in distinguishing plant pathogenic fungi (Assigbetse et al., 1994; Achenback et al., 1997; Onfroy et al., 1999; Mehta, 1999). RAPD analyzes the entire genome
of the fungus, whereas PCR-RFLP analyzes a specific region of the genome. The rDNA region, for example, is stable within the species and highly variable between the species. However, Mehta (1999), found a clear distinction between Alternaria macrospora (Zimm.) and Stemphylium solani (Weber), both
causing leaf blights of tomato (Lycopersicon esculentum Mill.)
and cotton (Gossypium hirsutum L.) in Brazil, by RAPD
obtained by Farias-Mokaiesh et al., (1996), for some
pathogens attacking peas (Pisum sativum L.) in France. Such
negative results are not very common for inter-specific variation of rDNA. In the present study, however, rDNA analysis detected the presence of three distinct groups in
Drechslera isolates from oat. RAPD analysis also showed
distinct patterns for such isolates. In general, RAPD analysis has a stronger diagnostic potential, especially for the asexually reproducing fungal pathogens. Nonetheless, this suggests that at least more than one molecular method should be employed to understand the inter and intra-specific diversity among plant pathogenic fungi. Sequencing of the rDNA, for example, may further clarify the degree of dissimilarity and the phylogenetic relationship between the three groups of
Drechslera identified in the present study (Kusaba and Tsuge,
1995). Knowledge generated from such studies may be useful in breeding strategies aimed at creating resistant cultivars against leaf blotch/black leaf spot of oat in Brazil.
ACKNOWLEDGEMENTS
Thanks are due to E.M. Reis and Martha Blum for some fungal strains from Passo Fundo and Guarapuava. Thanks are also due to J.E. Perreira and N.S. Fonseca, for their help in statistical analysis. T.K.K. Tame, J.A. Oliveira, A. Souza, A. J. Souza and E.H. Ota, provided technical assistance.
LITERATURE CITED
ACHENBACK, L.A., PATRICK, J.A. & GRAY, L.E. Genetic homogeneity among isolates of Fusarium solani that
cause soybean sudden death syndrome. Theoretical and Applied Genetics 95:474-478. 1997.
ASSIGBETSE, K.B., FERNANDEZ, D., DABOIS, M.P. & GEIGER, J.P. Differentiation of Fusarium oxysporum f.
sp. vasinfectum races on cotton by random amplified
polimorphic DNA (RAPD) analysis. Phytopathology E n zy m e
6 7 12 13 24 O thers
B g l II N ot cut N ot cut N ot cut N ot cut N ot cut N ot cut
E co R1 30 0 28 0 30 0 30 0 30 0 30 0
35 0 35 0 35 0
H in d III 38 0 N ot cut 40 0 40 0 40 0 40 0
22 0 20 0 20 0 20 0 20 0
H in f I 42 0 40 0 40 0 42 0 40 0 40 0
22 0 20 0 20 0 22 0 20 0 20 0
Ta q I 40 0 40 0 40 0 40 0 40 0 40 0
20 0 20 0 20 0 20 0 20 0 20 0
X h o I 50 0 N ot cut 50 0 50 0 N ot cut 50 0
10 0 10 0 10 0 (6 20 bp) 10 0
D r ec h s le ra spp . iso la tes*
TABLE 3 - Approximate restriction fragment sizes (bp) for the Drechslera spp. isolates used in the present study
M 7 1 6 17 22 2 4 2 3
800 b p 600 b p
-M 1 2 3 4 5 6 7 8 9 10 11 12 1 3
8 0 0 b p 6 0 0 b p 4 0 0 b p
-FIG. 2 - A- PCR-RFLP patterns from the ITS region in some isolates of Drechslera spp. amplified with primer pair ITS4/ITS5 and digested with B-Bgl II; B- Sample gel of RAPD profile of genomic DNA of 13 isolates of Drechslera, obtained with the primer OPY-2. Lane M shows the molecular weight marker (100 bp DNA ladder). For isolates see Table 1.
*For isolates see Table 1. FIG. 3 - Dendrogram produced by UPGMA clusteranalysis based on RAPD markers from eight
84:622-626. 1994.
BUTLER, E.J. & JONES, S.G. Plant Pathology. MacMillan & Co. Ltd., New York-London. 1956..
FARIAS-MOKAIESH, S., BOCCARA, M., DENIS, J.B., DERRIEN, A. & SPIRE, D. Differenciation of the ‘Ascochyta complex’ fungi of pea by biochemical and molecular markers. Current Genetics 29:182-190. 1996. GAIR, R., JENKINS, J.E.E. & LESTER, E. Cereal pests and
diseases. Farming Press Ltd., U.K. 1978.
HAMER, J.E. Molecular probes for rice blast disease. Science 252:632-633. 1990.
KUSABA, M. & TSUGE, T. Phylogeny of Alternaria fungi
known to produce host-specific toxins on the basis of variation in internal transcribed spacers of ribosomal DNA. Current Genetics 28:491-498. 1995.
MACHADO, A. M., BARROS, E.G., VASCONCELOS, M.J.V., GOMES, J.L.L. & MOREIRA, M.A. RAPD analysis for the characterization of Cercospora sojina
isolates. Fitopatologia brasileira 22:366-369. 1997. MEHTA, Y.R. Manchas foliares da aveia branca causadas
por Drechslera spp. Resumos, XVIII Reunião da
Comissão brasileira de pesquisa de aveia, Londrina, 14 a 16 de abril de 1998. IAPAR, 1998a. pp.31-38. MEHTA, Y.R. Severe outbreak of Stemphylium leaf blight, a
new disease of cotton in Brazil. Plant Disease 82:333-336. 1998b.
MEHTA, Y.R. Drechslera spp. atacando aveia branca no
Estado do Paraná. Summa Phytopathologica 25:265-267. 1999a.
MEHTA, Y.R. Variação genética entre as populações e patótipos de Stemphylium solani. In: Resumos, II
Congresso Brasileiro de Algodão, EMBRAPA, 1999b, pp 464-467.
ONFROY, C., TIVOLI, B., CORBIÉRE, B. & BOUZNAD, Z. Cultural, molecular and pathogenic variability of
Mycosphaerella pinodes and Phoma medicagenis var. pinodella isolates from dried pea (Pisum sativum) in
France. Plant Pathology 48:218-229. 1999.
PIMENTEL, G. & CARRIS, L.M. Genetic variability among isolates of Tilletia barclayana, T. indica and allied
species. Mycologia 90:1017-1027. 1998.
RAEDER, U.& BRODA, P. Rapid preparation of DNA from filamentous fungi. Letters in Applied Microbiology 1:17-20. 1985.
REIS E.M., BLUM, M.M.C. & CASA, R.T. Doenças da aveia: helmintosporiose. Centralgraph Gráfica, Editora e Fotolito Ltda. São Paulo. 1999.
SOUSA, P.G. Avaliação de cultivares de aveia branca (Avena sativa) na região sul de Mato Grosso do Sul, safras 1997
e 1998. Comunicado técnico, EMBRAPA, CPAO, No. 43. 1998.
VAN GINKEL, M. & RAJARAM, S. Breeding for resistance to spot blotch in Wheat: Global perspectives. In: Duveiller, Van Ginkel & Rajaram, S. (Eds.). Helminthosporium blights of wheat:Spot blotch and tan spot. México, D.F. CIMMYT. 1998. pp 162-170.
WHITE, T.J., BRUNS, T., LEE, S. & TAYLER, J. Amplification and direct sequencing of fungal ribosomal RNA genes for polygenetics. In: Innis, M.A., Gelfand, D.H., Sninsky, J.J. & White, T.J.(Eds.). PCR protocols: A guide to methods and applications. Academic Press, San Diego, CA. 1990. pp 315-322.
WILLIAMS, J.G.K., KUBELIK, A R., LIVAK, K.J.; RAFALSKI, J.A.A. & TINGEY, S.V. DNA polimorphism amplified by arbitrary primers are useful as genetic markers. Nucleic Acids Research 18:6531-6535. 1990.
ZONTA, E.P. & MACHADO, A.A. SANEST-Sistema de Analise Estatistica. Universidade Federal de Rio Grande do Sul, Mimiografado. 1984.