Growth dynamics and yield of melon as influenced by
nitrogen fertilizer
María Teresa Castellanos
1; María Jesús Cabello
1; María del Carmen Cartagena
2; Ana María
Tarquis
2; Augusto Arce
2; Francisco Ribas
1*
1
Centro Agrario El Chaparrillo/Delegación Provincial Agricultura y Desarrollo Rural, C/Alarcos, 21 – 13071 – Ciudad Real, Spain.
2
Universidad Politécnica/Escuela Técnica Superior de Ingenieros Agrónomos, Ciudad Universitaria, s/n – 28040 – Madrid, Spain.
*Corresponding author <fribas@jccm.es>
ABSTRACT: Nitrogen (N) is an important nutrient for melon (Cucumis melo L.) production. However there is scanty information about the amount necessary to maintain an appropriate balance between growth and yield. Melon vegetative organs must develop sufficiently to intercept light and accumulate water and nutrients but it is also important to obtain a large reproductive-vegetative dry weight ratio to maximize the fruit yield. We evaluated the influence of different N amounts on the growth, production of dry matter and fruit yield of a melon ‘Piel de sapo’ type. A three-year field experiment was carried out from May to September. Melons were subjected to an irrigation depth of 100% crop evapotranspiration and to 11 N fertilization rates, ranging 11 to 393 kg ha–1 in the three years. The dry matter production of leaves and stems increased as the N amount increased. The dry matter of the whole plant was affected similarly, while the fruit dry matter decreased as the N amount was increased above 112, 93 and 95 kg ha–1, in 2005, 2006 and 2007, respectively.
The maximum Leaf Area Index (LAI), 3.1, was obtained at 393 kg ha–1 of N. The lowest N supply reduced the fruit yield by 21%, while the highest increased the vegetative growth, LAI and Leaf Area Duration (LAD), but reduced yield by 24% relative to the N93 treatment. Excessive applications of N increase vegetative growth at the expense of reproductive growth. For this melon type, rates about 90-100 kg ha–1 of N are sufficient for adequate plant growth, development and maximum production. To obtain fruit yield close to the maximum, the leaf N concentration at the end of the crop cycle should be higher than 19.5 g kg–1.
Key words: LAI, LAD, dry matter accumulation, production functions, leaf nitrogen concentration
Dinâmica do crescimento e da produtividade do melão em
resposta ao fertilizante nitrogenado
RESUMO: O nitrogênio (N) é um nutriente importante para a produção de melão (Cucumis melo L.), porém existe pouca informação sobre a quantidade necessária para se obter um balanço entre o crescimento e a produtividade. Os órgãos vegetativos do melão precisam se desenvolver suficientemente para interceptor luz, acumular água e nutrients, mas também é importante alcançar uma grande relação de massa seca produtiva-vegetativa para maximizar a produção de frutos. Investigou-se a influência de quantidades de N no crescimento, na produção de matéria seca e na produtividade do melão tipo ‘Pele de sapo’. Foi conduzido experimento com três anos de duração, de maio a setembro, com irrigações de 100% da evapotranspiração e 11 doses de adubação de N, no intervalo de 11 a 393 kg ha–1 em três anos. A produção de massa seca de folhas e caules aumentou com o aumento das doses de N. A matéria seca da planta toda foi afetada de maneira semelhante, enquanto a dos frutos decresceu com o aumento de N acima de 112, 93 e 95 kg ha–1, em 2005, 2006 e 2007, respectivamente. O índice de área foliar máxima (LAI) mais aulto (3.1) foi obtido com a dose de 393 kg N ha–1 de N. A dose mais baixa de N reduziu a produtividade de frutos em
21%, enquanto a dose mais alta aumentou o crescimento vegetative, LAI e a duração de área foliar (LAD), mas reduziu a produtividade em 24% em relação ao tratamento N93. Aplicações excessivas de N aumentam o crescimento vegetativo às expensas do crescimento vegetativo. Para este tipo de melão, doses da ordem de 90-100 kg ha–1 de N são suficientes para crescimento adequado e produção máxima. Para obter produções próximas ao máximo, a concentração de N na folha no final do ciclo da cultura não deve ser maior que 19.5 g kg–1.
Palavras chave: LAI, LAD, acúmulo de material seca, funções de produção, concentração de nitrogênio na folha
Introduction
Melon (Cucumis melo L.) is an important horticul-tural crop in the world with an overall annual produc-tion of 26.8 million tonnes and a planted area of about 1.3 million ha (FAO, 2007). The yield of melon is
assimi-lates, which will go mainly to fruits during their growth and development (Hubbard et al., 1990; Bartolo and Schweissing, 1998), and N is a dominant nutrient in growth, productivity and longevity (Huett, 1996).
Melon crop production in dry climates is particularly sensitive to deficiencies in soil moisture and N (Panagiotopoulos, 2001; Silva et al., 2007; Cabello et al., 2009). The uptake of N and its accumulation in the parts of melon plants over the growing season have been studied by researchers for some cultivar groups of melon such as Reticulatus (Purqueiro et al., 2003; Kirnak et al., 2005), Cantalupensis (Pérez- Zamora and Cigales-Rivero, 2001; Fagan et al., 2006), and the results are different and some-times contradictory. In most cases, these researchers show experiments located in greenhouses and in greenhouse hy-droponics (Fukutokuet al., 2000; Fogaça et al., 2008). These authors give information about the dynamics of N uptake but, in most cases, the optimum application rates were not determined. Therefore, new approaches are neces-sary to optimize the N fertilization of this important type of melon: ‘Piel de Sapo’ (inodorus group) grown under field conditions and with plastic mulch. Its growth dynamics is different from types of melon already stud-ied and also, the N optimization in relation to growth and yield. In fact, large amounts of N are used by grow-ers (sometimes higher than 250 kg ha–1
) contributing to the increase of the contamination of groundwater by ni-trates (Castellanos et al., 2010).
We evaluated the effect of different rates of N fertil-izer on the growth and production of dry matter, and the effects of rates of N fertilizer and leaf N concentra-tion on fruit yield in order to determine the optimum N amount and leaf N concentration of a melon ‘Piel de sapo’ type crop.
Material and Methods
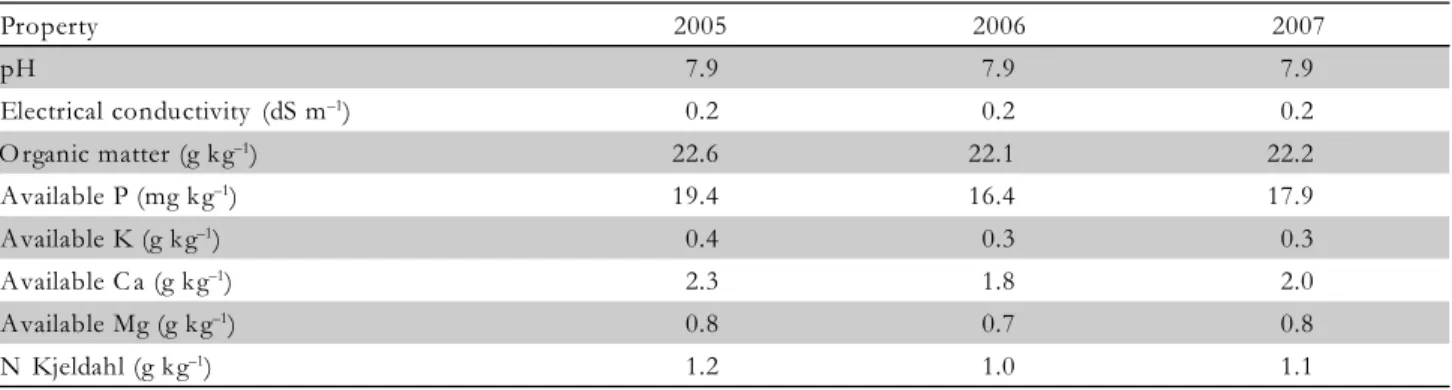
The experiment was carried out in Ciudad Real, Spain (3º56’ W, 39º0’ N, 640 m a.s.l.), in 2005, 2006 and 2007. The soil is a shallow sandy-loam, Alfisol Xeralf Petrocalcic Palexeralfs (Soil Survey Staff, 1999), with a depth of 0.6 m and a discontinuous petrocalcic horizon between 0.6 and 0.7 m. Soil physicochemical properties were measured for the 0-0.4 m soil layer prior to the ex-periment (Table 1).
Organic matter was determined using the method de-scribed by Hesse (1971), phosphorus by Olsen’s method (Olsen et al., 1954), potassium by flame photometry (Pratt, 1965), calcium and magnesium by absorption spectropho-tometry (MAPA, 1994) and Kjeldahl-N by the method de-scribed by Bremer (1996). For the previous three years, the plots had been cultivated with wheat crops that did not receive organic amendments or fertilizer. Figure 1 presents the average air temperature for ten-day periods over the crop season in the three years.
The experimental design was a randomized com-plete block with four N treatments and four replica-tions, except in 2006 - when there were three treatments. The treatments consisted of N rates: 30 (N30), 85 (N85), 112 (N112), and 139 (N139) kg ha–1 in 2005. In 2006, water without nitrates was not available and the minimum N applied was 93 kg ha–1
, which was the N amount in the irrigation water. Moreover, the negative effect of exces-sive N was not clearly observed in the previous year and therefore, it was decided to apply 93 (N93), 243 (N243), and 393 (N393) kg ha–1
. In 2007, the N rates were 11 (N11), 61 (N61), 95 (N95), and 148 (N148) kg ha–1. In the three years, the total amount of N applied in each treatment was the sum of the N fertilizer and water N amounts.
“Sancho”, a hybrid cultivar of muskmelon ‘Piel de sapo’ type, was planted on 26 May 2005, 24 May 2006 and 28 May 2007, with transparent plastic mulch. The size of each elemental plot was 126 m2 and included seven planting rows 1.5 m apart with eight plants per row, with
Table 1 – The physicochemical properties of the soil at the field experimental sites in 2005, 2006, and 2007.
Property 2005 2006 2007
pH 7.9 7.9 7.9
Electrical conductivity (dS m–1) 0.2 0.2 0.2
O rganic matter (g kg–1) 22.6 22.1 22.2
Available P (mg kg–1) 19.4 16.4 17.9
Available K (g k g–1) 0.4 0.3 0.3
Available C a (g kg–1) 2.3 1.8 2.0
Available Mg (g k g–1) 0.8 0.7 0.8
N Kjeldahl (g kg–1) 1.2 1.0 1.1
10 12 14 16 18 20 22 24 26 28 30
Te
m
per
at
u
re (
ºC
)
Date
2005 2006 2007
a distance of 1.5 m between plants. The irrigation sys-tem, which was similar to that used by farmers in the area, consisted of one drip line per crop row and emit-ters of 2 L h–1, 0.5 m apart. The total irrigation applied was 574 mm in the first year, 522 mm in the second and 458 mm in the third. These amounts were equal to 100% ETc, which was calculated by the FAO method (Doorenbos and Pruitt, 1977). Effective rainfall during the growth period was negligible. Irrigation water was analysed weekly in order to determine the total N con-tent. The N fertilizer was applied daily by fertigation: from 13 June to 19 August, from 9 June to 24 August and from 22 June to 29 August in 2005, 2006 and 2007, respectively.
All treatments received the same total amount of phosphorus fertilizer (120 kg ha–1) for the season, which was injected daily through the drip irrigation system, from three weeks after transplanting until the last week of August in all three years. The N and P were applied as ammonium nitrate and phosphoric acid, respectively. Potassium was not applied due to the high content of this element in the soil (0.3-0.4 g kg–1
). Phytosanitary treat-ments were applied in order to prevent and control crop pests and diseases.
During the growing season, at 15, 34, 53, 70 and 91 days after transplanting (DAT) in 2005, at 20, 41, 62 and 83 DAT in 2006 and at 22, 36, 50, 64, 78 and 92 DAT in 2007, four plants of each treatment were sampled at random from the rows of each plot. Selected plants were always sur-rounded by border plants. Leaves (blades and petioles), stems and fruits (when present) were separated and weighed to obtain fresh weight and the total leaf area was measured with a leaf area meter (LI-3100C, LI-COR, Lincoln, NE). The dry weights of leaves, stems and fruits were determined after drying at 80ºC for 48 h, to con-stant weight.
The leaf area index was calculated by dividing the total leaf area by the ground area available for one plant (2.25 m2). From the LAI values over the crop cycle, the leaf area duration across the harvest interval (t–1 to t) was calculated using the equation:
t t-1 t t -1
(LAI + LAI ) x n LAD = LAD +
2
where: LADt is LAD calculated at the time of harvest (t), LADt–1 is LAD calculated at the time of the previous harvest (t-1), LAIt is LAI calculated at the time of har-vest (t), LAIt–1 is LAI calculated at the time of the previ-ous harvest (t-1), n is the period of time (days) between two successive harvests [(t-1) – t].
At the end of the cycle, sub-samples of the leaf dry matter were finely ground and the total N concentra-tion was measured by the Kjeldahl method (AOAC, 1990).
The harvests were carried out weekly and started at 67, 63 and 66 DAT in 2005, 2006 and 2007, respectively, when fruits were fully mature. At each harvest, melon fruits were weighed individually and the total yield per
hectare was calculated. For each harvest, four represen-tative marketable fruits from each replication were analysed for fruit quality parameters. Flesh firmness was measured at four zones of the cut equatorial surface us-ing a Penefel (Agro-Technologie, Tarascon, France), with an 8 mm diameter tip measuring the force necessary to penetrate into the flesh. Flesh ratio (FR) was calculated using the formula: 2 × flesh thickness × width–1. From the liquid extract obtained by liquefying the mesocarp of each fruit, the total soluble solids (TSS) content was de-termined by a handheld Atago refractometer. N produc-tion funcproduc-tions were obtained by relating the relative yield (yield/maximum yield) to the total N applied and the leaf N concentration.
Data (dry weight, LAI, LAD, fruit yield and quality parameters) were analyzed separately for each year by ANOVA. Significant statistical differences of variables between the different treatments were established by the Tukey test (p < 0.05). Taking into account the data of three years, linear and quadratic regressions were per-formed between relative yield and both N applied and leaf N concentration and between yield and LAD. All statistical analyses were carried out with the program SPSS 12.0 for windows.
Results and Discussion
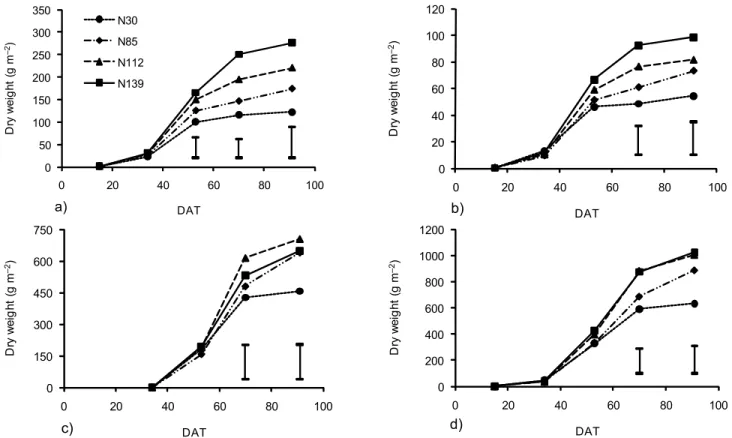
In 2005, the amount of N applied had a clear effect on the dry matter accumulation in the leaves, stem and fruit, and, therefore, in the total aerial plant (Figure 2). Leaf dry matter of N139 treatment increased (p < 0.05), by 66%, by N compared with the N30, at 53 DAT, coin-ciding with the first setting of fruits, and these differences increased as the crop developed (Figure 2a). The biom-ass accumulation in the stem, fruit and whole plant fol-lowed the same tendency, although the highest differ-ences were obtained at the end of the cycle (Figure 2b, c and d). In 2005 two growth patterns were observed. On the one hand, the dry biomass of the stem and leaves increased continuously as the N amount rose; on the other hand, the fruit biomass increased up to the N8 5 treatment, but higher N application had no influence.
At the end of the growing season, the N85, N112 and N139 treatments had increased the total aerial dry mat-ter, relative to the N30 treatment, by 40, 59 and 61%, re-spectively. In 2006, N had no effect (p < 0.05) on the dry weights of the plant parts (Figure 3). However, a ten-dency for the biomass to increase the vegetative parts: leaf (p < 0.08) and stem (p < 0.09), was observed in the treatments with more N (Figure 3a and b), while the fruit showed (p < 0.06) the opposite tendency (Figure 3c). As a result of this inverse response, a similar accumulation of the total biomass in the three treatments over the en-tire crop cycle was obtained (Figure 3d). This could be due to the fact that the N uptake in the N93 treatment was close to the threshold value of N uptake by melon crop (180 kg ha–1
0 50 100 150 200 250 300 350
0 20 40 60 80 100
Dr
y
w
e
ig
h
t
(g
m
–2
)
DAT N30
N85
N112
N139
a)
0 20 40 60 80 100 120
0 20 40 60 80 100
Dr
y
w
e
ig
h
t
(g
m
–2)
DAT b)
0 200 400 600 800 1000 1200
0 20 40 60 80 100
Dr
y
w
e
ig
h
t
(g
m
–2)
DAT d)
0 150 300 450 600 750
0 20 40 60 80 100
Dr
y
w
e
ig
h
t
(g
m
–2
)
DAT c)
Figure 2 – Dry matter production of leaf (a), stem (b), fruit (c) and total aerial plant (d) during the growing season in 2005. Each data point is the mean of four replicates. The bars represent the least significant difference (p < 0.05). DAT = days after transplanting.
Figure 3 – Dry matter production of leaf (a), stem (b), fruit (c) and total aerial plant (d) during the growing season in 2006. Each data point is the mean of four replicates. DAT = days after transplanting.
0 50 100 150 200 250 300 350
0 20 40 60 80 100
Dr
y
w
e
ig
h
t
(g
m
–2
)
DAT N93
N243
N393
a)
0 20 40 60 80 100 120
0 20 40 60 80 100
Dr
y w
e
ig
h
t
(g
m
–2
)
DAT b)
0 150 300 450 600 750
0 20 40 60 80 100
Dr
y
w
e
ig
h
t
(g
m
–2)
DAT
c)
0 200 400 600 800 1000 1200
0 20 40 60 80 100
Dr
y
w
e
ig
h
t
(g
m
–2
)
the whole plant (Figure 4a, b and d). The lowest values of dry matter production were always for the N11 treat-ment. Again, two growth responses were observed: the biomass of the vegetative part increased as the N amount increased, while the fruit biomass increased up to a maxi-mum of 430 g m–2 (N95 treatment). The total aerial biom-ass had a response (p < 0.05) to N application: the N148 treatment increased the total dry matter by 34% com-pared with the N11 treatment.
Dry matter maximum values were higher than those found in the literature. Kirnak et al. (2005) obtained 157.4 g m–2
for aerial dry biomass (without fruit) and Da Silva et al. (2006) 165.75 g m–2
for total aerial dry biomass, with similar N amounts in relation to ours, 120 and 98 kg ha– 1
, respectively. These variations could be due to the dif-ferent cultivar used and difdif-ferent edaphoclimatic condi-tions. The cultivar chosen in our case (Sancho) has a high vegetative and productive capacity and requires a low planting density because competition for water and nu-trients in dense plants stands decreases growth and yield (Cabello, et al., 2004).
Taking into account the fruit biomass in the three years, the optimum N supply was about 90 kg ha–1. Rates above this amount produce excessive vegetative growth, with no effect or with a negative effect on the fruit growth. The different growth behaviours with regard to N observed in the vegetative (leaf and stem) and repro-ductive parts (fruit) is in agreement with Kirnak et al.
(2005) for melon. This is due to the fact that heavy N applications can stimulate the vegetative growth at the expense of fruit yield (Mills and Jones, 1979; Hartz and Hochmuth, 1996).
Unlike the fruit biomass, the accumulated biomass of both leaf and stem in 2005 was lower than in 2006 and 2007. This reduction was produced as a result of a slowdown in leaf growth, as the fruit required photoassimilates. In similar species, such sas cucumber, the translocation of photoassimilates to the fruit can ex-ceed 50% of the total (Verkleij and Hofman-Eijer, 1988). The fact that this effect occurred in our study is also sup-ported by the event that in 2005, when the highest yield was obtained, the vegetative growth was slower, espe-cially when the fruit biomass was greater. This effect was more pronounced at lower N rates. On the other hand, the fruit developed later in 2006 and 2007 than in 2005. This could be due to a fruit-set delay because, in the last two years of the trial, the temperature dropped during the female flowering (in the middle of June) (Fig-ure 1) and, according to Maestro and Alvarez (1988), a good pollination requires a temperature higher than 18ºC, the optimum for the Piel de Sapo melon being about 30ºC.
At the beginning of the crop cycle, the leaf was the organ which contributed most to the total biomass in all three years, representing more than 80%. The stem made a stable contribution to the whole plant, both over
Figure 4 – Dry matter production of leaf (a), stem (b), fruit (c) and total aerial plant (d) during the growing season in 2007. Each data point is the mean of four replicates. The bars represent the least significant difference (p < 0.05). DAT = days after transplanting.
0 50 100 150 200 250 300 350
0 20 40 60 80 100
Dr
y
w
e
ig
h
t
(g
m
–2
)
DAT N11
N61
N95
N148
a)
0 20 40 60 80 100 120
0 20 40 60 80 100
Dr
y
w
e
ig
h
t
(g
m
–2
)
DAT b)
0 150 300 450 600 750
0 20 40 60 80 100
Dr
y
w
e
ig
h
t
(g
m
–2)
DAT c)
0 200 400 600 800 1000 1200
0 20 40 60 80 100
Dr
y
w
e
ig
h
t
(g
m
–2)
the cycle and between years. Fruit growth started nearly in the middle of the cycle, with a fast development. This produced a fast increase in its contribution to the total biomass. The values depended on the year, ranging be-tween 69.8% in 2005 and 41.3% in 2006. In these years, the fruit proportion decreased with N applications higher than 90-100 kg ha–1. This suggests that higher N amounts are allocated especially to the vegetative growth rather than fruit yield.
The year-to-year variation of the leaf dry matter con-tribution to the total aerial biomass could be due to the differences in yield among the three years, and thus in the competition for assimilates between leaves (sources)
and fruits (sinks). Fagan et al. (2006) stated that high fruit load affects leaf biomass negatively and Valantin et al. (1998) reported that the fruit number is the factor deter-mining the allocation of resources between vegetative and reproductive organs; fruits constitute large sinks, which grow at the expense of leaf formation.
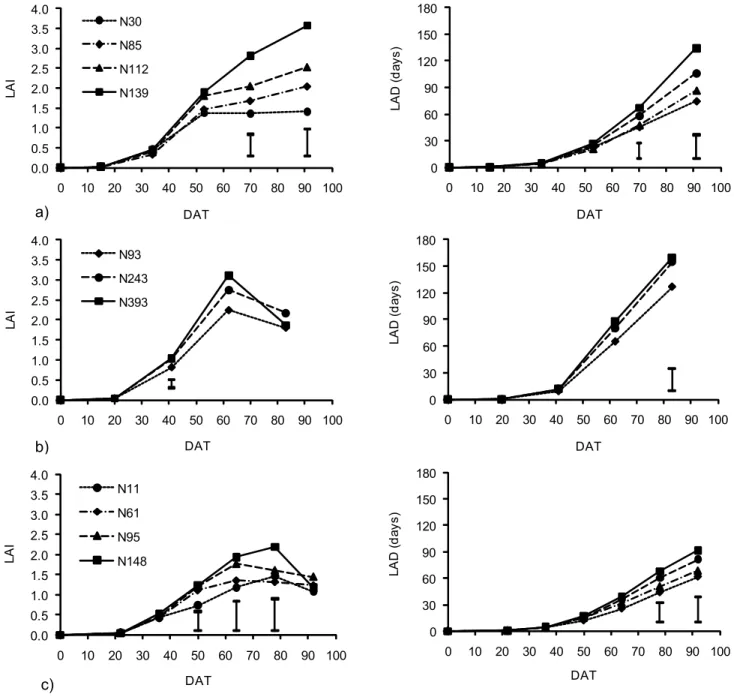
In 2005, except for the N30 treatment, a continuous increase in LAI up to the end of the cycle was observed (Figure 5a); this was affected (p < 0.05) by the N rates from 70 DAT. The maximum LAI value of 3.6 was ob-tained with N139, increasing by 157% compared to N30. In 2006, the highest LAI values occurred at 62 DAT (Fig-ure 5b). On this date, LAI was affected (p < 0.06) by the
0.0 0.5 1.0 1.5 2.0 2.5 3.0 3.5 4.0
0 10 20 30 40 50 60 70 80 90 100
LA
I
DAT N30
N85
N112
N139
a)
0 30 60 90 120 150 180
0 10 20 30 40 50 60 70 80 90 100
L
A
D
(
d
a
ys)
DAT
0.0 0.5 1.0 1.5 2.0 2.5 3.0 3.5 4.0
0 10 20 30 40 50 60 70 80 90 100
LA
I
DAT N93
N243
N393
b)
0 30 60 90 120 150 180
0 10 20 30 40 50 60 70 80 90 100
LA
D
(d
a
y
s
)
DAT
0.0 0.5 1.0 1.5 2.0 2.5 3.0 3.5 4.0
0 10 20 30 40 50 60 70 80 90 100
LA
I
DAT N11
N61
N95
N148
c)
0 30 60 90 120 150 180
0 10 20 30 40 50 60 70 80 90 100
LA
D
(
d
ay
s
)
DAT
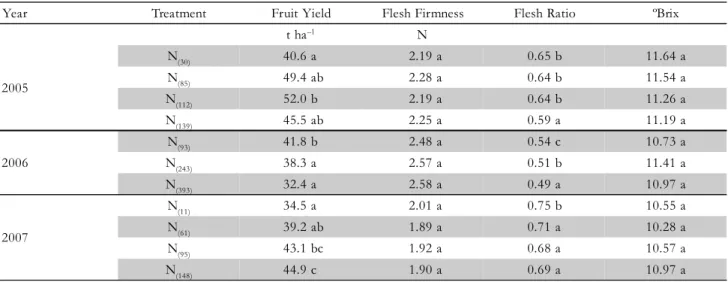
Table 2 – Fruit yield of melon grown at different N rates in 2005, 2006 and 2007.
Year Treatment Fruit Yield Flesh Firmness Flesh Ratio ºBrix
t ha–1 N
2005
N(30) 40.6 a 2.19 a 0.65 b 11.64 a
N(85) 49.4 ab 2.28 a 0.64 b 11.54 a
N(112) 52.0 b 2.19 a 0.64 b 11.26 a
N(139) 45.5 ab 2.25 a 0.59 a 11.19 a
2006
N(93) 41.8 b 2.48 a 0.54 c 10.73 a
N(243) 38.3 a 2.57 a 0.51 b 11.41 a
N(393) 32.4 a 2.58 a 0.49 a 10.97 a
2007
N(11) 34.5 a 2.01 a 0.75 b 10.55 a
N(61) 39.2 ab 1.89 a 0.71 a 10.28 a
N(95) 43.1 bc 1.92 a 0.68 a 10.57 a
N(148) 44.9 c 1.90 a 0.69 a 10.97 a
For each year and within each column, values followed by the same letter are not different (p < 0.05). N amount, increasing by 23% (N243) and 39% (N393)
com-pared to N93. In 2007, the maximum LAI (2.2) was reached in the N148 treatment at 78 DAT and this was 47% higher than the control value (N11). At the end of the cycle, the LAI values decreased and, as in the previous year, the reduction was more marked with the higher N amounts (Figure 5c).
The decrease observed from 62 DAT in 2006 and from 64-78 DAT in 2007 was due to an infection by
Sphaerotheca fuliginea. Both the LAI values and their
evo-lution in the last two years are in agreement with the results obtained by Ribas et al. (2000) by Pinyonet-Piel de sapo melon and, as in our case, LAI was very sensi-tive to factors limiting the growth and production. De Pinheiro Henriques and Marcelis (2000) found a strong decrease in dry matter production of lettuce (Lactuca sa-tiva L.) with decreasing rate of N supply, which was ac-companied by an important decline in LAI.
In 2005, LAD was also affected (p < 0.05) by the N treatments from 70 DAT, increasing with the N supply (Figure 5a). At the end of the cycle, the LAD value for the N139 treatment was 60 days longer than for N30. In 2006, N affected LAD at 83 DAT and the highest value (160 d) was obtained at 393 kg N ha–1 (Figure 5b). In 2007, LAD values were lower than in previous years and N had an influence from 78 DAT (Figure 5c). At the end of the cycle, the values were 62 and 92 days in N11 and N148 treatments, respectively.
Given that N influenced LAI in 2005 and 2007, LAD was also affected. In 2006, over the entire crop cycle, LAD values were similar in the two treatments with the high-est N amounts because, although at 64 DAT, LAI was slightly lower in treatment N243 than in N393; this differ-ence was compensated later. On the other hand, at 83 DAT, LAD was lower (p < 0.05) in the N93 treatment than in the other two, because LAI was also lower dur-ing the growdur-ing cycle.
Two linear regressions were found by relating the fruit yield to LAD, the first one with a positive slope
was obtained taking into account the yield values which were increasing as LAD values increased until the maxi-mum yield was reached: y = 0.2977x + 13.8547; R2 = 0.94; STD = 1.096; p < 0.001, and the second straight line with a negative slope was determined taking into account the maximum yield and the decreasing LAD val-ues: y = -0.19x + 65.12; R2 = 0.76; STD = 2.754; p < 0.05. The breaking point between the two regressions was obtained with LAD values of 104 d and fruit yields of 44.82 t ha–1. These results suggest that it is necessary to keep a balance between vegetative and reproductive growth to obtain high fruit yield. With LAD values higher than 104 days, the vegetative growth was higher but the fruit yield was negatively affected.
N affected the fruit yield in all three years (Table 2). In 2005, the highest yield was obtained with 112 kg ha–1 of N, decreasing by 22% in relation to the N30 treatment. In 2006, the highest yield was obtained with 93 kg ha–1of N, decreasing by 23% at the maximum amount of N ap-plied. In 2007, the fruit yield rose by 25% and 30% when the N rate increased from 11 to 95 and 148 kg ha–1
, re-spectively.
An increasing N supply produces an increase in the fruit yield up to a maximum value, but, if the supply continues increasing, the production is affected in a nega-tive way. However, other authors did not obtain signifi-cant reductions with rates of 160 kg ha–1 of N (Pérez-Zamora and Cigales-Rivero, 2001), 300 mg L–1 of N (Purqueiro et al., 2003) or 120 kg ha–1
of N (Kirnak et al., 2005). Hochmuth and Cordasco (2000) recommend 168 kg ha–1 of N.
0.0 0.2 0.4 0.6 0.8 1.0 1.2
0 100 200 300 400 500
Re
la
ti
v
e
y
ie
ld
N applied (kg ha-1)
(1) y=-0.000006x2+0.0023x+0.764; R2=0.69; S.E.=0.058; p <0.01
(2) y=0.0021x+0.7534; R2=0.87; S.E.=0.038; p<0.001
(3) y=-0.00071x+1.0597; R2=0.73; S.E.=0.055; p <0.05
(1) (2)
(3)
Two linear regressions were obtained as a result of di-viding the yield response to applied N into two intervals (0-111 and 111-393 kg N ha–1). In this way, the coefficients of determination (R2) and the standard errors were im-proved, although the regression showing the decrease of yield versus N applied did not have improved in signifi-cance. The first straight line (2) has a positive slope, greater than that of the second, and shows the increase in relative yield as N fertilizer increases from 11 to 111 kg ha–1
. The second straight line (3) has a negative slope and shows the decrease of yield as N supply continues increasing up to 393 kg ha–1. In this case, yields higher than 95% of the maximum could be obtained with N amounts between 93 and 155 kg ha–1
.
Different functions were obtained to relate yield to the amount of applied fertilizer. Unlike Kirnak et al. (2005), who obtained a good second-degree function, in our case, the fruit yield shows a different behaviour when the opti-mum N amount has not been reached and when this amount has been exceeded. In these cases, the use of sym-metrical functions, such as a second-degree polynomial, usually show a worse adjustment and also the behaviour of the crop is less explained than when two different func-tions are obtained. For this reason, it was better to divide the yield response into two phases to obtain two first-de-gree equations. So, this model predicts better the maxi-mum yield value (the point of intersection of two straight lines), obtained with 111 kg ha–1 of N, since the maximum yields in the three years were produced between 93 and 148 kg ha–1 of N. This amount was 43% lower than that ob-tained with the quadratic model, and 34% lower than 168 kg ha–1
of N recommend by Hochmuth and Cordasco (2000).
The function relating the relative yield to leaf N con-centration (Figure 7) was adjusted to a second-degree polynomial. The maximum yield is obtained with a leaf N concentration of 22.2 g kg–1
and 90% of the maxi-mum yield would be expected with leaf N concentra-tions of 19.5 g kg–1 and 25.0 g kg–1. Lower concentra-tions than 19.5 g kg–1 and higher concentrations than 25.0 g kg–1
would produce a larger decrease of yield. The
curvilinear relationship between relative yield and leaf N concentration was significant and showed low R2 (0.63). The optimum N concentrations are lower than those obtained by Kirnak et al. (2005) in galia melon, who obtained less fruit yield than we obtained. In ac-cordance to our results, Marr and Lamont (1992) ob-tained mean values of leaf N concentration of 20.0 g kg–1. The lowest leaf N concentration coincides with the fruit growth because this one is a large sink of nutri-ents (Goreta et al., 2005).
In the three years, flesh ratio increased gradually (p < 0.05) with decreasing N application, ranging between 0.65 (N30) and 0.59 (N139) in 2005, 0.54 (N93) and 0.49 (N393) in 2006, and 0.75 (N11) and 0.68 (N95). These findings show that excess N reduces the fruit quality, increasing the central cavity and decreasing the edible part. The N amount did not affect flesh firmness. On the contrary, Silva et al. (2007) observed a decrease in the flesh firmness with increasing N rates in yellow melon. Total soluble solids were not affected by the N treatments in accordance to the results obtained by Rodriguez et al. (2005) for Galia melon and Silva et al. (2007) for yellow melon. Kirnak et al. (2005) also reported that N application generally had little or no effect on soluble solids.
In conclusion, the melon crop shows two patterns of growth as a response to the applied N. The vegeta-tive part increases gradually as N supply increases. Con-versely, the relative fruit yield increases up to a maximum after which it decreases. The maximum yield and the highest proportion of fruit biomass in relation to that of the whole plant would be obtained with a N supply of the order of 90-100 kg ha–1. The optimum leaf N concentration at the end of the growing season, with re-spect to obtaining the maximum fruit yield, is close to 22.2 g kg–1.
Acknowledgements
This work was funded by the Instituto Nacional de Investigación y Tecnología Agraria y Alimentaria, Spanish Agency (Project RTA 04-111-C3).
Figure 7 – Relationships between relative yield (yield/maximum yield) and leaf nitrogen concentration in 2005, 2006 and 2007. Each data point is the mean of four replicates. S.E. = standard error. n = 11
0.6 0.7 0.8 0.9 1.0 1.1
1.5 2.0 2.5 3.0
R
elativ
e y
ield
N in leaf (%)
y=-0.757x2+3.3692x-2.7811; R2=0.63; S.E.=0.064; p< 0.05
References
Association of Official Analytical Chemists [AOAC]. 1990. Official Methods of Analysis. 15ed. AOAC, Arlington, VA. USA. Bartolo, M.E.; Shweissing, F.C. 1998. Yield and quality response of
muskmelon to simulated storm damage. HortScience33: 34-35. Bremer, J.M. 1996. Nitrogen - Total. p. 1085-1121. In: Sparks, D.L., ed.
Methods of Soil Analysis. Part 3: Chemical Methods. SSSA/SSSA/ ASA, Madison, WI, USA. (Book Series, 5).
Cabello, M.J.; Ribas, F.; Castellanos, M.T.; Figueiró, N. 2004. Yield and quality of Sancho melon variety. Vid a Rural 186: 24-27. (in Spanish).
Cabello, M.J.; Castellanos, M.T.; Romojaro, F.; Martinez, C.; Ribas, F. 2009. Yield and quality of melon grown under different irrigation and n itrogen rates. Agricultural Wate r Manage ment 96: 866-874.
Castellanos, M.T.; Cartagena, M.C.; Ribas, F.; Cabello, M.J.; Arce, A.; Tarquis A.M . 2010. E ffi cie ncy In dexes for Me lon Crop Optimization. Agronomy Journal 102: 716-722.
Fogaça, M.A.F.; Andriolo, J.L.; Godoi, R.S.; Barros, C.A.P.; Janisch D.I.; Braz Vaz, M.A. 2008. Nitrogen critical dilution curve for the muskmelon crop. Ciência Rural 38: 345-350. (in Portuguese, with abstract in English).
De Pinheiro Henriques, A.; Marcelis, L.F.M. 2000. Regulation of growth at steady-state nitrogen nutrition in lettuce (Lactuca sativa L): interactive effects of nitrogen and irradiance. Annals of Botany 86: 1073-1080.
Doorenbos, J.; Pruit, W.O. 1977. Crop Water Requirements. FAO Irrigation and Drainage,.Rome, Italy. (Book Series, 5).
Fagan, E.B.; Medeiros, S.L.P.; Simon, J.; Luz, G.L.; Borcioni, E.; Jasniewicz, L.R.; Casaroli, D.; Manaron, P.A. 2006. Evolution and partitionig of dry biomass of muskmelon in hidroponic. Acta Scientiarum-Agronomy 28: 165-172. (in Portuguese, with abstract in English).
Food and Agriculture Organization [FAO]. 2007. FaoStat. Available at: htt p:// faostat.f ao.o rg/si te/567/Deskto pDef ault.aspx#anc or. [Accessed Oct. 13, 2009].
Fukut oku, Y .; Koto , S .; Teraoka, Y.; Kubo, K. 2000. Nit rog en absorption and distribution of muskmelons (Cucumis melo L.) at different growth stages using hydroponics. Japanese Journal of Soil Science and Plant Nutrition 71: 72-81. (in Japanese, with abstract in English).
Go ret a, S.; Pe rica, S .; Dumici c, G.; Bucan , L.; Z ani c, K. 2005. Growth and yield of watermelon on polyethylene mulch with different spacings and nitrogen rates. HortScience 40: 366-369. Hartz, T.K.; Hochmuth, G.J. 1996. Fertility management of
drip-irrigated vegetables. HortTechnology 6: 168-172.
Hesse, P .R. 1971. A Textbook of Soil Chemi cal Analysis. John Murray Publishers, London. UK.
Hochmuth, G; Cordasco, K. 2000. A summary of N and K research wi th muskme lon in Fl ori da. Flo rid a Coop erative E xte nsi on Service. Institute of Food and Agricultural Science, University of Florida. Available at: http://edis.ifas.ufl.edu/pdffiles/CV/ CV23100. pdf. [Accessed Oct. 13, 2009].
Hubbard, N.L.; Pharr, D.M.; Huber, S.C. 1990. Sucrose metabolism in ripening muskmelon fruit as affected by leaf area. Journal of American Society for Horticultural Science 115: 798-802. Huett , D.O. 1996. Pro spe cts fo r mani pul ati ng t he veg
etative-reproductive balance in horticultural crops through nitrogen nutrition: a review. Australian Journal of Agricultural Research 47: 47-66.
Kirnak, H.; Higg, D.; Kaya, C.; Tas, I. 2005. Effect of irrigation and nitrogen rates on growth, yield, and quality of muskmelon in semiarid regions. Journal of Plant Nutrition 28: 621-638.
Maestro, M.C.; Al varez, J. 1988. The e ffects of temperature on pollination and pollen tube growth in muskmelon (Cucumis melo
L). Scientia Horticulturae 36: 173-181.
Marr, C.W.; Lamon t, W.J. 1992. Fert ig ation of veg etab le crop s. Commercial vegetables production. Cooperative Extension Service. Kansas State University, Manhattan, KS, USA. (Document, 92-312-E: 1-4).
Mills, H.A.; Jones, J.B.jr. 1979. Nutrient deficiencies in plants: nitrogen. Journal of Plant Nutrition 1: 101-122.
Ministerio de Agricultura y Alimentación [MAPA]. 1994. Official Methods of Analysis. Ed. Madrid, Spain. (in Spanish). Ol sen , S .R.; Co le, C.V.; Watan abe , F .S.; De an, L.A. 1954.
Estimation of available phosphorous in soils by extraction with so dium bi carbonate. US DA, Washing ton ,, DC, USA. (Circ. 939).
Panagiotopoulos, L. 2001. Effects of nitrogen fertigation on growth, yi eld, quali ty and leaf nutrie nt composi tio n of me lon . Ac ta Horticulturae 563: 115-121.
Pe il, R.M.; Galve z, J.L. 2005. Dry-matt er partit ion ing as a determinant of greenhouse fruit vegetable crops production. Revista Brasileira de Agrociência 11: 5-11. (In Spanish). Pérez-Zamora, O.; Cigales-Rivero, M. 2001. Soil moisture tension
and nitroge n fertil ization on can taloupe melon. Agrocie ncia 35: 479-488.
Pratt, P.F. 1965. Potasium. p. 1027-1028. In: Black, C.A., ed. Methods of soils analysis. American Society of Agronomy, Madison, WI, USA. Purqueiro, L.F.V.; Cecílio Filho, A.B.; Barbosa, J.C. 2003. Effect of nitrogen concentration in nutrient solution and number of fruits per plant on yield of melon. Horticultura Brasileira 21: 185-190. (in Portuguese, with abstract in English).
Ribas, F.; Cabello, M.J.; Moreno, M.M.; Moreno, A.; López-Bellido, L. 2000. Physiological response of a melon crop (Cucumis melo
L.) to di ffe rent wateri ng reg imes. In vestig aci ón Agrari a: Producción y Protección Vegetales 15: 195-212. (in Spanish, with abstract in English).
Rodriguez, J.C.; Shaw, N.L.; Cantliffe, D.J.; Karchi, Z. 2005. Nitrogen fe rti lizati on sch edulin g o f h ydo pon ically grown “Gali a” muskmelo n. Proc ced ing s o f t he Flo rid a S tate Ho rti cul tural Society 118: 106-112.
Silva, P.S.L.; Rodrigues, V.L.P.; Medeiros, J.F.; Aquino, B.F.; Silva, J. 2007. Yield and quality of melon fruits as a response to the application of nitrogen and potassium doses. Revista Caatinga 20: 43-49. Silva Júnior, M.J.; Medeiros, J.F.; Oliveira, F.H.T.; Dutra, I. 2006. Dry
matter accumulation and nutrient uptake by “pele-de-sapo” melon plants. Revista Brasileira de Engenharia Agrícola e Ambiental 10: 364-368. (in Portuguese, with abstract in English).
Soil Survey Staff. 1999. Soil Taxonomy: A Basic System of Soil Classification for Making and Interpreting Soil Surveys. 2ed. Washington, DC, USA. (Agriculture Handbook, 436). Valantin, M.; Gary, C.; Vaissière, B.; Tchamitchian, M.; Bruneli,
B. 1998. Changing sink demand affect s the area but not the specific activity of assimilate sources in Cantaloupe (Cucumis melo L). Annals of Botany 82: 711-719.
Verkleij, F.N.; Hofman-Eijer, L.B. 1988. Diurnal export of carbon and fruit growth in cucumber. Journal of Plant Physiology 133: 345-348.