Objective: To verify the correlation between the areas evaluated by the Brunet‑Lézine and the Bayley III scales of preterm infants up to two years.
Methods: The study included 88 children who were divided into 3 groups: Group 1 (1 month to 5 months and 29 days of corrected chronological ages – CCA) with 32 children; Group 2 (6 months to 11 months and 29 days of CCA) with 36 participants; and Group 3 (18 –23 months and 23 days of CCA) with 20 children. The concurrent validity of the Brunet‑Lézine scale and the Bayley III scale was calculated using the Pearson correlation or its non‑ parametric version, the Spearman correlation.
Results: Group 1 showed moderate correlation between the developmental quotient for hand‑eye and fine motor coordination (DQE), and ine motor score (ρ=0.448; p=0.01).
Group 2 had moderate correlation between the developmental quotient for posture and gross motor function (DQP), and the gross motor score (ρ=0.484; p=0.003, between the DQE and ine motor score (r=0.489; p=0.002), and between the developmental
quotient for social reactions (DQS) and the socio emotional score (r=0.435; p=0.008). Group 3 showed moderate correlation
between the DQP and the gross motor score (ρ=0.468; p=0.037) and strong correlation between developmental quotient for language (DQL) and the score of language (r=0.890; p<0.001).
Conclusions: The Brunet‑Lézine scale showed strong correlation with the Bayley III scale regarding the language domain in Group 3, suggesting its validity to assess the language of children aged between 18 and 24 months.
Keywords: psychometrics; child development; validity of tests.
Objetivo: Veriicar a correlação entre as áreas avaliadas pela Escala Brunet‑Lézine e pela Escala Bayley III no desenvolvimento de bebês pré‑termo de risco até dois anos de idade.
Métodos: Foram incluídas no estudo 88 crianças, divididas em 3 grupos: Grupo 1 (1 mês a 5 meses e 29 dias de idade cronológica corrigida – ICC), com 32 crianças; Grupo 2 (6 meses a 11 meses e 29 dias de ICC), com 36 participantes; e Grupo 3 (18 meses a 23 meses e 23 dias de ICC), com 20 crianças. A validade concorrente entre a Escala Brunet‑Lézine e a Escala Bayley III foi calculada por meio da correlação de Pearson ou de sua versão não paramétrica, a correlação de Spearman.
Resultados: No Grupo 1 houve correlação moderada entre o quociente de desenvolvimento da coordenação óculo‑motriz (QDC) e o escore motor ino (ρ=0,448; p=0,01). No Grupo 2 foi encontrada correlação
moderada entre o quociente de desenvolvimento da postura (QDP) e o escore motor grosseiro (ρ=0,484; p=0,003), entre o QDC e o escore
motor ino (r=0,489; p=0,002) e entre o quociente de desenvolvimento de sociabilidade (QDS) e o escore socioemocional (r=0,435; p=0,008).
No Grupo 3 foi observada correlação moderada entre o QDP e o escore motor grosseiro (ρ=0,468; p=0,037), e correlação forte entre
o quociente de desenvolvimento da linguagem (QDL) e o escore da linguagem (r=0,890; p<0,001).
Conclusões: A Escala Brunet‑Lézine apresentou forte correlação com a Escala Bayley III quanto à linguagem no Grupo 3, o que sugere a sua validade para avaliar crianças entre 18 e 24 meses de idade nesse quesito.
Palavras‑chave: psicometria; desenvolvimento infantil; validade dos testes.
ABSTRACT
RESUMO
*Corresponding author. E‑mail: [email protected] (T. Bizinotto). aUniversidade do Estado de Santa Catarina, Florianópolis, SC, Brazil. bUniversidade Estadual de Goiás, Goiânia, GO, Brazil.
ConCurrent Validity of the Brunet‑lézine
SCale with the Bayley SCale for
aSSeSSment of the deVelopment
of preterm infantS up to two yearS
Validade concorrente da Escala Brunet-Lézine com a Escala Bayley
para avaliação do desenvolvimento de bebês pré-termo até dois anos
Fernanda Guimarães Campos Cardoso
a, Cibelle Kayenne Martins Roberto Formiga
b,
INTRODUCTION
he use of validated instruments is essential to establish a stan‑ dardized language between professionals of diferent areas. hey allow the comparison of data throughout time and the conference of therapeutic techniques and approaches, besides providing scientiic base to understand and analyze the problems observed. he process of validation assesses the correction and relevance of a proposed interpretation, that is, it evaluates what is measured by the test, and how well it measures the data that need assessment. Validation can be subdivided into criterion validity, content validity, and construct validity.1‑7
Concurrent validity represents the relation of the scores in the analyzed test with the scores of another test, preferably a test considered as “gold standard”, in the same construct. By com‑ paring the results of the test with the reference ones, a measure is obtained to function as a diagnostic reference. his type of validity is especially interesting for physical therapists in order to decide which instrument to use in their practice.3‑5,7‑9 Predictive
validity examines the accuracy of the scores of an evaluation instrument, administered in a speciic period, to predict future outcomes in the child’s development.3,5
The Scale of Psychomotor Development of Children, also known as the Brunet–Lézine Scale, was validated for the French population,10 but there is a modiied version used in
studies conducted with the Brazilian children present no delays in psychomotor development.11 Among the beneits of using
this scale are the easy administration, the short time of appli‑ cation, and the low cost of training and acquisition of materi‑ als. hese qualities, when associated with good psychometric properties, are essential to choose the instrument and favor its use in follow‑up of outpatient clinics.4,5,12
On the other hand, one of the most used assessment instru‑ ments of development for children all over the world is the Bayley Scales, applied to measure the cognitive development of preschoolers. Its second version is mostly used to identify children with developmental delay;8,13‑18 he Bayley Scales are
considered the gold‑standard to assess childhood development; therefore, they are commonly used in the world, in comparison to other instruments of psychomotor development evaluation.
In this context, the objective of this study was to verify the correlation between the areas assessed by the Brunet–Lézine and the Bayley Scale III in the development of preterm infants at risk up to the age of two years.
METHOD
his study included 88 children, 45 male (51.1%) and 43 female (48.9%), assessed between January and October 2011. he following inclusion criteria were adopted: birth weight
<1500 g and attending the High Risk‑Infant Outpatient Clinic at the University Hospital Polydoro Ernani de São hiago, in Universidade Federal de Santa Catarina (UFSC), or the High‑ Risk Follow‑up Clinic Carmel Dutra, during the period of data collection. Exclusion criteria were diagnosis of genetic condi‑ tions, and congenital and/or heart malformation.
he following instruments were used for assessment: the Bayley III Scale and the Scale of Psychomotor Development of Children (the Brunet–Lézine Scale), in a single opportu‑ nity. he order of application was random. he scales were administered by two researchers, each of whom was in charge of one of the instruments from the beginning to the end of the study. Both researchers were trained for both instruments, and the reliability rate obtained for the application was con‑ sidered adequate.
he Bayley Scale was created by the American psychologist Nancy Bayley, in 1969, and revised in 2006. It is composed of three sub‑scales carried out by the child: cognitive scale, language scale (receptive and expressive communication), and motor scale (ine and gross motor areas). It is also composed of the socioemotional scale and the adaptive behavior question‑ naire, which is answered by the people in charge of the child.21
The Scale of Psychomotor Development of Children (the Brunet–Lézine Scale) is a French scale, developed in the 1950s by Odette Brunet and Irène Lézine. After going through some changes, it was published in 1976. he manual and the items were translated to Portuguese in 1981.10 he scale aims
at assessing children aged between 1 and 30 months as to the following areas of development: posture, hand‑eye coordina‑ tion, language, and sociability.
Considering the corrected chronological age (CCA) at the time of evaluation, the sample was divided into three groups: Group 1 (1 to 5 months and 29 days of CCA), with 32 chil‑ dren; Group 2 (6 to 11 months and 29 days of CCA) with 36 children; and Group 3 (18 to 23 months and 23 days of CCA) with 20 children. Prematurity correction was carried out by subtracting the chronological age according to the time left to complete 40 weeks.
Considering that the Brunet–Lézine Scale is conducted month by month, in Group 1 the choice was to include only children aged more than one month of CCA; this decision aimed at preventing children aged less than a month old did not perform any item, thereby generating zero score, this would lead to the underestimation of the child’s performance.
he calculation of concurrent validity between the Brunet– Lézine and the Bayley III scales was conducted based on the correlation between the scores in the areas assessed by the Brunet–Lézine score in relation to the scores in the Bayley III Scale, after the latter was corrected by constant ‑7. he scale manual found means seven points higher than the means found by the Bayley Scale evaluation.21 To neutralize the overesti‑
mation of development, a “correction” was carried out in the scores of the Bayley III scale, subtracting seven points from all composed or converted scores, aiming at analyzing, in a more reliable way, the psychomotor development, and to improve the precision of delay diagnoses.
Gross motor skills were analyzed based on the correlation between the developmental quotient for posture (DQP), in the Brunet–Lézine Scale and the gross motor score in the Bayley III Scale. he ine motor skills were related to the cor‑ relation between the developmental quotient for hand–eye coordination, in the Brunet–Lézine Scale, and the ine motor skills in the Bayley III scale. In the language ield, there was a correlation between the developmental quotient for lan‑ guage (DQL) in the Brunet–Lézine scale, and the score of language in the Bayley III scale. To assess the sociability fac‑ tor, the quotient for social reactions (QSR), in the Brunet– Lézine Scale, was correlated with the socioemotional score in the Bayley III Scale.
he concurrent validity between the Brunet–Lézine and the Bayley III Scales was calculated using the Pearson correlation, or its non‑parametric version, the Spearman correlation. he levels of correlation were categorized – based on the following clas‑ siication: 0.00–0.19, weak; 0.20–0.39, very weak; 0.40–0.59, moderate; 0.60–0.79, strong; and >0.80, very strong.22 he anal‑
ysis of sensitivity, speciicity, positive and negative predictive val‑ ues, and accuracy of the Brunet–Lézine Scale was conducted by the relations between the delay diagnoses in this scale with the Bayley III Scale; the values were corrected by the ‑7 constant.
hese measures were calculated based on the results of all par‑ ticipants. Data were exposed in the matrix for calculation. his demonstration in the matrix and the precision measures of the Brunet–Lézine Scale were obtained using formulas in the lit‑ erature about clinical epidemiology.23 he use of scales that pref‑
erably have sensitivity values higher than 80% is recommended, as well as speciicity higher than 90%, and positive predictive values higher than 70%.4 herefore, this study classiied values
above this recommendation as adequate.
RESULTS
In this study, the biological data had the following results, described as mean±standard deviation: birth weight 1140±236 g; birth height 36.9±2.8 cm; and gestational age (GA) 212±14 days. here was no statistical diference between the means of birth weight and GA in the three groups, according to the test of analysis of variance – ANOVA (F=0.303 and p=0.739 for birth weight; and F=0.697 and p=0.501 for GA).
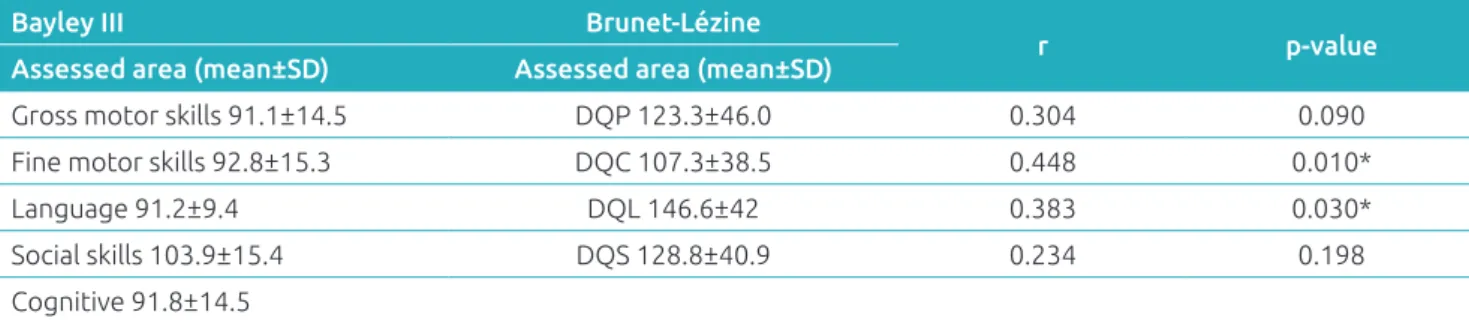
he performance of children in Group 1, in both scales, and the correlation between the developmental areas are described in Table 1. he Brunet–Lézine Scale showed that the hand–eye coordination was the area in which children presented with most delays. According to the Bayley III Scale, the gross motor area was the one presenting more delays, however, the mean was within expectations. As to the analy‑ ses of concurrent validity, no correlation was found between DQP and gross motor skills (ρ=0.304; p=0.090), nor between the DQS and the socioemotional score (ρ=0.234; p=0.198). here was moderate correlation between the hand–eye coor‑ dination and the ine motor score (ρ=0.448; p=0.01), and very weak correlation between DQL and the language score (ρ=0.383; p=0.030).
Table 2 presents the performance of children and the correla‑ tion per area between the scales applied in Group 2. According
Table 1 Correlation between the Bayley III Scale and the Brunet–Lézine Scale per area for Group 1 (32 patients
aged 1 to 6 months old).
Bayley III Brunet‑Lézine
r p‑value
Assessed area (mean±SD) Assessed area (mean±SD)
Gross motor skills 91.1±14.5 DQP 123.3±46.0 0.304 0.090 Fine motor skills 92.8±15.3 DQC 107.3±38.5 0.448 0.010*
Language 91.2±9.4 DQL 146.6±42 0.383 0.030*
Social skills 103.9±15.4 DQS 128.8±40.9 0.234 0.198 Cognitive 91.8±14.5
to the Brunet–Lézine Scale, in Group 2, a child presented with delay in language development. Considering the Bayley Scale, children in Group 2 performed worse in the gross motor ield, being 5 of them (13.9%) classiied with developmental delay. By making analyses of correlation between the scales, mod‑ erate correlation was found between DQP and gross motor skills (ρ=0.484; p=0.003), between hand–eye coordination and ine motor score (r=0.489; p=0.002), and between DQS and socioemotional score (r=0.435; p=0.008). However, no correlation between the variables was found for the language area (ρ=0.252; p=0.138).
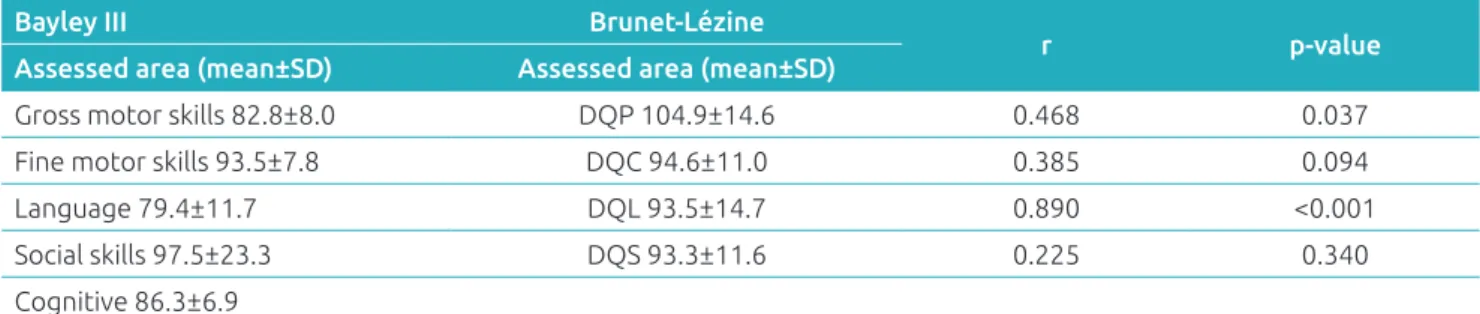
Table 3 shows the performance of Group 3 in each scale, and the correlation values. Considering the Brunet–Lézine Scale, the children presented with lower mean in the socia‑ bility area, and four of them manifested delay in the language area. Likewise, when assessed by the Bayley III Scale, the chil‑ dren presented the expected performance in the ield of lan‑ guage, also with four children presenting delay in social skills. When both scales were correlated, it was possible to verify that there was moderate correlation between DQP and gross motor
score (ρ=0.468; p=0.037), and a very strong correlation between DQL and the language score (r=0.890; p<0.001). However, no correlation was found between DQC and ine motor score (r=0.385; p=0.094), and between DQS and socioemotional score (r=0.225; p=0.340).
he percentage rates of sensitivity, speciicity, positive pre‑ dictive value (PPV), negative predictive value (NPV), and accu‑ racy of the Brunet–Lézine Scale are presented in Table 4. As to sensitivity, the Brunet–Lézine scale presented, in all areas, values that were below expectations, as it was hardly sensitive in the gross motor and sociability areas, and little sensitive in the ine motor area. he speciicity analyses in the Brunet–Lézine Scale indicated high speciicity in all developmental areas. his scale presented low PPV in all assessed areas; NPV in this scale was acceptable for gross motor skills, good for sociability, and high for the ields of language and ine motor skills. he diagnos‑ tic percentage of the Brunet–Lézine Scale, compared to the Bayley III Scale, was lower in the ields of sociability and gross motor skills, similar in the ield of ine motor skills and higher in the language area.
Table 3 Correlation between the Bayley III Scale and the Brunet–Lézine Scale domains per area for Group 3 (20
patients aged from 18 to 24 months old).
Bayley III Brunet‑Lézine
r p‑value
Assessed area (mean±SD) Assessed area (mean±SD)
Gross motor skills 82.8±8.0 DQP 104.9±14.6 0.468 0.037 Fine motor skills 93.5±7.8 DQC 94.6±11.0 0.385 0.094
Language 79.4±11.7 DQL 93.5±14.7 0.890 <0.001
Social skills 97.5±23.3 DQS 93.3±11.6 0.225 0.340 Cognitive 86.3±6.9
SD: Standard deviation. Corrected Bayley III Scale Scores (‑7): developmental quotient for posture; DQC: quotient for hand‑eye coordination; DQL: developmental quotient for language; DQS: developmental quotient for social reactions.
Table 2 Correlation between the Bayley III Scale and the Brunet–Lézine Scale per area for Group 2 (36 patients
aged from 6 to 12 months old).
Bayley III Brunet‑Lézine
r p‑value
Assessed area (mean±SD) Assessed area (Mean±SD)
Gross motor skills 79.4±11.5 DQP 115.3±11.7 0.484 0.003 Fine motor skills 98±12.4 DQC 104.9±10.8 0.489 0.002
Language 92.1±10.6 DQL 104.3±15.7 0.252 0.138
Social skills 96.3±18.5 DQS 113.2±14.2 0.435 0.008 Cognitive 99.8±11.2
DISCUSSION
Up until now, the literature did not show studies assessing the concurrent validity of any versions of the Brunet–Lézine Scale [version of the authors, modiied version, and revised version (BLR)].10,11 In this sense, the Bayley III Scale was used to assess
this psychometric data.
Considering the gross motor skills, moderate correlation was found between both scales in Groups 2 and 3, values of 0.484 and 0.468, respectively. he same correlation (moderate; 0.54) was found between gross motor score (Bayley III Scale) and the Psychomotor Development Index (PDI), in Bayley II Scale, among 57 children aged 1–42 months. Between the Bayley III Scale and the Peabody Developmental Motor Scale – Second Edition (PMDS‑2), there was similar moderate correlation (0.59) between the gross motor score (Bayley III Scale), and the gross motor quotient (PMDS‑2) of 81 children aged 2 to 42 months.21
In the ine motor skill area, there was positive moderate correlation between the modiied version of the Brunet–Lézine Scale and the Bayley III Scale in Groups 1 (0.45) and 2 (0.49). In another study, it was possible to observe that the correla‑ tion of the ine motor score in the Bayley III Scale, with the PDI of the Bayley II Scale, was moderate (0.52). In another study conducted by the authors of the Bayley Scale, the ine motor score (Bayley III Scale) was compared with the motor ine quotient and with the visual–motor integration subtest, both in the PDMS‑2, in which both correlations were mod‑ erate (0.59 and 0.55, respectively).21 In this study, the ine
motor correlations in Groups 1 and 2 were moderate, as well as the correlation between the Bayley III Scale and other scales assessing ine motor skills.
In the ield of language, there was very weak positive cor‑ relation between DQL (Brunet–Lézine) and the score com‑ posed of language (Bayley III Scale) in Group 1 (0.383), and there was strong positive correlation between both scores in Group 3 (r=0.890). By correlating the composed language score (Bayley III Scale) with the Mental Developmental Index (MDI) in the Bayley II Scale, as evident in the study published by the scale manual, there was strong correlation between them
(0.71). A recent study that analyzed the presence of correlation between the language area of these two scales, indicated that there was strong correlation (0.81) between the language score in the Bayley III Scale and the MDI score.18 When assessing the
Bayley III Scale and another scale speciic for language (Preschool Language Scale Fourth Edition – PLS‑4), there was moderate correlation (0.66) between the composed scores, assessed in 69 children aged 5–42 months.21 It is worth mentioning that the
correlation with higher value between the scales analyzed here was veriied in the language area of Group 3.
By observing the social skills, there was moderate correlation in Group 2, higher than the one found in the speciic analysis of the scale, which compared the socioemotional scores of the third version of the Bayley Scale, mental (MDI) and behavioral classiication (Behavior Evaluation Scale for Children – BRS). In both correlations, between the children mentioned in the study presented in the Bayley Scale, the level of strength was weak, with values ranging from 0.25 to 0.37, respectively.21
Values that low can be explained by the lack of scales that assess only socioemotional matters, as was the case of the previous version of the Bayley Scale.
When both test formats are used for important deci‑ sion‑making, the correlations must be very high, around 0.95.8
Considering this statement, it is not possible to ensure that the Brunet–Lézine Scale is eicient to assess the neuro psychomo‑ tor development of children aged 1 to 24 months. However, by considering that strong correlations are a good level of relation‑ ship between the tests, it is observed that the Brunet–Lézine was more appropriate to assess the language of children aged between 18 and 24 months. In the other variables, when cor‑ relation was present, it was mostly moderate, which does not show the efectiveness of the evaluation of the area, since, in this study, the Bayley III Scale was considered as gold standard.
Sensitivity measures the ability of a test to properly detect individuals with a speciic disease or condition.5,9 Based on that,
high values are essential for a discriminatory test to be classiied as good, because children with developmental delay should not be left without a diagnosis. he earlier the intervention begins,
Table 4 Sensitivity, speciicity, positive and negative predictive value, and accuracy of the Brunet–Lézine Scale.
Area assessed by the Brunet‑Lézine Scale
Sensitivity (%)
Speciicity (%)
PPV (%)
NPV (%)
Accuracy (%)
Gross motor skills 10.0 96.2 25.0 89.3 86.4
Fine motor skills 20.0 95.2 20.0 95.2 90.9
Language 75.0 95.2 43.0 98.8 94.3
Social skills 13.0 96.3 25.0 91.7 88.6
REFERENCES
1. Anastasi A, Urbina S. Testagem Psicológica. 7th ed. Porto Alegre: Artes Médicas, 2000.
2. Cronbach LJ. Fundamentos da Testagem Psicológica. 5th ed. Porto Alegre: Artes Médicas, 1996.
3. Heineman KR, Hadders‑Algra M. Evaluation of neuromotor function in infancy – A systematic review of available methods. J Dev Behav Pediatr. 2008;29:315‑23.
4. Lee LL, Harris SR. Psychometric Properties and Standardization Samples of Four Screening Tests for Infants and Young Children: A Review. Pediatr Phys Ther. 2005;17:140‑7.
5. Spittle AJ, Doyle LW, Boyd RN. A systematic review of the clinimetric properties of neuromotor assessments for preterm infants during the irst year of life. Dev Med Child Neurol. 2008; 50: 254‑66.
6. Teixeira E, Sauron FN, Santos LS; Oliveira MC. Terapia Ocupacional na reabilitação física. São Paulo: Roca; 2003. 7. Connolly BH, Dalton L, Smith JB, Lamberth NG, McCay
B, Murphy W. Concurrent validity of the Bayley Scales of Infant Development II (BSID‑II) Motor Scale and the Peabody Developmental Motor Scale II (PDMS‑2) in 12 month‑old infants. Pediatr Phys Ther. 2006;18:190‑6.
the better the prognosis.3 he modiied version of the Brunet–
Lézine Scale presented low sensitivity in all areas, ranging from 10% in the ine motor area (weak), to 75% in language (reg‑ ular), which requires attention from the evaluators, adding to the evaluation a full observation of the children’s development. he Brunet–Lézine Scale showed high values of speciicity in all areas of development, that is, it identiies children without delay. he percentages of speciicity ranged between 96.3% in social skills, and 95.2% in ine motor and language areas, all with speciicity rates above recommendation.4 As to the PPV,
the Brunet–Lézine Scale showed low numbers in all areas, ranging between 20% for ine motor skills and 43% for lan‑ guage. his means that a few individuals who had actual delay were among the diagnosed ones. On the other hand, this scale showed good NPV, ranging between 89.3%, in gross motor skills, and 98.8% in language. In the language area, the Brunet– Lézine Scale had high ability to identify individuals without any alteration. It is worth mentioning that predictive values are very much inluenced by the prevalence of the event in the analyzed population, and probably did not relect completely the reality of this scale as to the predicted development. Finally, the Brunet–Lézine Scale presented acceptable accuracy percent‑ age rates in this study, ranging between 86.4% in gross motor skills, and 94.2% in language. herefore, its ability to conduct proper diagnoses, both positive and negative, was not strong. he choice of the researchers to use the Bayley III Scale as gold standard to assess the development of children, aimed at identifying more delays than its previous version, because, according to the Flynn efect,24 scales created recently should
be more strict as to the analysis of development. However, this characteristic was not observed in other studies conducted with the Bayley III Scale.13,16,18,21,25‑30 Because of that, it was
necessary to conduct a 7‑point correction of the scores in the Bayley III Scale.
On the basis of the results, it is possible to observe that the Brunet–Lézine Scale presented strong correlation as to the lan‑ guage in Group 3. his suggests that it is valid to assess chil‑ dren aged between 18 and 24 months in the language area. he Brunet–Lézine Scale showed low sensitivity and high spec‑ iicity in all areas, besides PPVs below recommendation, and NPVs above recommendation in all areas. Accuracy was within the acceptable limits. It is worth mentioning that these anal‑ yses may have been damaged by the low prevalence of delay in this sample.
After all the analyses in this study, it was possible to notice that both scales have limitations, corroborating literature, which supports the idea that there are no perfect scales to assess development among children.4,5 However, it is important to
prioritize scales that are easy to apply, with good cost–beneit, and good psychometric qualities to help the clinical judgment of the professional involved.4,5,8,12,26 he current study rein‑
forces the clear need of health professionals and researchers to use valid and reliable instruments to assess the development of children. In this sense, in case it is not possible to use the Bayley III scale in some clinical situations, the Brunet–Lézine scale can be a useful tool in the follow‑up of preterm children in the follow‑up of outpatient clinics.
his study provides clinical information to several health professionals who follow‑up preterm children, with low birth weight, concerning the use of standardized diagnostic methods that are sensitive to identiication, and propose an intervention in cases of psychomotor developmental delay.
funding
his study did not receive funding.
Conflict of interests
8. Provost B, Heimerl S, McClain C, Kim NH, Lopez BR, Kodituwakku P. Concurrent validity of the Bayley Scales of Infant Development II Motor Scale and the Peabody Developmental Motor Scales‑2 in Children with Developmental Delays. Pediatr Phys Ther. 2004;16:149‑56. 9. Pereira MG. Epidemiologia: teoria e prática. Rio de Janeiro:
Guanabara Koogan; 2008.
10. Brunet O, Lézine I. Desenvolvimento psicológico da primeira infância. Porto Alegre: Artes Médicas; 1981.
11. Souza JM. Avaliação do desenvolvimento neuropsicomotor de 6 a 24 meses matriculadas em creches municipais de Florianópolis/SC [master’s thesis]. Florianópolis (SC): UDESC; 2003.
12. Jackson BJ, Needelman H, Roberts H, Willet S, McMorris C. Bayley Scales of Infant Development Screening Test‑Gross Motor Subtest: Eicacy in Determining Need for Services. Pediatr Phys Ther. 2012;24:58‑62.
13. Anderson PJ, De Luca CR, Hutchinson E, Roberts G, Doyle LW ; Victorian Infant Collaborative Group. Underestimation of Developmental Delay by the New Bayley III Scale. Arch Pediatr Adolesc Med. 2010;164:352–6.
14. Claas MJ, Bruinse HW, Haastert IC, Peelen LM, Vries LS, Koopman C. Two‑year neurodevelopmental outcome of preterm born children < 750g at birth. Arch Dis Child Fetal Neonatal. 2011,96:169‑77.
15. Hack M. Dilemmas in the Measurement of Developmental Outcomes of Preterm Children. J Pediatr. 2011;160:537‑8. 16. Lowe JR, Erickson SJ, Schrader R, Duncan AF. Comparison of the Bayley II Mental Developmental Index and the Bayley III cognitive scale: are we measuring the same thing? Acta Pædiatr. 2012;101: e55‑8.
17. Lung F, Shu BC, Chiang T, Chen P, Lin LL. Predictive validity of Bayley scale in language development of children at 6‑36 months. Pediatrics International. 2009;51:666‑9.
18. Moore T, Johnson S, Halider S, Hennessy E, Marlow N. Relationship between test scores using the second and third editions of the Bayley Scales in extremely preterm children. J. Pediatr. 2012;160:553‑8.
19. Campos D, Santos DC, Gonçalves VM, Goto MM, Arias AV, Brianeze AC, et al. Agreement between scales for screening and diagnosis of motor development at 6 months. J Pediatr (Rio J). 2006;82:470‑4.
20. Harris SR, Megens AM, Backman CL, Hayes VE. Stability of the Bayley II Scales of Infant Development in a sample of low‑risk and high‑risk infants. Dev Med Child Neurol. 2005;47:820‑3. 21. Bayley N. Manual of Bayley Scales of Infant Development. 3th ed. San Antonio: The Psychological Corporation ; 2006. 22. Beauchemin C; Johnston JB; Lapierre ME; Aissa F; Lachaine J. Relationship between progression‑free survival overall survivl in chronic lymphocytic leukemia : a literature‑based analysis. Curr Oncol. 2015;22:e148‑56.
23. Fletcher RH, Fletcher SW. Epidemiologia clínica: elementos essenciais. 4th ed. Porto Alegre: Artmed; 2006.
24. Flynn J. Searching for justice: the discovery of IQ gains over time. Am Psychol. 1999;54:5‑20.
25. Acton BV, Biggs WSG, Creighton DE, Penner KA, Switzer HN, Thoomas JH, et al. Overestimating Neurodevelopment Using the Bayley III After Early Complex Cardiac Surgery. Pediatrics. 2011;128:e794‑800.
26. Aylward GP. Developmental Screening and Assessment: What Are We Thinking? J Dev Pediatr. 2009;30:169‑73. 27. Milne S, McDonald J, Comino EJ. The use of Bayley
Scales of Infant and Toddler Development III with clinical populations: a preliminary exploration. Phys Occup Ther Pediatr. 2012;32:24‑33.
28. Msall ME. Measuring outcomes after extreme prematurity with the Bayley III Scales of Infant and Toddler Development: a cautionary tale from Australia. Arch Pediatr Adolesc Med. 2010;164:391‑3.
29. Msall ME. The Bayley III scale underestimates developmental delay in extremely premature and extremely low birth weight infants. J. Pediatr. 2010;157:863‑4.
30. Robertson CM, Hendson L, Biggs WS, Acton BV. Application of the Flynn efect for the Bayley III scales. Arch Pediatr Adolesc Med. 2010;164:1072‑3.