TRIZ and Lean Philosophies Applied Together
in Management Activities
DOI: 10.12776/QIP.V23I3.1289
Teresa L.M. Morgado, Jorge Sandiães, Helena V.G. Navas
Received: 02 August 2019 Accepted: 22 November 2019 Published: 30 November 2019
ABSTRACT
Purpose: In the current market, the Portuguese industry faces strong competition
from countries with substantially lower operating costs. The agri-food industry is also subject to increasing competition, both nationally and internationally. The utilization of methodologies that, in addition to continuous improvement, provide the development of creative and innovative solutions may be relevant for highlighting and differentiating between organizations. In this work, Teoriya Resheniya Izobretatelskikh Zadach and Lean Philosophies have been implemented together. Methodologies as Matrix of Ideality Matrix of Contradiction, Single Minute Exchange of Die, 5S and the Substance-Field analyses were used as complementary tools to improve the production management activities of agri-food sector. Strongly focused on the issues of time wastage and the organization and management of the filling line, the implementation of these methodologies led to a reduction of setup times, of the operators’ movement and an improvement in the line’s management and organization, and improve the results of 5S audits, depending on the work station. The aims of this study is the implementation of diferent methodologies, philosophies and tools to improve management activities.
Methodology/Approach: The methodology presented in this work involves
using Lean and TRIZ methodologies together. Namely Matrix of Ideality, the Matrix of Contradictions, SMED, 5S and the Substance-Field Analysis, were used to optimize the management activities, in agro-food industrial sector. The methodology strongly focused on the issues of time wastage, organization and management of an filling line.
Findings: The implementation of methodologies led to a reduction of setup times
by 60% to 70%, a reduction of the operators’ movement during format changes by 26.2%, and an improvement in the line’s management and organization by 9% to 12%, depending on the work station.
Research Limitation/implication: In the management activities, the results are
not universal. Therefore, the same methodology applied in another industrial sector will present differents results. Nevertheless, the application of this methodology and the tools choosen only make sense if it facilitates the management of improvements.
Originality/Value of paper: There is a need and demand for innovative
solutions that lead to continuous improvement, production processes optimization and resource saving. The combination of different validated methologies, with new concrete studies, is always in scientific and technical interest and continuously sought-after (demanded, welcome) by academic and industrial sectors.
Category: Research paper
Keywords: matrix of ideality; matrix of contradictions; SMED; 5S;
substance-field analysis
1
INTRODUCTION
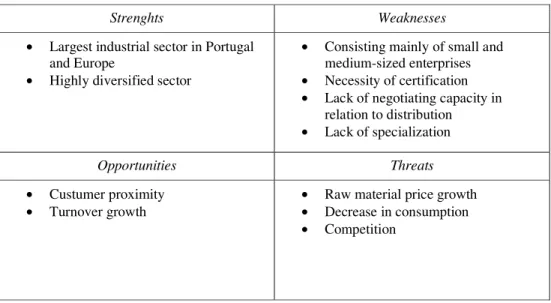
The agri-food sector is currently the largest industrial sector in Portugal and Europe, representing 16% of the manufacturing industry in Portugal. Nationally, it is composed of small and medium-sized enterprises, highly dispersed, employing about 114,000 workers, divided into about 11,180 organizations (Cruz, 2011; FIPA, 2016). In 2018, this sector had a turnover of around 16,952 million euros, an increase of around 3,000 million euros when compared to the year 2010 (FIPA, 2016). The detailed analysis of the agri-food industry is represented in Tab. 1, through a SWOT analysis (Gomes, 1990).
Table 1 – SWOT Analysis in the Agri-Food Industry
Strenghts Weaknesses
• Largest industrial sector in Portugal and Europe
• Highly diversified sector
• Consisting mainly of small and medium-sized enterprises
• Necessity of certification
• Lack of negotiating capacity in relation to distribution
• Lack of specialization
Opportunities Threats
• Custumer proximity
• Turnover growth •
Raw material price growth
• Decrease in consumption
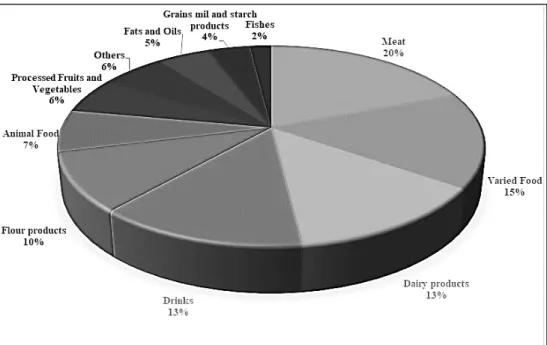
In European terms, in 2017 the agri-food industry had a turnover of around EUR 1,089 billion, employing about 4.25 million workers in about 289,000 organizations. As a highly diversified industry, its turnover is divided several specific sectors, such as dairy products, drinks, fats and oils, bakery and farinaceous products, besides others (FoodDrink, 2017). The division of turnover by all sectors at European level is shown in Fig. 1.
Figure 1 – Division of Turnover by Food Sector at European Level In this work a methodology was developed to reduce waste present in a can filling line, aided by the use of TRIZ methodologies and Lean analytical tools identifying the improvements and implementation of solutions. In this way, several activities were defined and carried out in a logical order.
1.1
Lean Philosophy
In the early twentieth century, Henry Ford introduced mass-production techniques in automobile manufacturing, by changing the standard of handicraft manufacturing into serial production. The production method has changed from small workshops with highly skilled workers into large work areas with specialized, high-cost equipment, reducing the need for manpower. Increasing the complexity of the processes resulted in a greater supply of products which, in turn, led to stock accumulation and increased process times, increasing customer response time and customer complaints. Coupled with the new industry processes implemented by Henry Ford, customer expectations grew rapidly, requiring greater final product customization, reduced process times, better quality, and lower prices. To respond to customer demands, the industry, notably the
Japanese, led by Toyota, has redesigned the rules of industrial management (Pinto, 2008).
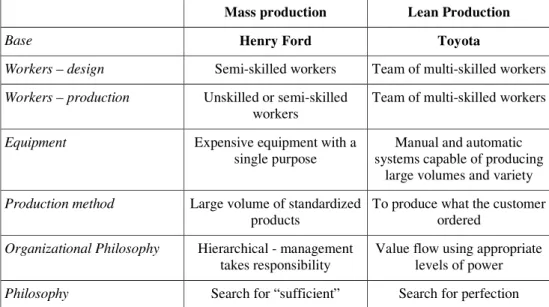
The Toyota Production Systems (TPS) originated the concept of Lean. Created in 1940 by engineer Taiichi Ohno. The TPS was developed as a philosophy oriented to the efficient satisfaction of the customer needs and expectations, based on the desire to produce through a continuous flow that did not depend on mass production to be efficient. What is currently referred to as Lean thinking is an extension of Toyota’s production system. The comparison between the mass production techniques developed by Ford and the Lean production developed by Ohno is presented in Tab. 2 (Melton, 2005).
Table 2 – Comparison between Mass Production Systems and Lean Production
Mass production Lean Production
Base Henry Ford Toyota
Workers – design Semi-skilled workers Team of multi-skilled workers Workers – production Unskilled or semi-skilled
workers Team of multi-skilled workers
Equipment Expensive equipment with a
single purpose systems capable of producing Manual and automatic large volumes and variety
Production method Large volume of standardized
products To produce what the customer ordered
Organizational Philosophy Hierarchical - management
takes responsibility Value flow using appropriate levels of power
Philosophy Search for “sufficient” Search for perfection
1.2
Triz Philosophy
The increasing need to increase quality, lower costs and, at the same time, remain competitive, leads organizations to aim for process improvements that result in efficiency gains. However, improvements in existing technology are no longer enough, and a radical increase in the resource efficiency use is needed (Flumerfelt, Kahlen and Alves, 2017). To this purpose, companies focus on innovation as a means of survival, resulting in inventions that solve problems in an efficient, effective and creative way (Savransky, 2000). It was for this purpose that Genrish Altshuller, engineer and Soviet inventor, developed the TRIZ methodology (Altshuller, 1999). TRIZ, acronym of Teoriya Resheniya Izobretatelskikh Zadach, is equivalent to Inventive Problem Solving Theory. This methodology is characterized by the use methodologies in order to generate creative ideas in the process of product development and problem solving.
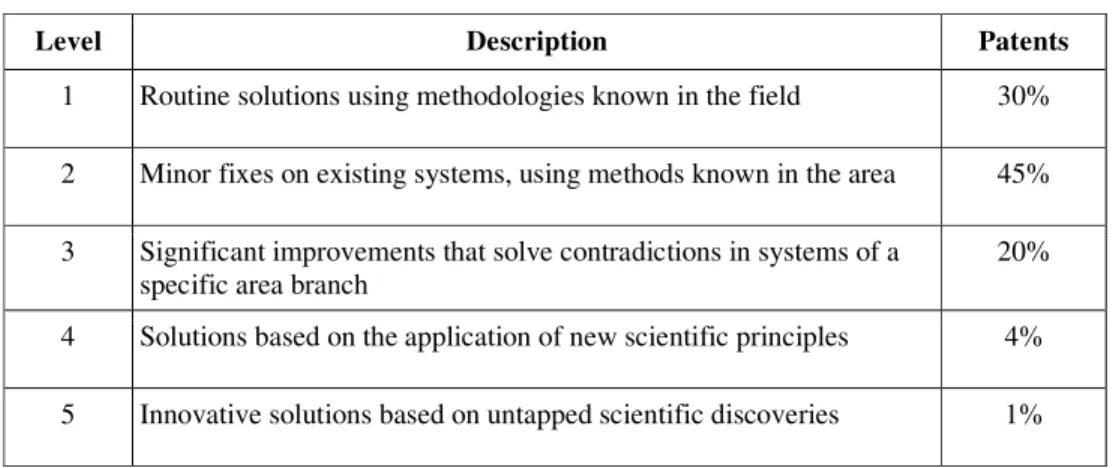
TRIZ began to be developed by Genrich Saulovich Altshuller in 1946, through the study of more than one and a half million patents {85,6 years; 8 h/day, 10 min/patent} from different areas, in order to search for alternatives to the methods of creative solutions then available. Altshuller’s analysis of the patents and the solutions described in their application revealed the existence of five inventive levels, leading to the conclusion that the inventive value of different inventions is not the same. The five inventive levels are represented in Tab. 3 (Navas, 2013).
Table 3 – Five Inventive Levels
Level Description Patents
1 Routine solutions using methodologies known in the field 30% 2 Minor fixes on existing systems, using methods known in the area 45% 3 Significant improvements that solve contradictions in systems of a
specific area branch
20% 4 Solutions based on the application of new scientific principles 4% 5 Innovative solutions based on untapped scientific discoveries 1%
Solution development may follow different procedures, depending on its inventive level (Flumerfelt, Kahlen and Alves, 2017):
• Conventional improvement of existing systems (level 1 and 2); • New procedures with existing operating principles (level 2 and 3); • Creation of a new system with new operating principles (levels 4 and 5). TRIZ has as main objective to assist in the projects of levels 3 and 4, where general engineering solutions do not produce the desired results (Navas, 2013). From Altshuller’s point of view, level 1 and level 5 projects are ignored since, respectively, they are not innovative and require a high level of knowledge (Terninko, Zusman and Zlotin, 1998).
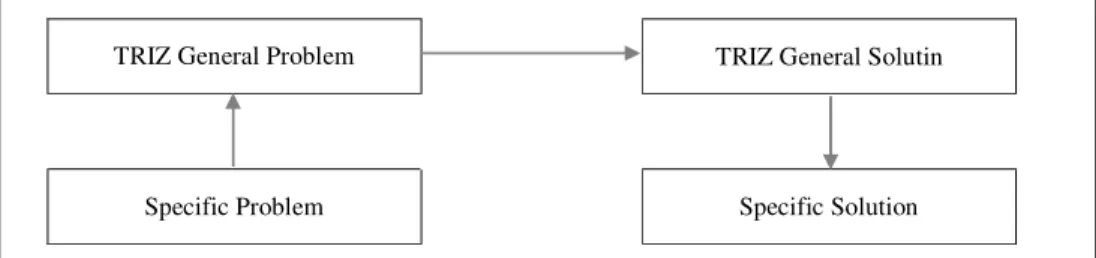
TRIZ introduced a methodology that circumvents the idea that the most significant methods for solving technical problems would be unique for each engineering area (Srinivasan and Kraslawski, 2006). This methodology, illustrated in Fig. 2, generalizes specific problems to identify examples of solutions that may be particularized into specific solutions for each problem.
TRIZ General Problem TRIZ General Solutin
Specific Problem Specific Solution
Figure 2 – TRIZ Implementation Methodology
2
METHODOLOGY
The development of this work was performed in a can filling line of 33 cl and 37.5 cl, having the filling capacity of 60,000 cans per hour. The line is composed of 9 main machines (Sandiães, 2017).
The presence of 2 types of packaging machines (Hi-Cone and OCME VEGA) and a packer (OCME TH) allows the line to be extremely versatile, allowing the production of 10 different final product formats.
The machines that make up this line are:
1. Depalletizer: puts the empty cans in the line, which are supplied in pallets of 23 rows.
2. Filler, harrower and level 1 inspector: fills the beer/coolant cans, which are then closed on the harvester and inspected at level 1 inspector.
3. Pasteurizer: heat the product to 70°C in order to eliminate microorganisms. It increases the life of the product and ensures that it is safe for consumption.
4. Daters and level 2 inspector: marks the cans with expiration date and lot. After dating, the cans go to the level 2 inspector.
5. Hi-Cone Packer: Pack the cans with Hi-Cone film.
6. VEGA OCME wrapping machine: packs cans with retractable film. 7. OCME TH Packer: packs loose packs or cans with carton and retractable
film.
8. Palletizer: palletizes the packs packaged/packaged in half-pallet and whole pallet.
9. Wrapping and labeling of pallets: involves the pallets with transparent retractable film, and these are then labeled, through the pallet labeler. The final product formats of the fill line 94 are as follows:
• 37.5cl can - Pack 24 of loose can; • 37.5cl can - Pack 24 (Pack 8 x 3);
• 33cl can- Pack 24 (Pack 6 Hi-Cone x 4); • 33cl can- Pack 24 of loose can with cardboard; • 33cl can- Pack 24 of loose can;
• 33cl can- Pack 18 with cardboard; • 33cl can- Pack 12;
• 33cl can- Pack 24 (Pack 6 x 4) with cardboard; • 33cl can- Pack 6;
• 33cl can- Pack 6 Hi-Cone.
The first phase of the study focused on the analysis of the filling process, including equipment stops, set-up times, sequence of activities performed during the various setups and all the fundamental concepts and activities associated with the can filling process in the line.
In the initial analysis a Pareto diagram was performed with the total stop times of each equipment. Defining 3 aspects to be addressed in the study to be carried out, followed the identification of the critical points to be improved (Fonseca and Domingues, 2018). In order to identify the priority parameters of the line to be developed and improved, a brainstorming was conducted with a heterogeneous group of factory workers, including the filling head, engineering chief, engineering trainees and line operators. Based on this brainstorming was built the Matrix of Ideality. The “Setups” and “Costs” were identified as the most relevant parameters for a possible improvement in the value of ideality.
In order to complement the parameters chosen in the previous step, the parameters were adapted to the Contradictions Matrix, a TRIZ tool that allows the selection of inventive and innovative principles that best suit the problems in question. From the implementation of this methodology resulted as methods of improvement the Prior Action and Continuity of Useful Action, both of which are reviewed in the application of the Lean tool, SMED – Single Minute Exchange of Die.
Prior to the application of SMED, it was necessary to carry out a prior analysis of the types of setup, due to the existence of a large amount of them. For this, the average duration times and the frequency of each were considered. Defining the 3 types of setup to be improved, the SMED methodology was implemented. To standardize the setups and reduce the variation between shifts, several operator support documents were developed, such as format change manuals, checklists, and work instructions.
Another of the points to be addressed was the organization and management of the line. For this, the Lean 5S methodology was used. Through a 5S audit and using a checklist, several critical points were identified.
In order to determine the methods for solving the identified problems, another TRIZ methodology, called Substance-Field Analysis, was used, which, through 7 general solutions, allows the development of specific solutions for each problem.
3
RESULTS AND DISCUSSION
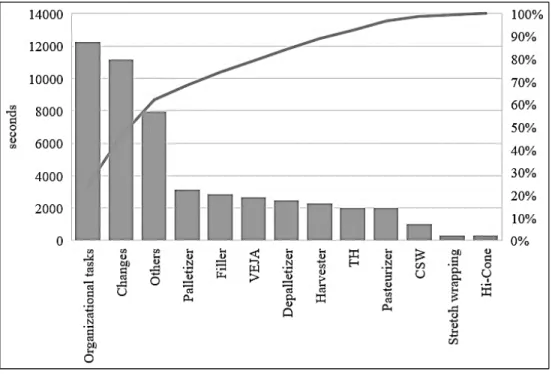
Prior to any proposed improvements, it was imperative to carry out an initial situation analysis of line stops. Based on the data collected, a Pareto diagram was developed (see Fig. 3), which allows an easy visualization of the most important problems of the filling line, leading to a prioritization of the most relevant.
Figure 3 – Pareto Diagram of the Line 94 Filling Stops
Observing the Pareto diagram (Fig. 3), it can be seen that this does not follow the rule called 80/20, where 20% of the stop types give 80% of the total stop time. In this case, 20% of the stop types originate only between 46.27% and 62.03% of downtime. From another point of view, 80% of the total stop time of the line is caused by 46.15% of the stop types.
It is noted that there is no concentration of the total stop time in a small number of stop types, so it is necessary to define a point that balances the two parameters. The following stopping causes were defined as follows: organizational tasks, which correspond to stops due to other departments, such as logistics, quality, syrup and manufacturing, and tasks related to the organization and management of the line; product/format exchanges; other stops, which represent line stops due to unspecified machines. These three types of stops make up 23% of all stopping
causes and give rise to 62% of the total stopping time. Due to the nature of the stopping type, this is, other departaments influence, the topic of organizational tasks was addressed with limitations, being restricted only to the topic of organization and management of the filling line department.
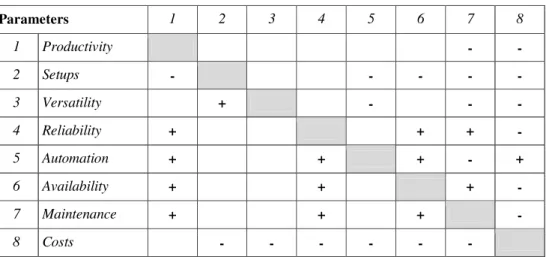
Tab. 4 presents the Matrix of Ideality that allowed the identification of interactions between requirements and distinguish positive and negative effects. Through the analysis of the Matrix of Ideality (Tab. 4) it was possible to determine the value of System Ideality through Matrix Contradictions and Engineering parameters.
Table 4 – Ideality Matrix
Parameters 1 2 3 4 5 6 7 8 1 Productivity - - 2 Setups - - - - - 3 Versatility + - - - 4 Reliability + + + - 5 Automation + + + - + 6 Availability + + + - 7 Maintenance + + + - 8 Costs - - - - - -
The engineering parameter that presented the greatest number of contradictions in the Ideality Matrix was “Time wastage”. The principles associated with the parameter “Waste of time” were identified, and it was possible to identify which of these are possible solutions to the problem in question: “Prior action” and “Continuity of a useful action”. The 2 principles are related, and can be applied together through a Lean tool, SMED. Tab. 5 shows the results obtained in the improvement of setup times after SMED application in the 3 different setups. Table 5 – Time Improvements Achieved through the SMED Application
Initial Setup [min] Final Setup [min] Improvement [%]
Product Exchange (Refrigerant) 66.1 27.0 59.1
Product Exchange (Beer) 19.7 6.0 69.5 Format Exchange (Hs Mp For P12p) 89.3 35.9 59.8
Tab. 6 shows the results obtained through the application of SMED, in the improvements related to operator movements. It is possible to observe a considerable reduction in the movements, a reduction that is directly related to a reduction in equipment downtime (see Tab. 6).
Table 6 – Improvements Related to Movements Obtained through the SMED Application Initial [m] Final [m] Improvements [%] Movements 116.8 86.2 26.2
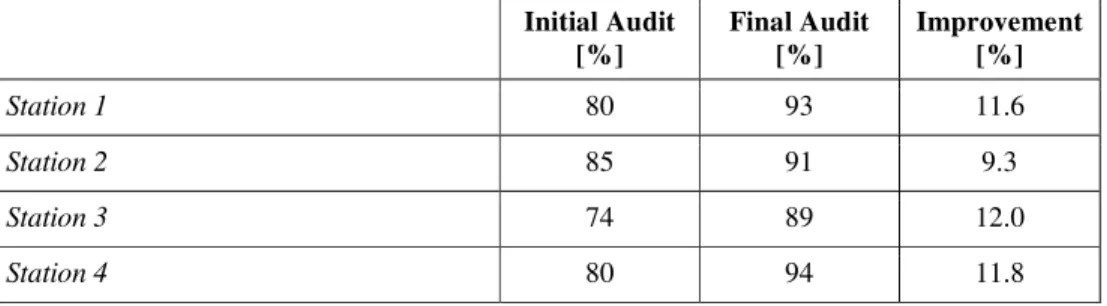
One of the focal points in the filling line was the organization and management of the work space, evidenced by the Pareto diagram shown in Fig. 3. The Lean 5S methodology was applied, which focuses on the organization of the work place and the standardization of processes, with the objective of simplifying the stations and reducing waste. For that, a checklist was prepared with elements of all 5S senses (Seiri, Seiton, Seiso, Seiketsu and Shitsuke) on a total of 20 questions and five evaluation criteria (from 0 to 4) were defined. The maximum pontuation for the checklist was 80 points which correspond to the total percentage (100%). The audits were standardized and performed before and after the implementation of the improvements. and the results are presented in Tab. 7. Table 7 – Improvements Achieved through the Implementation of 5S
Initial Audit [%] Final Audit [%] Improvement [%] Station 1 80 93 11.6 Station 2 85 91 9.3 Station 3 74 89 12.0 Station 4 80 94 11.8
4
CONCLUSIONS
From the initial analysis of the Pareto diagram, it was verified that of the equipment stop times, the ones with the greatest influence on the total standby time of the line were:
• Organizational tasks, which correspond to tasks related to the organization of the line and activities performed by others departments, external to the filling department, such as logistics and quality;
• Exchanges, which correspond to line stops resulting from changes in format and product;
• Other stops, representing stops due to failure of conveyors and machines not specified.
These three stop types give rise to 62% of the line stop time.
From the implementation of LEAN and TRIZ methodology resulted as methods of improvement the Prior Action and Continuity of Useful Action, both of which are reviewed in the application of a Lean tool, called SMED.
The SMED methodology was implemented. Following a specific methodology, 3 changes of formats were improved, obtaining reductions of setup times of 60% to 70%, depending on the setup, and reductions of the operators’ movements of 26.2%, only for the 3rd setup analyzed.
To standardize the setups and reduce the variation between shifts, several operator support documents were developed, such as format change manuals, checklists, and work instructions.
The Lean 5S methodology was used and the following solutions were obtained: • Organization of the visual management panels on the worktable of the
filler, keeping only the information essential to the proper functioning of the workstation. Organization of the worktables of the other stations of the line;
• Insertion of records of compliance in the worksheets of all the jobs; • Placement of cleaning stations along the filling line;
• Organization and labeling of the place of storage of the packaging pieces of format;
• Placement of storage shelf with circular supports in the wrapping machine.
The application of the solutions allowed an improvement in the results of 5S audits by 9% to 12%, depending on the job.
It is concluded that after the solutions were applied, it is essential to follow them, monitoring the associated parameters and maintaining the demand for continuous improvement, avoiding stagnation in terms of process improvement.
The use of Lean and TRIZ methodologies was essential for the identification and resolution of problems present in the line, promoting the reduction and elimination of waste through innovative solutions. However, the future success of the application of these tools depends on the motivation of the workers and their willingness to improve and break their routines.
It is important to note that, during the study, several difficulties and barriers to the application of the TRIZ and SMED methodologies emerged, fortified by the resistance to change by the operators and the factory manager. However, the application of these tools proved to be beneficial both in terms of productivity
and efficiency of the line as well as in motivational terms, allowing a constant evolution of trust and motivation that, in turn, has promoted an environment conducive to improvements and the argumentation of solutions to the critical problems in wokplaces.
REFERENCES
Altshuller, G., 1999. The innovation algorithm: TRIZ, systematic innovation and technical creativity. Worcester, USA: Technical Innovation Center.
Cruz, I., 2011. Portuguese Agro-food Sector. Lisbon, Portugal: Maia.
Federação das Industrias Portuguesas Agro-Alimentares (FIPA), 2016. Dados Macroeconómicos [online]. Available at: <http://www.fipa.pt/estatisticas/dados-macroeconomicos-industria-alimentar> [Accessed 25 November 2019].
Flumerfelt, S., Kahlen, F. and Alves, A., 2017. Transdisciplinary Perspectives on Complex Systems. Cham, Switzerland: Springer Internation Publishing.
Fonseca, L. and Domingues, J.P.T., 2018. The best of both words? Use of Kaizen and other continuous improvement methodologies within Portuguese ISO 9001 certified organizations. The TQM Journal, [e-journal] 30(4), pp. 321-334. 10.1108/TQM-12-2017-0173.
FoodDrink Europe, 2017. Economic Bulletin Q1 2017. [pdf] Brussels:
FoodDrinkEurope. Available at: <
https://www.fooddrinkeurope.eu/uploads/publications_documents/FoodDrinkEur ope_Economic_Bulletin_Q1_2017.pdf> [Accessed 25 November 2019].
Gomes, A., 1990. Quality in Agro-food industry [in portuguse]. Porto, Portugal: Associação Industrial Portuense.
Melton, T., 2005. The Benefits of Lean Manufacturing. Chemical Engineering Research and Design, [e-journal] 83(6), pp.662-673. 10.1205/cherd.04351. Navas, H., 2013. TRIZ: design problem solving with systematic innovation - Advances in industrial design engineering. In: D. Coelho, ed. 2013. Advances in Industrial Design Engineering. Navas: InTech. Chapter 4.
Pinto, J., 2008. Lean Thinking – Introdução ao pensamento magro [in portuguese]. s.l., Comunidade Lean Thinking.
Sandiães, J., 2017. Management and Control Activities in Canning Line. [in Portuguese]. Master degree in Mechanical Engineering. NOVA University. Available at: <http://hdl.handle.net/10362/40478> [Accessed 25 November 2019].
Srinivasan, R. and Kraslawski, A., 2006. Application of the TRIZ creativity enhancement approach to design of inherently safer chemical processes. Chemical Engineering and Processing: Process Intensification, [e-journal] 45(6), pp.507-514. 10.1016/j.cep.2005.11.009.
Terninko, J., Zusman, A. and Zlotin, B., 1998. Systematic innovation: an introduction to TRIZ (theory of inventive problem solving). EUA: Nova Iorque.
ABOUT AUTHORS
Teresa L.M. Morgado – holds a PhD in Mechanical Engineering by Instituto
Superior Técnico from Lisbon University/ Portugal, she has a master’s degree in Mechanical Engineering option of Materials and Manufacturing Processes by Faculty of Engineering from the University of Porto/Portugal. Currently, Teresa is Assistant Researcher at Scientific Instrumentation Centre in LNEC/Portugal and consolidated her position as Associate Professor on Engineering Departmental Unit of Tomar Polytechnic Institute. Teresa expertise and research interests include Industrial Management, Manufacturing Processes, Metrological Management and Durability of Mechanical Components. Author’s ORCID: 0000-0003-3294-042X.
Jorge Sandiães – received his master’s degree in Engineering and Industrial
Management from Faculty of Science and Technology – FCT, Universidade Nova de Lisboa/Portugal in 2017. His research interests include, Industrial Management, LEAN and TRIZ philosophies. Actually is working as Engineering in a private company.
Helena V.G. Navas – Assistant professor of Department of Mechanical and
Industrial Engineering, Faculty of Science and Technology, Universidade NOVA de Lisboa and Researcher in UNIDEMI – Unit for Research and Development in Mechanical and Industrial Engineering. She is the representative of Portuguese Association for Quality (APQ) in the Technical Standardization Committee on Research Activities, Development and Innovation (RDI). She is a consultant and trainer in Innovation, Systematic Innovation and TRIZ. Author’s ORCID: 0000-003-4637-0755.
Conflicts of Interest: The authors declare no conflict of interest.
© 2019 by the authors. Submitted for possible open access publication under the terms and conditions of the Creative Commons Attribution (CC-BY) license (http://creativecommons.org/licenses/by/4.0/).