Universidade de Brasília
Instituto de Ciências ExatasDepartamento de Ciência da Computação
Feature-Trace: An Approach to Generate
Operational Profile and to Support Regression
Testing from BDD Features
Rafael Fazzolino P. Barbosa
Dissertação apresentada como requisito parcial para conclusão do Mestrado em Informática
Orientadora
Prof.a Dr.a Genaína Nunes Rodrigues
Brasília
2020
Universidade de Brasília
Instituto de Ciências ExatasDepartamento de Ciência da Computação
Feature-Trace: An Approach to Generate
Operational Profile and to Support Regression
Testing from BDD Features
Rafael Fazzolino P. Barbosa
Dissertação apresentada como requisito parcial para conclusão do Mestrado em Informática
Prof.a Dr.a Genaína Nunes Rodrigues (Orientadora) CIC/UnB
Prof. Dr. Rodrigo Bonifácio Dr. Breno Miranda
University of Brasilia Federal University of Pernambuco
Prof. Dr. Bruno Luiggi Macchiavello Espinoza
Coordenador do Programa de Pós-graduação em Informática
Acknowledgements
First of all, I thank my mother, Monica Fazzolino Pinto, for all the support and under-standing during my walk here. To my family as a whole, especially my girlfriend Letícia, who endured and supported me in all difficult times during this phase of my life, and to all my friends who also supported me. I also thank the University of Brasilia as a whole, which today I see as a second mother, despite many difficult moments, I can only be grateful.
I want to highlight a special thanks to my advisor, Genaína Nunes Rodrigues, who introduced me to the world of academia, guiding my steps during each activity over the years that we have worked together, both in research projects and in master’s activities. I am very grateful for the patience and understanding during difficult times that we have spent in these years. I am pleased to have worked with such a good teacher, both as a researcher and as a person.
Abstract
Operational Profiles provide quantitative information about how the software will be used, which supports highlighting those software components more sensitive to reliability based on their profile usage. However, the generation of Operational Profiles usually requires a considerable team effort to liaise requirements specification until their reification into ex-pected software artifacts. In this sense, it becomes paramount in the software life cycle the ability to seamlessly or efficiently perform traceability from requirement to code, embrac-ing the testembrac-ing process as a means to ensure that the requirements are satisfiably covered and addressed. In this work, we propose the Feature-Trace approach which merges the advantages of the Operational Profile and the benefits of the requirements-to-code trace-ability present in the BDD (Behavior-Driven Development) approach. The primary goal of our work is to use the BDD approach as an information source for the semi-automated generation of the Operational Profile, but it also aims to extract several other metrics re-lated to the process of prioritizing and selecting test cases, such as the Program Spectrum and Code Complexity metrics. The proposed approach was evaluated on the Diaspora software, on a GitHub open source software, which contains 68 BDD features, specified in 267 scenarios and ≈ 72 KLOC and more than 2,900 forks and counting. The case study revealed that the Feature-Trace approach is capable of extracting the operational profile seamlessly from the specified Diaspora’s BDD features as well as obtaining and presenting vital information to guide the process of test cases prioritization. The approach was also assessed based on feedback from 18 developers who had access to the approach and tool proposed in this work — making evident the usefulness of the Feature-Trace for activities of “Prioritization and Selection of Test Cases”, “Evaluation of the quality of test cases” and “Maintenance and Software Evolution”.
Contents
1 Introduction 1
1.1 Team Challenges Throughout the Software Lifecycle . . . 1
1.1.1 Software Verification and Validation Context . . . 2
1.2 Research Problem . . . 4
1.3 Research Contribution . . . 5
1.4 Organization . . . 6
2 Background 7 2.1 Software Verification and Validation . . . 7
2.1.1 Coverage Metrics . . . 9
2.1.2 Regression Testing . . . 10
2.2 Operational Profile . . . 11
2.3 Behavior Driven Development . . . 14
2.4 Program Spectrum . . . 19
3 The Feature-Trace Approach 22 3.1 The Automated Runtime Module . . . 23
3.1.1 Operational Profile Entities . . . 25
3.2 The Analyser Module . . . 26
3.3 The Visualizer Module . . . 30
3.4 Development Architecture . . . 31
3.4.1 Automated Runtime Module . . . 31
3.4.2 Analyser and Visualizer Modules . . . 34
3.5 Costs Involved . . . 35
4 Case Study 36 4.1 Evaluation Step 1 . . . 37
4.1.1 Systems Under Test . . . 37
4.1.2 Experimental Setup . . . 37
4.2 Evaluation Step 2 . . . 41
4.2.1 Data Analysis . . . 44
4.3 Discussion . . . 47
4.4 Threats to Validity . . . 50
5 Related Work 52
6 Conclusion and Future Work 55
List of Figures
2.1 Operational Profile composition [1]. . . . 12
2.2 Sample of .feature file [2]. . . . 17
2.3 Execution path. . . 20
3.1 Feature-Trace Architecture. . . 23
3.2 Map of Features, Scenarios and Methods. . . . 28
3.3 ARM Architecture. . . 31
3.4 ARM Models Architecture. . . 33
3.5 ARM Folders. . . 34
4.1 Global view of the feature “preview posts in the stream”. . . . 40
4.2 Traceability perspective of method “person_image_link”. . . . 41
4.3 Participant perception of the quality of the existing test case set (Before and After using Feature-Trace). . . . 45
List of Tables
2.1 Frameworks that support the BDD approach. . . 18
3.1 Operational Profile from BDD artifacts. . . 25
4.1 Methods information obtained with Feature-Trace. . . 38
4.2 Example of the OP distribution. . . 39
Chapter 1
Introduction
It is well known that the software development process is not limited to development activities, just generating a product and delivering it to the customer. The software product should be considered as something that continually evolves and adapts from the requirements elicitation step, starting the software product, to the maintenance and evolution of the software product, which we call the software life cycle. [3].
Throughout the life cycle, we find several challenges that can harm the result, gen-erating a product with many failures or even failing to complete a deliverable artifact. Thus, techniques and approaches that facilitate the management and monitoring of the software development, maintenance, and testing process are being discussed and applied by the computing community around the world, as noticeable in [4, 5, 6].
1.1
Team Challenges Throughout the Software
Life-cycle
The software lifecycle involves several challenges that need to be overcome by the team for the product to be delivered, maintained, and evolved successfully. The challenges start from the first stage of the process, in the requirements elicitation phase, to the last stage, in the software maintenance and evolution phase. The causes of the problems can vary widely. According to [7], most of such problems are the result of human errors during the development process. Thus, the software lifecycle is subject to the inclusion of failures at all times, even in experienced and skilled teams.
Because failure inclusion can occur at any time during the software lifecycle, the project team must carefully manage and monitor the evolution of the source code, seeking to know the software product as a whole. [8]. When we speak of “knowing” the software product, we refer to the relationships between each product level, from the requirements,
the source code that implements these requirements, and the test cases that verify the operation of this source code based on the requirements. From these relationships, one can track certain software functionality at different levels: requirements, source code, and test cases. In addition, it is essential to know how the end-user will use the delivered software product, making it possible to distinguish, among the software entities, the degree of business importance to the customer [1].
Software product traceability might benefit the entire software lifecycle [9]. This is particularly important in the software validation and verification activities.
1.1.1
Software Verification and Validation Context
The activities of Verification and Validation identify failures so that they are corrected before the delivery of the system. According to [10], Verification and Validation activities must occur during the entire system development cycle, seeking to identify failures as soon as possible, saving time and money. These activities are usually automated from the implementation of test cases, making it possible to generate, for example, regression test suites that can check the software whenever a new change is made [8].
Test cases are usually classified in white- and black-box testing, where the first is more related to the activity of Software Verification, also known as structural testing. On the other hand, the black-box tests seek to validate the software product, that is, check if the software meets the requirements elicited [10].
Given the notorious challenge regarding the verification and validation of software completeness through test cases [11], it is paramount to delimit a relevant set of test cases that guarantees the highest possible reliability within the limitations of the software development team [8]. Aiming at this goal, several techniques for prioritizing test cases have been proposed, related to the prioritization of either white- or black-box testing or both [12]. The prioritization process of test cases can occur from several strategies. These strategies use the data from the system under test (SUT) to define the prioritization criteria of test cases, such as the complexity of code units (effort to test that unit) [13], Operational Profile (OP) information [1], history of failures [14] and similarity of the test cases [15], among others [11]. Overall, these strategies focus mostly on software verification and validation activities, which seek to ensure that the software is being developed in the right way and that the correct software is being developed, respectively [8].
In particular, many techniques are based on concepts such as OP, which takes into account the probability of execution of each entity of the software to provide quantitative information about how the software will be used [16]. There are several advantages of using the OP in the software development cycle: (1) to reduce costs with operations with little impact on system reliability; (2) to maximize the speed of development, from the
proper allocation of resources, taking into account the usage and the criticality of the operations; (3) to guide effort distribution in requirements, code, and design revisions, and (4) to make testing more efficient (greater slope in system reliability growth rate). However, there are several limitations that often render impractical the use of the OP in the software development cycle. The effort and the complexity involved in generating the OP are considerably high as well as the tendency to the stability of the reliability growth during the process of prioritizing test cases. That is, after a certain number of test cycles, the growth rate of reliability tends to be stable due to the non-prioritization of units that have a low probability of occurrence. [17].
It is worth noting that the quality of software products involves not only the quality of the source code but also the quality of other software artifacts, e.g. requirements specification and tests suites, and the traceability between such artifacts [9]. Moreover, the success of software testing activity is directly connected to the correct alignment between requirements and test cases [18]. The lack of traceability between artifacts can lead a software project to complete failure [9]. Communication between requirements engineers and test engineers is often compromised by dealing with abstraction levels, languages and entirely unconnected complexities [9]. Thus, several studies have proposed strategies and techniques for locating requirements in the source code [19, 20, 21, 22, 23]. Some approaches have emerged to bring the requirements artifacts closer together and Verification and Validation. In this sense, it is worth highlighting the methodologies of agile development, which have sought to minimize the gap between the Requirements activities and the Verification and Validation software activities [24]. Some practices of the agile development process deserve to be highlighted when we refer to the gap between the activities of Requirements Elicitation and Verification and Validation, such as:
• Face-to-face communication
• Customer involvement and interaction • User stories
• Change management
• Review meetings and acceptance tests
Among the approaches used to minimize this gap and which are gaining notoriety is the Behavior Driven Development (BDD) [25]. In BDD, system requirements and test cases merge into the same artifact, making the requirement automatically verifiable and enabling a familiar interface among all stakeholders in the software project. The approach uses a ubiquitous language for writing artifacts in the form of user stories. However, the adoption of the BDD approach also involves some challenges, such as (i) poorly written
scenarios, i.e. scenarios lacking comprehensive requirements representation, which may render the test assurance process weak and (ii) difficulty in convincing the stakeholders to use BDD, since it requires a paradigm shift from the stakeholders to specify the features in BDD language [26]. Moreover, BDD artifacts do not provide quantitative information to support test case prioritization, unlike OP.
1.2
Research Problem
Taking into consideration the context presented above, it is observed the importance of methodologies, techniques, and approaches that facilitate the process of quality assurance of the software product developed throughout its life cycle. Several strategies have been analyzed and used by the computing community worldwide. The software community also often uses various metrics, tools, and approaches to improve the development process, with OP and BDD being essential examples in this context, and may also cite data regarding the complexity of the source code.
In this sense, there is a need to centralize some of these techniques in such a way as to enable a debate between those involved, with access to relevant information from each software product entity, as well as traceability between software artifacts. Thus, we highlight as the main problem attacked in this research: The difficulty in obtaining
and cross-referencing software artifact information to enable the distribution of product knowledge as a whole, from overall traceability to metrics for each product entity. By
enabling knowledge about software artifacts among all involved, we allow debates about the importance of each method, requirement, or test case. With this, the process of prioritization and selection of test cases becomes a joint activity in which all participants can analyze the context from various points of view, enriching the debate and thereby enhancing the process of Verification and Validation. Also enriching all other activities involved in the software life cycle.
As a result, we come to the following research question:
Can BDD artifacts be used to generate the OP and guide a prioritization and selection testing process?
There are several limitations that often render impractical the use of the OP in the software development cycle. The effort and the complexity involved in generating the OP are considerably high as well as the tendency to the stability of the reliability growth during the process of prioritizing test cases. That is, after a certain number of test cycles, the growth rate of reliability tends to be stable due to the non-prioritization of units that have a low probability of occurrence [17]. Moreover, the success of software
testing activity is directly connected to the correct alignment between requirements and test cases [18]. The lack of traceability between artifacts can lead a software project to complete failure [9]. Communication between requirements engineers and test engineers is often compromised by dealing with abstraction levels, languages and entirely unconnected complexities [9].
1.3
Research Contribution
Given the gaps and difficulties presented to ensure the traceability between requirements and software testing, the lack of an approach that provides a solid way of applying the concepts inherent to the OP, and the difficulty in crossing some metrics that support the prioritization and selection of test cases, we propose the Feature-Trace approach.
To this end, we come to the following contributions of this work:
1. A literature review on quality assurance activities throughout the software life cycle, with a primary focus on prioritization and selection of test cases;
2. A test case prioritization and selection approach that utilizes a variety of information extracted from source code. With that, allow the prioritization and selection of test cases;
3. A framework to extract the necessary data and present the full set of information, enabling the use of the proposed approach in work;
4. A case study seeking to identify the behavior of teams using the information pre-sented by the Feature-Trace framework during the process of prioritization and selection of test cases;
5. Analysis and reporting the outcome of the case study, sharing the knowledge gen-erated with the worldwide software engineering community (this work and [27]). Our Feature-Trace approach facilitates the understanding of the software product from the perspective of the tested requirements as BDD artifacts and their attributed relevance. Then, leveraged by the construction of the OP from the BDD artifacts, Feature-Trace enables the traceability, testability and quantitative measure of importance from the requirements to the code units and their corresponding test cases. By these means, from the BDD artifacts and the SUT source code, relevant information is seamlessly extracted to guide the software testing process.
The proposed approach was evaluated on the Diaspora social network software, an open source project, which contains 68 BDD features, specified in 267 scenarios. Diaspora
has approximately 72 thousand lines, with 2,915 forks and 12,226 stars in its repository in Github1. The case study revealed that the Feature-Trace approach is capable of extracting
the OP as well as obtaining and presenting vital information to guide the prioritization process of test cases. Also, a study with 18 participants was carried out to analyze the feedback of these participants on the usefulness of using the approach and Feature-Trace tool. It was observed, as presented in Chapter 4, that, according to the participants, the proposed approach has a high degree of utility in the questions “Prioritization/Selection of test cases”, “support in activities of Software Maintenance and Evolution” and the “ability to represent the current situation of test cases”.
In a nutshell, the contributions of this work are:
1. An approach that allows for: (1) the creation of OP seamlessly stemmed from well-formed, executable and traceable requirements and (2) the prioritization of software testing based on the created OP as well as on a set of quantitative SUT information, i.e, program spectrum, number of impacted software features and code complexity. 2. A tool that automates the proposed approach, allowing the application of the ap-proach without great effort by the testing team primarily based on the BDD sce-narios specifications, source code implementation and test suite.
3. A case study on the Diaspora social network as a GitHub open project that shows the applicability and the potential of our approach.
4. A case study with eighteen developers that used the tool and shared some of the perceptions gained by each participant.
1.4
Organization
The remaining sections are organized as follows: Chapter 2 presents key background concepts. Chapter 3 provides an in-depth perspective of our Feature-Trace approach and tool. Chapter 4 presents the diaspora case study and the perceptions of each developer who used our tool and approach to prioritize and select test cases. Chapter 5 compares our approach to the most related work. Finally Chapter 6 concludes the work with some discussions, lessons learned and outlines future works.
Chapter 2
Background
In this chapter, the concepts necessary to understand this work are presented. Initially, the Verification and Validation context is discussed, as well as some coverage metrics. Then we present the concepts of Operational Profile and Behavior Driven Development, as well as a brief presentation of the Program Spectrum concept.
2.1
Software Verification and Validation
According to [28], “Validation of software or, more generally, verification and validation
(V&V), intends to show that software conforms to its specifications while satisfying spec-ifications of the system client.”. In this way, the Software Verification and Validation
process contribute directly to a successful project, which makes this activity so important in the software development process.
The concept of Verification and Validation is linked to the questions: (1) “Am I
building the system correctly?” (verification) and (2) “Am I building the correct system?”
(validation) [29]. One of the main reasons for unsuccessful software delivery involves these two issues since often the customer himself does not know exactly what he expects from the required software product. In addition to this problem, one must also consider the way the software is being implemented, taking into account the quality of the generated code, using metrics such as Cyclomatic Complexity, readability, maintainability, and testability, for example. Concerns such as these are part of the Software Verification and Validation process (V&V).
The primary strategy used to maximize the efficiency of this activity is the implemen-tation of automated test cases, guaranteeing the suitability of the system to the require-ments established with the client, as well as guaranteeing specific criteria of verification of generated code [29].
In order to measure the quality of the tests, which encompass a large part of the Verification and Validation process of the system, several techniques and metrics are used. The following is the Regression Test activity, highlighting the main approaches that seek to minimize the effort of this activity.
[29] states that the main strategy used to maximize the efficiency of this activity is the implementation of automated test cases, ensuring the adequacy of the system to the requirements established with the client, in addition to guaranteeing certain criteria for verifying the generated code. According to the author, tests can be classified into the following categories:
• Unit Testing:
Responsible for ensuring the operation of each unit of the system. • Integration Test:
Responsible for ensuring the functioning of each module of the system, checking the interface between the units of the system.
• Acceptance Test:
Responsible for ensuring the correct functioning of the requirements specified with the customer. It is considered a type of black box test.
• System test:
Responsible for ensuring the operation of the system in its real context, that is, taking into account the hardware used to run the system. It is also considered a black box test.
Due to the great importance of the V&V activity, several strategies and techniques have been raised seeking to maximize the efficiency of this activity, as shown by [18], where it analyzes verification and validation strategies in six large companies. The main challenge analyzed in the study involves the concept of traceability between requirements and the system validation process, since, according to the author, the lack of traceability between requirements and V&V can generate serious problems related to deadlines and quality of deliverable.
The issue of traceability between requirements and test cases is attacked by the
Behavior-Driven Development approach, as shown by [30]. This approach is used in
this research in order to minimize the gap between the requirements of the system and its verification and validation process, minimizing several problems such as those previously presented.
Seeking to measure the quality of the tests, which covers a large part of the system’s Verification and Validation process, several metrics are used to measure test coverage. Some of these metrics are described in the following section.
2.1.1
Coverage Metrics
The main purpose of testing coverage is to ensure that each requirement is being tested at least once, in this case making reference to black box tests. According to [31], a set of black-box tests can generate low coverage according to some criteria 1) If there are implicit or unspecified requirements; 2) In the existence of code not derived from the requirements or; 3) When the set of test cases derived from the requirements is inadequate. Problems like these can be solved with the traceability between requirements and test cases, as in the strategy used by the BDD [32] approach. The main coverage metrics surveyed by [17] are:
• Functional Coverage: According to [33], Functional Coverage can be defined as the criterion responsible for ensuring that all system functions (or methods) were exercised during the execution of the test case set. The coverage obtained refers to the percentage of functions/methods exercised in relation to the total number of functions/methods in the system.
• Branch Coverage: The coverage criterion of branches seeks to ensure that all code flow control points are exercised during the execution of the test cases [34]. Ac-cording to [35], the branch coverage criterion is a more impacting criterion than the
Statement Coverage, since if all branches of the system are exercised, necessarily all
the system declarations will also be executed, that is, if a set of test cases meets the criteria of Branch Coverage, this same set it also meets the Statement Coverage criterion.
• Statement Coverage: According to [34], the statement coverage is the basic criterion for analyzing system test coverage. However, it is a metric quite used and accepted by the community in general, defined by the ANSI American National Standards
Institute. This coverage criterion takes into account the execution of each statement
throughout the system code, that is, verifying which statements were executed by the set of test cases, following a strategy very similar to the last two coverage criteria. • Operational Coverage: The concept of Operational Coverage was proposed by [36], looking for a coverage criterion that fits as a stop rule in the test process based on the Operational Profile of the system. This strategy takes into account the fact
that certain failures have a greater impact on system reliability than other failures, according to the Operational Profile in question [16].
The definition of Operational Coverage takes into account the frequency of use of each entity based on the concept of Program Spectrum [37], distributing each entity in the system into groups of importance, to which they are assigned weights, as suggested by [36]. The assignments are made in such a way that, the greater the frequency of use of the entity, the greater the weight of the group to which it belongs, making clear the degree of impact on the system’s reliability. The value of the Operational Coverage (OC) of the system is obtained from the Equation (2.1).
OC = n X i=1 xiwi (2.1) where,
n = number of importance groups used; xi = rate of entities covered in the group i;
wi = group weight i.
2.1.2
Regression Testing
During the process of development, maintenance and evolution of software, a test suite needs to be maintained and evolved, allowing the execution of test cases whenever changes are made in the source code, guaranteeing the correctness of the features and avoiding the inclusion of defects in the software. This type of test is called the Regression Test and may involve some difficulties over time. According to [11], regression testing can be a costly and slow activity, taking days or even weeks to run, depending on the size of the test suite in question.
In order to minimize the effort involved in the regression test activity, [38] highlights three main approaches: (1) test suite minimization, (2) test case selection, and (3) test case prioritization.
• Test Suite Minimization (TSM) Seeks to remove redundant test cases to reduce the size of the test suite, and thereby minimize the time required for its execution. It also tends to reduce the ability of the test suite to identify defects in the software [38]. In this way, the reduction of the test suite should be performed with care to avoid the removal of important test cases.
• Test Case Selection (TCS) Selects a particular subset of test cases that is most likely to identify a new defect in the software. Generally, the set of test cases selected is composed of test cases that exercise the modified source units during the last modification of the software. It has a similar strategy to the test suite minimization, that executes only a subset of the test suite. However, the non-executed test cases are not removed from the test suite, waiting for the moment when they will be selected in a future execution.
• Test Case Prioritization (TCP) Seeks to order the execution of the test cases in such a way as to maximize certain properties, such as the failure identification rate. Thus, with the prioritization of test cases, it is expected that the most critical test cases are performed first.
The three approaches outlined above use a variety of techniques and strategies, based on source code metrics, test histories, software requirements, and more [11]. A well-known metric that can be used as a criterion for the three approaches is the Operational Profile concept, which will be presented in Section 2.2.
2.2
Operational Profile
The Operational Profile aims to quantify the probability of occurrence of each entity of the software, making it possible to obtain the importance of each entity when it refers to the impact on the reliability of the software [16].
Figure 2.1 presents the composition of the Operational Profile according to Musa [1]. The author defines a detailed process for creating the Operational Profile, containing the topics presented in Figure 2.1, which may include one or more of the following steps: 1. Define the Customer Profile It is the profile of an individual, group, or organiza-tion that is acquiring the software, being represented by an independent vector of types. Each customer type encompasses clients who similarly use the system. It is defined as a set of pairs “customer type/probability", making clear the relationship of importance between each type of customer, when referring to the reliability of the delivered system.
2. Define the User Profile It is the profile of a person, group, or institution that operates the system, and can be grouped into types of users. Likewise, a User profile is defined as a set of pairs “user type/probability".
3. Define the System-mode Profile Several software systems have distinct modes of operation, modifying the flow of execution as a whole. The system-mode profile
Figure 2.1: Operational Profile composition [1].
tries to map the degree of importance of each mode of operation of the system in relation to the reliability of the system. Software that can be executed in both graphics mode and batch mode, for example, has two system-mode profiles: 1) batch mode and 2) graphic mode.
4. Define the Functional Profile Represents the use profile of features that an external entity, such as a user, can perform on the system. The functionalities are established during the elicitation of the requirements, thus, obtaining the functionalities should be a simple activity of reading the system requirements, considering, of course, that the requirements are reliable and represent the system as a whole.
The functional profile can be either explicit or implicit, depending on the rep-resentation of the possible inputs present in this functionality, called key-input
variable. This distinction is required because of the behavior of the feature
ac-cording to each input value range received. Depending on the functionality, the execution path of the system can be modified according to the input value, demon-strating a distinct behavior, that is, requiring an isolated treatment in obtaining the functional profile.
The explicit profile requires the specification of each range (also called the level) of each variable of the functionality in question, requiring a significant effort and obtaining a higher number of elements for Operational Profile mapping. On the
other hand, the implicit profile is specified in subprofiles of each key variable. That is, each range is related to its probability within its subprofile. In the explicit profile, the number of elements is equal to the product of the number of levels per variable, while in the implicit profile the number of elements is similar to the sum of the number of levels with the number of variables present.
To create the Functional Profile, [1] suggests the following order of activities: (a) Generate an initial list of functions: This list can be easily obtained from
the analysis of system requirements. If the requirements are superficial, this information can be obtained from the project stakeholders.
(b) Raise Environment Variables: It characterizes conditions that influence the execution path of the system within the same functionality.
(c) Define final list of functions: The final list (FL) of functions consists of the functionalities and their own environment variables, for each function that occurs in the system. The number of functionalities/variables is calculated from equation (2.2).
F L = (n × l) − (¯n × ¯l) (2.2) where,
n = number of functions in the initial list;
l = total number of levels of all environment variables;
¯
n and ¯l = combination of functions and environment variables that do not
occur, respectively.
(d) Distribute probabilities: The distribution of probabilities can be done in several ways. However, it is known that the ideal context is the distribution be made from the analysis of data of the use of the system in a production environment, or of a system similar to this one. However, access to this infor-mation is often not feasible for a variety of reasons. In situations where it is not possible to obtain historical data on the use of the system, it is possible to estimate the functional profile, from the interaction with users and experts in the business context that the system will be enveloped.
5. Define the Operational Profile
While the Functional Profile is a representation of the capabilities of the system from a user’s point of view, the Operational Profile is a representation from the
developers’ point of view. In this way, the operations present a clearer vision for who will implement the system tests. According to [1], the list of operations can be extracted from the Functional Profile, defining a one-to-many relationship between features and operations.
According to [1], the number of operations resulting from the Operational Profile creation process can reach a very high value, rendering the test process unfeasible. Thus, the author suggests the reduction of some of the elements detailed above, according to the analysis of the expert involved in the process of creating the OP.
Among the main advantages of using the Operational Profile are:
• Reduce costs with operations with little impact on software reliability; • Guide effort distribution into requirements, code and design reviews;
• Make testing more efficient (greater slope in the growth rate of system reliability); • Make management more accurate;
• Guide the creation of user manual and training documentation.
2.3
Behavior Driven Development
The BDD approach is a derivation of the concepts of TDD (Test Driven Development) [39] and DDD (Domain Driven Design) [40], including an easy-to-understand language that enables all stakeholders to understand and collaborate with the writing of the requirements of the software.
Among the ubiquitous language formats used by the BDD approach, we highlight
Gherkin1, which has a set of syntactic rules that allow the writing of scenarios of use
that can be mapped to source code methods and executed automatically to validate their behavior, with the support of the appropriate tool.
Each feature is detailed in a .feature file, and may have one or more use scenarios of the feature. Listing 2.1 illustrates the reserved words and meta-defined steps of a BDD scenario.
Listing 2.1: Specification of a BDD feature in the Gherkin language
Feature : feature d e s c r i p t i o n
Background : Common s t e p s Scenario : Some u s a g e scenario
Given some p r e c o n d i t i o n And some o t h e r p r e c o n d i t i o n s When some a c t i o n o c c u r s And some o t h e r a c t i o n o c c u r s And y e t a n o t h e r a c t i o n
Then some t e s t a b l e outcome i s o b t a i n e d And s o m e t h i n g e l s e t h a t we can c h e c k
The items below present the definition of the keywords related to this section:
• Feature: provides a high-level description of a system’s functionality and groups related scenarios.
• Language: defines the language used in the artifacts.
The Gherkin format is already used in several languages around the world. Thus, this keyword allows the tool responsible for extracting the information present in the file to identify which language was used to describe the scenarios and features of the system.
• Scenario or Example: describe a system usage scenario.
These words are synonyms, illustrate a specific business rule and are composed of
steps, which allows them to describe a usage scenario, as well as the expected result
with the execution of that scenario. In this way, each scenario represents executable documentation for a system business rule.
• Scenario Outline or Scenario Template: allows the definition of usage scenarios with different inputs.
These keywords are used to create scenarios with more than one example of
in-put. Using n examples, the scenario will be executed n times, once for each input
registered. The listing of inputs is done with the keyword Examples.
• Background: defines a prerequisite for the execution of the usage scenarios.
This keyword is used to register a specific execution context within the feature. Thus, background has one or more Given steps, being executed once before the execution of each scenario registered in this feature.
• Examples: It allows the creation of a table of examples, where each column rep-resents a variable and each row reprep-resents a value. It is a concept quite used for
repetitive execution of the same scenario, replacing only the inputs of the scenario at each execution.
• Steps: defines the necessary steps to execute a given usage scenario. This keyword has some keywords related to it, such as Given to define the initial state of the scenario, When to define an action in the system and Then to describe the expected result after action. Seeking the fluidity of usage scenarios, we have the keywords
And and But, which have the same meaning as the same keyword used in the past step.
– Given:
It is used to define the initial state of scenario. The purpose of its use is to leave the system in a known state for the execution of the desired test case.
– When:
It is used to describe an action on the system, which means the interaction of a third party (a user or another system) on the system under test. Generally, each scenario has only one When, defining the main action of the scenario to be tested.
– Then:
It is used to describe the output expected from the execution of the previous
step. This step represents the assert that checks if the output obtained is
equivalent to the expected output, concluding the test case.
– And e But:
They are responsible for preventing the writing of many Given, When and
Then and serve as synonyms for the step before them.
The Figure 2.2 shows some example of a .feature file, which is usually a common file that stores feature, scenarios, and feature description to be tested. The feature file is an entry point, to write the cucumber tests and used as a live document at the time of testing.
The use of the Gherkin language allows the mapping of each step to an executable test method. Thus, each scenario represents a set of test methods that will be executed in the order defined for completion of each use scenario [41]. Using this approach, feature-to-code traceability can be obtained automatically, since the system requirements become an executable and verifiable entity. However, an entity that has only a partial view of the system since the view of the system in this approach is seen as a set of isolated features.
Figure 2.2: Sample of .feature file [2].
• Ubiquitous Language: It is the core concept of the BDD approach. The language structure is derived from the business context, that is, it uses terms that are com-monly used by stakeholders to record the behavior of the system, avoiding ambigu-ities.
• Iterative Decomposition Process: A collaborative and incremental process, gener-ating features and their respective scenarios over time, with the participation of all stakeholders.
• Standardized Textual Descriptions: Defining features in a standardized manner, facilitating the understanding of what should be implemented in the system, and adding the benefit of automating the usage scenarios, making each scenario represent a set of executable test methods while maintaining an easy-to-understand structure for any stakeholder.
• Automated Acceptance Tests: The set of features and scenarios of a system, in the BDD approach, are both the system requirement and the executable test cases of
the system. In this way, an automated executable specification is obtained.
• Code-oriented Specification: Like the test, the code is also the system documen-tation itself, in the BDD approach. In this way, the elements of the code should represent the expected behavior, just as they should use the same terms defined according to the ubiquitous language of the project.
• Influence in several stages of development: The BDD approach is present in several stages of development, such as in the planning phase (business behavior), analysis (definition of features and scenarios), implementation and evolution of software. Thus, the developer is bound to think about the behavior of the component being developed.
Several tools and frameworks support the BDD approach for the most varied technolo-gies and contexts. For the realization of this research, the main technolotechnolo-gies to support the BDD approach were raised, as can be seen in Table ref tab: frameworks. To identify the relevance of the tool in the development community, the quantities of stars and forks were analyzed in their GitHub repositories. It is worth mentioning that in cases where the tool is distributed in more than one repository, its numbering of stars and forks have been added, in order to obtain the complete view of the tool, including all the modules.
Tool Supported
Language Stars Forks
SpecFlow2 .NET 1330 580
Jasmine3 JavaScript, Python, Ruby 14770 2610
Concordion4 Java 158 60 Behat5 PHP 3260 963 Behave6 Python 1571 418 Lettuce7 Python 1161 314 Codeception8 PHP, JS 5600 1676 Jbehave9 Java 256 247
Cucumber10 Java, Ruby, Python, JS 13339 4184
Table 2.1: Frameworks that support the BDD approach.
2https://github.com/techtalk/SpecFlow 3https://github.com/jasmine 4https://github.com/concordion 5https://github.com/Behat 6https://github.com/behave 7https://github.com/gabrielfalcao/lettuce
Table 2.1 highlights the prominence of the Jasmine and Cucumber frameworks, be-ing the most recognized and used by the development community. The framework used throughout this work for automation and standardization of BDD features will be Cu-cumber. However, any other framework can be used to apply the approach presented in Chapter 3.
According to [32], the BDD approach enables the development team to focus their efforts on the identification, understanding, and construction of features of business im-portance, allowing these resources to be well designed and well implemented. Although it is an apparently more dynamic way of writing about requirements, according to so-and-so, the writing of BDD scenarios does not follow a pattern, or rule to be applied.
Due to a lack of formalization of the definition of features in the format of BDD scenarios, some problems may arise, such as the problem of incomplete or inconsistent requirements. Therefore, according to [43], it is important to structure knowledge about BDDs in the form of quality attributes and use a question-based checklist in the form of a document accessible to software teams.
2.4
Program Spectrum
The Program Spectrum concept refers to the system execution path, recording the points of the code that occur during the execution of a particular feature [44]. This information can be useful for comparing the behavior between different versions of the same system, making it easier to identify the fault that generated the failure.
Program Spectrum provides a behavioral signature for each execution, allowing inter-nal knowledge of the implementation of each system usage scenario. The Program Spec-trum is obtained from the insSpec-trumentation of the code, registering the execution path of the same. In this way, it is possible to obtain the behavior of the system according to each feature/input pair executed. This information can be useful during debugging and software testing activities. In relation to the test activity, [37] proposes a new white-box approach, called I/B Testing, or Input/Behavior Testing, where path-spectrum is used to identify points of failure, even if the output appears to be correct.
The concept of Program Spectrum can be classified as follows: [44]:
• Branch spectra: Records the set of conditional branches exercised during system execution. Depending on its purpose, it is called Branch-hit Spectrum (BHS), or Branch-count Spectrum (BCS). When the purpose is only to find out whether a
8https://github.com/Codeception 9https://github.com/jbehave 10https://github.com/cucumber
particular entity has been executed or not, it is the technique BHS. If the goal is to count how many times each entity has been executed, this is the BCS.
• Path spectra: Records the set of intraprocedural and loop-free paths exercised dur-ing system execution. As in the previous concept, it can be classified into two categories: (1) Path-Hit Spectrum (PHS) and (2) Path-Count Spectrum (PCS), which make it possible to verify if a specific path was exercised and how many times each path was executed, respectively.
• Complete-path Spectrum (CPS): Determines the complete path of system execution, taking into account all lines of code exercised.
• Data-dependence Spectra: Determines the pairs of [statement/use] exercised during system execution. This concept can also vary, being classified in Data-Dependence-Hit Spectrum (DHS), which is concerned only with recording whether a particular pair was exercised or not, and Data Dependence-Count Spectrum (DCS), which is concerned with recording how many times each pair was exercised during the execution of the system.
• Output spectrum (OPS): Records the output produced from the system execution. • Execution-trace spectrum (ETS) Records the sequence of program statements
ex-ercised during the execution of the system.
In Figure 2.3, a representation of the Complete-path Spectrum is presented, where the entire execution path of Listing 2.2 is registered.
1 v o i d p r i n t _ a v e r a g e ( ) { 2 num_inputs = read_num_inputs ( ) ; 3 i = 0 ; 4 w h i l e ( i <= num_inputs ) { 5 v a l u e = g e t _ i n p u t ( ) ; 6 sum = sum + v a l u e ; 7 i = i +1; 8 }
9 a v e r a g e = compute_average ( num_inputs , sum ) ; 10 p r i n t f ( a v e r a g e ) ;
11 } 12
Listing 2.2: Sample code. Figure 2.3: Execution path. The use of the Program Spectrum concept may differ significantly, as the classifications presented above can be applied for different purposes, as could be observed in the work
of [17], where branches, functions and statements were analyzed with the objective of maximizing the efficiency of the prioritization of test cases based on the Operational Profile.
Chapter 3
The Feature-Trace Approach
Our approach, Feature-trace, aims to define a method for the semi-automated generation of the OP and to allow for the prioritization of software testing by means of BDD ar-tifacts and quantitative SUT information. Our approach uses BDD arar-tifacts to enable the generation of the OP, while minimizing the usual effort involved in the OP synthesis process. As such, Feature-Trace allows for the seamless analysis of the distribution of the test effort employed throughout the source code and the prioritization and selection of test cases based on OP, program spectrum, number of impacted features, and the methods complexity.
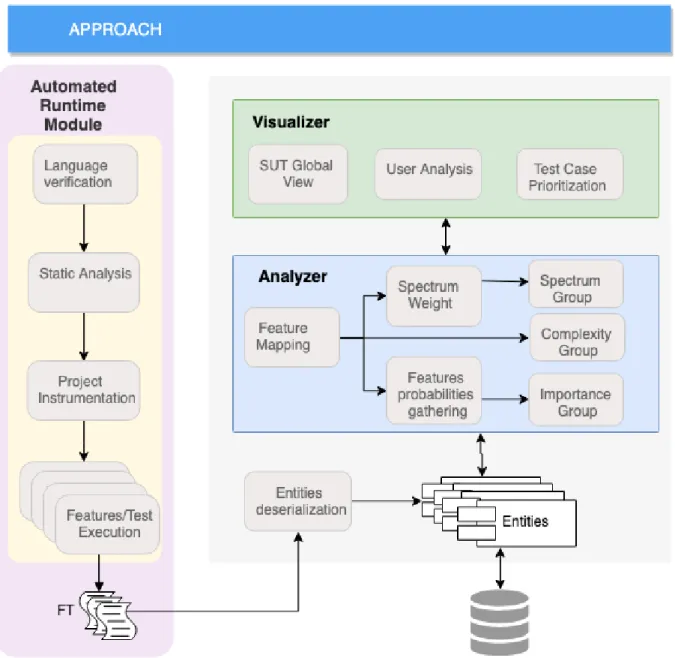
An overview of the Feature-Trace approach is depicted in Figure 3.1. It consists of three main modules: Automated Runtime Module (ARM), Analyzer, and Visualizer.
Firstly the ARM verifies the language of the SUT, analyzing the feasibility of the analysis according to the units of extraction available. After this analysis, the SUT goes through a static analysis process where all the entities of the software from BDD artifacts to code entities are obtained. By these means, the SUT is instrumented to enable the execution traces to be obtained. Once the ARM has processed the information from the execution traces, they are persisted in a database.
The Analyzer module, in its turn, is responsible for: (1) generating the map of features, which highlights the traceability between the requirements and the code of the SUT; (2) obtaining and distributing the probabilities of occurrence of each SUT entity, achieving the OP; and (3) presenting data from each entity according to the spectrum count, the number of impacted features (IF) and the analysis of the complexity of each method.
Finally, the Visualizer module is responsible for the interface between the approach and the user, presenting the global view of the SUT and the quantitative data of each entity, besides guiding the prioritization and selection of test cases focusing on the growth of software reliability.
Figure 3.1: Feature-Trace Architecture.
The following sections provide a detailed explanation of the main modules that con-stitute our Feature-Trace approach.
3.1
The Automated Runtime Module
The main objective of the ARM is to extract information from the SUT, statically and dynamically, persisting the information required to carry out the analysis present in the other two modules: Analyser and Visualizer. The main activity of the ARM is to extract the entities needed to generate the OP, both from the BDD artifacts and the source code. This activity is done in “Feature/Test Execution” activity, presented in Figure 3.1.
As shown in Figure 3.1, the first task performed by ARM is to verify the language of the SUT, since static and dynamic analysis depends directly on the technology used by SUT. Technology verification takes into account some patterns of each language, such as the format of present files and the presence of configuration files (such as ruby’s gemfile). After language identification, the SUT static analysis is performed, extracting all classes and methods present in the project, all test cases, and all BDD scenarios. Static analysis also seeks to extract some code complexity metrics, such as Cyclomatic Com-plexity, ABC Score, and Number of Code Lines of each method. In this work, complexity metrics are extracted using Excellent1 as a supporting tool. This tool was chosen because
of its ease of integration as it is a CLI (Command Line Interface) based tool. This way, the tool developed in this work, Trace Feature, can execute the Excellent and obtain the result of the execution, recording the necessary metrics for each of the existing methods in the project. By extracting all methods, tests, scenarios, and complexity metrics, all data is sent to the server for storage in the database for future analysis (Analyzer and Visualizer modules).
At the end of the static analysis, some source code instrumentation activities are required to obtain traceability data by identifying the set of methods executed from a given scenario or test case. In this first version presented in this paper, the instrumentation process is done to configure simplecov2. For this, it must be inserted in the gemfile (if
it does not exist), and the directories to be analyzed must be defined. After the correct configuration, the environment is prepared for project execution in the next step (dynamic analysis). All of these activities are fully automated using the Feature-Trace tool presented in this paper, which makes the analysis process simpler and faster.
By extracting all necessary static information and setting up the environment, the test case execution process begins to identify the methods exercised by each test case or BDD scenario. At the end of the execution of each test case, the set of executed methods is sent to the server to perform feature mapping, building a graph that joins each feature to each scenario and each scenario to all the methods exercised by it. Mapping also involves the relationship between existing methods and the test cases (unitary and integration) that exercise them. Thus, you can map all entities involved in the project, from the features and scenarios (requirements), the methods (source code), and the test cases that verify these methods. This set of related entities enables the analysis of various data following various strategies, as will be presented throughout the work.
When referring to the extraction of BDD features/scenarios, we should highlight the strategy used for this, since this work seeks to relate the entities of the approach BDD
1https://github.com/simplabs/excellent 2https://github.com/colszowka/simplecov
with the entities present in the definition of the Operational Profile. The following is the strategy used to perform this entity relationship.
3.1.1
Operational Profile Entities
Regarding the OP entities extraction, we start from the highest level of the OP, the
Customer Profile, that refers to the customer who purchases the software, grouping
types of users into a wider classification [1]. We should note that the BDD approach does not directly support the definition of an entity related to it. However, BDD allows the inclusion of user-defined “tags” to group features into similar groups. This capability can be used to define the Customer Profile. The same strategy can be applied at the User
Profile and System-mode Profile levels, as they do not have a corresponding BDD
entity.
In relation to the Functional Profile level, the functionalities are defined in the software user view. This entity can be related directly to the concept of BDD Feature, which also represents the functionality of the software in the view of the user [25].
After identifying the functions, the key input variables, which define the variations of the use of each function, must be raised [1]. In the BDD approach, variations of a feature are defined from the writing of usage scenarios. By these means, key input
variables can be obtained directly from the concept of BDD scenarios.
Finally, at the last level is the Operational Profile, which is obtained from the execution trace analysis of each key input variable. That is, operations are mapped into entities of the SUT source code enabling the execution of specific functionality. In this work, operations are mapped in software methods, but the degree of granularity must be adapted according to the OP analysis need.
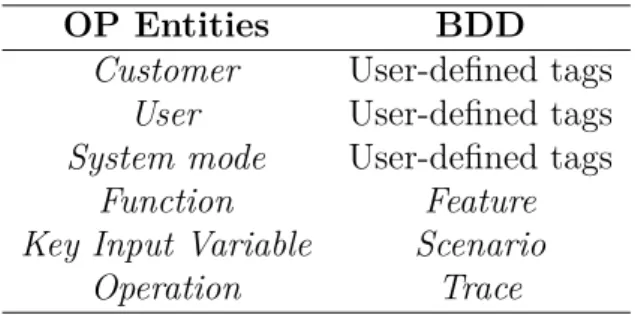
Table 3.1 presents the proposed relationship between the entities of the OP and the entities of the BDD approach.
Table 3.1: Operational Profile from BDD artifacts.
OP Entities BDD
Customer User-defined tags
User User-defined tags
System mode User-defined tags
Function Feature Key Input Variable Scenario
Operation Trace
Following these relationships, the ARM uses automation strategies to obtain all the entities of the OP. The mapping between the OP entities and the BDD approach makes it
possible to obtain some vital information, as one can execute BDD scenarios and unit/in-tegration tests in such a way that execution is tracked and analyzed. As suggested by the
Covrel approach [17], the OP (black-box) information should be weighted with the Pro-gram Spectrum (white-box), maximizing the final reliability of the software, since, from
this weighting, we avoid the stability of the reliability growth of the SUT after few test cycles were performed. So the ARM extracts the Program Spectrum of all SUT entities. In addition to this information, we obtain, statically, information about the complexity of each method, such as ABC score [45], and Cyclomatic Complexity [46]. In addition, the ARM obtains the result of each test case, recording whether the test has passed or failed, allowing an analysis of the failure history.
3.2
The Analyser Module
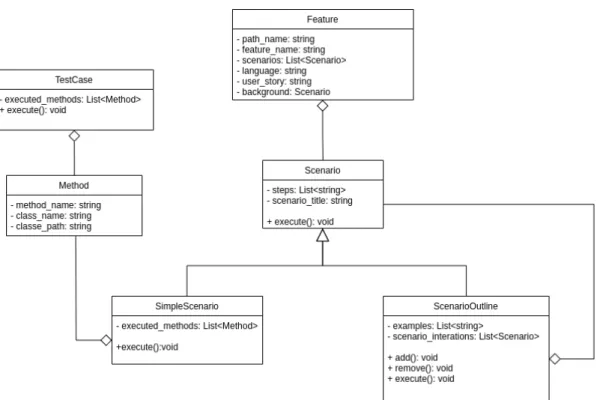
This module is responsible for constructing the mapping between the entities of the soft-ware, relating from the requirements to the computational units that compose them. The output of the information provided by the ARM is incrementally submitted to the Ana-lyzer Module, where each feature is executed individually. By these means, the AnaAna-lyzer Module receives requests sequences containing a feature with its scenarios and their re-spective traces of execution. We should note that in the Feature-Trace approach, the process of mapping SUT entities occurs in an automated way in the Analyser Module.
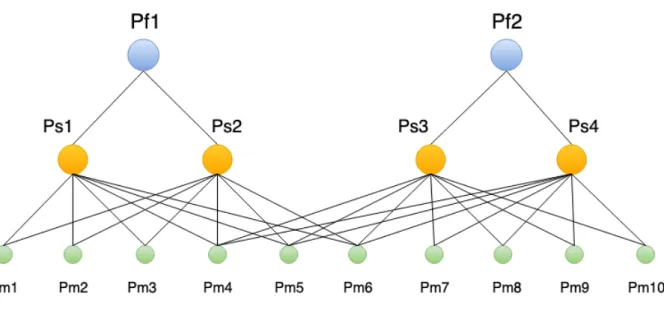
We explain the process of the Analyser Module through the Algorithm 1. The Al-gorithm receives a tuple that contains the feature and scenarios with their respective execution traces and it must return success or fail. In line 2, the Algorithm instantiates the feature in a python object. As the process of obtaining the information occurs incre-mentally, the database must guarantee there is no redundant data, as it can be observed in lines 3 and 10 of Algorithm 1. Lines 4, 11 and 17 verify the existence of the object in the database, for updating. The relationship between Features, Scenarios, and Methods is performed according to lines 13 and 18, arranging in such a way that a feature has one or many scenarios and a scenario has one or many methods executed. In line 16 the set of persisted methods of the SUT, extracted and registered through the ARM, is then filtered to relate with the current scenario. This filter facilitates the verification of the completeness of the SUT since it may output those methods that were neither executed by BDD scenarios nor by unit/integration tests.
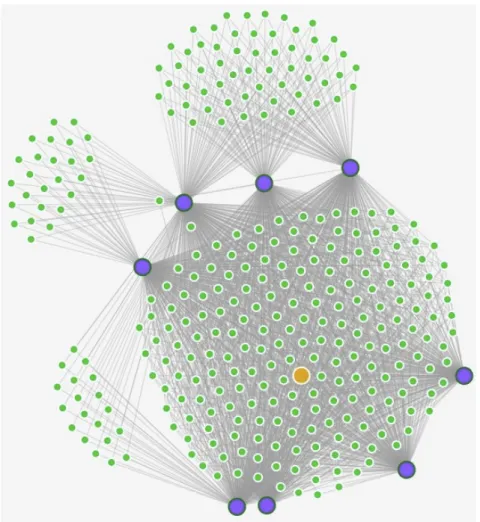
At the end of Algorithm 1, all entities involved in the process of feature analysis must be registered in the database with their appropriate relationships. Figure 3.2 illustrates the relationship between features, scenarios, and methods, where the features are on the top in blue color, the scenarios are in the middle in yellow color and the methods are on the
Algorithm 1: Feature Mapping Algorithm. Input: String f_trace
Result: Boolean
1 Function create_entities(f_trace)
2 feature = instantiate_feature(f_trace[‘feature’]); 3 f_base = verify_feature_base(feature);
4 if not f_base then 5 feature.save();
6 end
7 var scenarios = f_trace[‘scenarios’]; 8 for scenarios as scenario do
9 var sc = instantiate_scenario(scenario); 10 var base_sc = verify_scenario_base(sc); 11 if not base_sc then
12 sc.save();
13 sc.feature = feature;
14 end
15 for scenario[‘methods’] as method do
16 met = Method.filter(method_id=method[’method_id’]); 17 if met then 18 sc.executed_methods.add(met[0]); 19 end 20 end 21 end 22 return True
bottom of the Figure in green color. We should note that, from this structure, the upper levels of the OP regarding customer, user and system mode may be also complemented if the set of User-Defined Tags are specified and then previously analysed by ARM.
In addition, a procedure analogous to the one presented in Algorithm 1 is performed in the Analyser Module to extract the methods that are invoked in the execution of unit and integration test cases. This information is possible given that the ARM also supports unit and integration test execution.
In order to conclude the steps of OP generation, the probability of occurrence of each mapped entity must be performed. As in traditional OP generation approaches, these probabilities must be obtained from the domain context. Such information can be obtained from interaction with domain experts or experienced users [1]. Thus, high-level entities can receive estimated probability information from the highest OP high-level to the level of key input variables. With this information, the software execution trace enables the distribution of probabilities between the levels of Functional Profile and Operational Profile, completing the OP. We should note that the probability of
Figure 3.2: Map of Features, Scenarios and Methods.
occurrence of the method is simply derived from the sum of the probabilities of occurrence of their corresponding invoking scenario.
After generating the OP, the Analyzer module distributes the analyzed methods into three groups, where each group is further classified into High, Medium and Low level. Those groups take into account different criteria, allowing for comparisons and analyses that assist the prioritization of test cases. The first group, called the Spectrum Group, is based on the number of test cases that exercise each method. The second group, the
Complexity Group, takes into account some metrics of complexity and the third group,
the Importance Group, uses the OP information. The distribution between the levels of each group can be done via clustering or any grouping strategy. Then, the use of these metrics facilitates the prioritization and selection process by the testing team based on (1) the SUT reliability impact (importance group), (2) the amount of test-cases that exercise the entity (spectrum group), and (3) the methods complexity (complexity group). The 2 Algorithm provides a simple example of how importance grouping (Operational Profile) can be done.
Other relevant information that should be taken into account during the test case prioritization or selection process is the number of Impacted Features (IF) by a given code entity such as methods or classes. This information is straightforward since the entities have already been mapped. In this way, the Analyzer module computes and records this information following the one presented in Algorithm 3. To obtain the number of features impacted by a given method, we observe all the scenarios that execute the method and include their features in a variable of the type Set3, as shown in line 4. This strategy
avoids the repetition of features since some scenarios that execute the method are related
Algorithm 2: Groups Distribution. Input: List methods
Result: Dict levels
1 Function distribute_importance_group(methods) 2 var levels = { 3 "high": [], 4 "medium": [], 5 "low": [] 6 }
7 for methods as method do
8 if method.get_probability() < low then 9 groups["low"].append(method);
10 else
11 if method.get_probability() < medium then 12 groups["medium"].append(method); 13 else 14 groups["high"].append(method); 15 end 16 end 17 end 18 return groups;
to the same feature. The resulting set, after line 5, has all the features impacted by the analyzed method.
Algorithm 3: Count Impacted Features. Input: Method method
Result: Method method
1 Function count_impacted_features(method) 2 features = set();
3 for method.scenarios as scenario do 4 features.add(scenario.feature);
5 end
6 return len(features);
The distribution of probabilities is based on the edges of the entities graph. A simple and practical example is presented in the 4 Algorithm. Since a method is related to specific BDD scenarios and these scenarios have a probability of occurrence derived from business area analyses, customer interviews, or any other strategy, it is possible to distribute this probability. To do it, add the likelihood of occurrence of all scenarios that exercise a given method, as presented in line 4 of the Algorithm.
Algorithm 4: Method probability (OP). Input: Method method
Result: Method method
1 Function get_probability(method) 2 method.probability = 0;
3 for method.scenarios as scenario do
4 method.probability += scenario.probability;
5 end
6 return method
In this way, the Analyzer Module provides the information obtained and the analysis performed to the Visualizer Module so that those responsible for the testing process adopt the strategy they want to distribute the testing effort and to prioritize the test cases.
3.3
The Visualizer Module
As shown in Figure 3.1, the Visualizer module enables: (1) the global view of the SUT, making evident its traceability; (2) performing analyzes from the data crossing and (3) using the generated data to support the test case prioritization or selection according to the desired strategy. This Module is responsible for presenting the outcome from the Analyzer Module. Among the information presented, we highlight the groups of entities based on criteria such as complexity, Program Spectrum and OP.
In addition, the Visualizer Module enables a global view of the software from the perspective of requirements, code and test entities in a graph-like structure, as depicted in Figure 4.1. This representation provides a view of the reification of requirements into source code, as well as makes clear the proximity of methods, that is, methods that make up the same features, always occurring together, and specific methods, composing only one or few features.
The global view of the software automates the process of identifying the requirements in the source code, which is recognized as an essential activity for the software maintenance and evolution process [47]. In this way, the Visualizer Module enables the testing team to graphically analyze the traceability of the software project, as well as to analyze the quantitative data of the traced software entities and thus guide its maintenance, evolution and testing process.
This set of visualizations and information of the software entities enables the applica-tion of several techniques for prioritizing test cases, from black- to white-box techniques. From our Feature-Trace approach, it is possible to apply several of the techniques pre-sented in [12] and [15]. For example, among the white-box prioritization techniques, the
Feature-Trace approach supports techniques based on both Total Coverage, where prior-ity is given to test cases that cover the largest number of source code units, as well as
Additional Coverage, which seeks to select the test cases that cover the largest number of
entities not yet covered by the set of test cases executed [48]. The approach also allows for the use of prioritization techniques that are based on the diversity of the generated trace, using, for example, Global Maximum Distances algorithms [49]. In relation to black-box testing prioritization techniques, the Feature-Trace approach allows the use of techniques based on the requirements [50] and using concepts such as OP [1]. Finally, from the logs of the testing activity, our approach may also allow the application of techniques that use the history of test case failures as a prioritization or selection criteria.
3.4
Development Architecture
The Feature-Trace tool is in its first version, at the time of completion of this work and, currently, it is divided into two major parts: a client (Automated Runtime Module) and a server, containing the Analyzer Module and Visualizer Module. Both parts were developed in Python 3, with ARM made with pure Python and the server using the Django framework4.
3.4.1
Automated Runtime Module
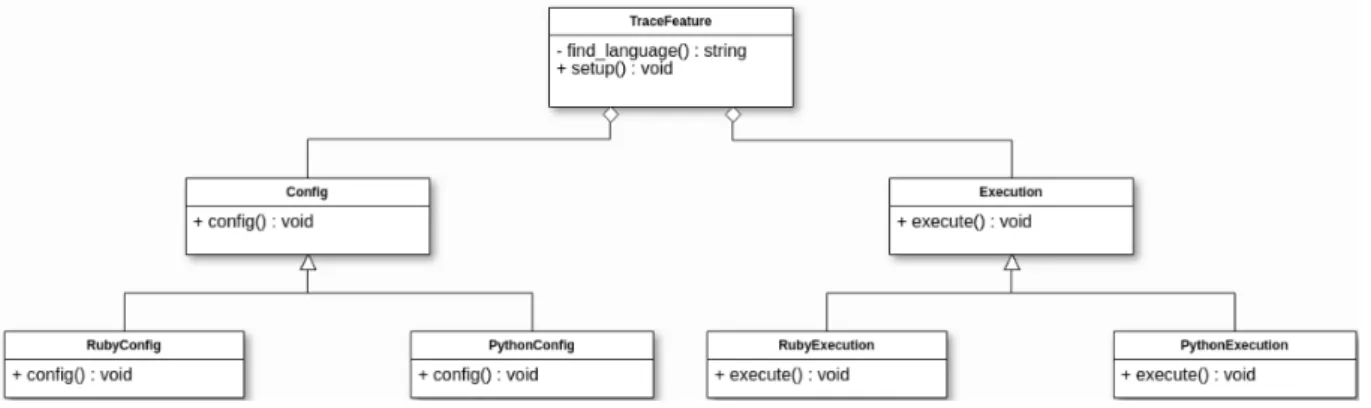
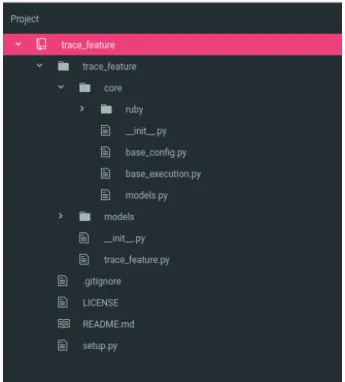
Regarding ARM, its implementation follows that shown in Figures 3.3 and 3.4.
Figure 3.3: ARM Architecture.
In ARM, the starting point of execution occurs in the class FeatuTrace, being re-sponsible for defining the user interface (CLI) and distributing the activities to Config and a Execution. So far, the proposed tool is only capable of analyzing projects developed in Ruby. However, its architecture has been designed in such a way that it makes evolution
![Figure 2.1: Operational Profile composition [1].](https://thumb-eu.123doks.com/thumbv2/123dok_br/15251303.1024259/20.892.208.685.125.526/figure-operational-profile-composition.webp)