A Work Project, presented as part of the requirements for the Award of a Master Degree in Finance from the
NOVA – School of Business and Economics.
MCDONALD’S INC. – LEADING THE QSR
INDUSTRY AT ALL VELOCITY
CARLA SOFIA PEIXOTO PEDROSO
25945
GONÇALO DA SILVA RAMOS
25946
A Project carried out on the Master in Finance Program, under the supervision of:
FILIPA CASTRO
Abstract
After the former CEO exit and quarterly disappointing results, McDonald’s stock went
down 10.7% of its all-time high of $221.93 (Aug 19). We provide an in-depth DCF valuation
analysis explaining the main assumptions behind our BUY recommendation. We propose a
price-target of $225.91, mainly driven by the re-franchising success – that is boosting operating
margin; and by same-store sales – which have been benefiting from further implementations of
the Velocity Growth Plan. Moreover, we looked further to strategy, shareholders and capital’s
structure, making sure that McDonald’s comparables were considered in order to provide a
relative valuation and benchmark our DCF valuation.
Keywords
McDonald’s, Turnaround, Re-franchising, McDelivery
This work used infrastructure and resources funded by Fundação para a Ciência e a Tecnologia
(UID/ECO/00124/2013, UID/ECO/00124/2019 and Social Sciences DataLab, Project 22209), POR
Lisboa (LISBOA-01-0145-FEDER-007722 and Social Sciences DataLab, Project 22209) and POR
Norte (Social Sciences DataLab, Project 22209).
MASTER IN FINANCE
THIS REPORT WAS PREPARED EXCLUSIVELY FOR ACADEMIC PURPOSES BY SOFIA PEDROSO AND GONÇALO RAMOS,MASTER’S IN
FINANCE STUDENTS OF THE NOVA SCHOOL OF BUSINESS AND ECONOMICS.THE REPORT WAS SUPERVISED BY A NOVA SBE FACULTY
MEMBER, ACTING IN A MERE ACADEMIC CAPACITY, WHO REVIEWED THE VALUATION METHODOLOGY AND THE FINANCIAL MODEL.
(PLEASE REFER TO THE DISCLOSURES AND DISCLAIMERS AT END OF THE DOCUMENT)
Page 1/32
§ After the prior CEO Steve Easterbrook exit and the quarterly
disappointing results, below analysts’ estimates, McDonald’s stock went down 10.7% from its all-time high of $221.93 a share, registered in August, to $197.61, in 31th December 2019.
§ We rate the stock with a BUY recommendation, and we
estimate a total expected return of 17.3% in the following 12-month period, already considering cash gains from dividends and buybacks.
§ The re-franchising target continues with a long-term goal of
the company to be 95% franchised, which we estimate to be achieved in 2024, driving operating margin even further upwards.
§ Half of the systemwide restaurants, as of two thirds of the
US restaurants are already re-modelled under “The Experience
of the Future”, improving customer experience and guest counts.
§ McDelivery is expected to represent $4 billions of the sales
in 2019 and is now available in over 60% of the company’s restaurants worldwide.
§ In 2019 McDonald’s acquired Apprente and Dynamic Yield,
AI platforms which promise to disrupt customer experience. Dynamic Yield is already incorporated in 9,500 drive-thru in US. Company description
McDonald’s Corporation is a 79 years old originally American company operating through 37,855 stores (2018) in QSR segment of the Restaurant industry. At year-end 2018, 93% of the business was franchised. The company is organized into four main segments: US, International Lead Markets, High Growth Markets and Foundational Markets & Corporate.
M
C
D
ONALD
’
S
I
NC
.
C
OMPANY
R
EPORT
QUICK-SERVICE RESTAURANTS
6THJANUARY 2020G
ONÇALOR
AMOS,
S
OFIAP
EDROSO [email protected] [email protected]Recommendation: BUY
Price Target FY17: 225.91 $
Price (as of 31-Dec-19) 197.61 $
Bloomberg: MCD US Equity 52-week range (€) 173.41-221.93 Market Cap (€m) 149.241 Outstanding Shares (m) 753.09 P/E Ratio 25.00 Source: Bloomberg Source: Bloomberg 2017 2018E 2019F Revenues (million $) 21 025 21 249 21 156 EBITDA (million $) 10 450 11 014 11 180 EBIT (million $) 8 968 9 478 9 596 Operating Margin (%) 42.7% 44.6% 45.4%
Net Profit (million $) 5 924 5 654 5 571
EPS ($) 7.7 7.4 7.3
CAPEX (million $) 2 742 2 364 2 248
Net Debt (million $) 30 420 34 983 35 512
Dividend Payout Ratio (%) 55% 49.5% 44.3%
ROIC (%) 15% 15.7% 15.5%
Core FCF (million $) 6 156 5 998 6 310
Source: Company Reports and Analysts Estimations.
0 50 100 150 200 250 2014 2015 2016 2017 2018 2019 5-Years Cumulative Total Return
McDonald's S&P500 Index Dow Jones Industrials
Leading the QSR Industry
AT ALL VELOCITY
MCDONALD’S COMPANY REPORT PAGE 2/32
Table of Contents
MCDONALDS IN CONTEXT ... 3 THE STRATEGY ... 4 I. TURNAROUND PLAN ... 4II. THE VELOCITY GROWTH PLAN (VGP) ... 4
III. DISCOUNTS AND COUPONS ... 5
IV. MCCAFÉ ... 6 V.TECHNOLOGY ... 6 VI. SUSTAINABILITY ... 6 FINANCIALS ... 7 ECONOMIC OUTLOOK ... 8 INDUSTRY OUTLOOK ... 9 MCDONALD’S COMPARABLES ... 11 VALUATION ... 13 REVENUE ... 13
SALES PER STORE ... 14
OPERATING MARGIN ANALYSIS ... 17
OTHER OCCUPANCY AND OPERATING EXPENSES ... 18
FRANCHISED OCCUPANCY EXPENSES ... 19
CAPITAL EXPENDITURES ... 19
WORKING CAPITAL ... 20
LONG-TERM DEBT ... 21
SHAREHOLDER STRUCTURE ... 21
WEIGHTED AVERAGE COST OF CAPITAL ... 22
MCDONALD’S COST OF EQUITY ... 22
MCDONALD’S COST OF DEBT ... 23
CAPITAL STRUCTURE ... 23
DISCOUNTED CASH FLOW VALUATION ... 24
RETURN ON INVESTED CAPITAL ... 24
GROWTH RATE ... 25
ENTERPRISE VALUE ... 25
SENSITIVITY ANALYSIS ... 26
SCENARIO ANALYSIS ... 26
RELATIVE VALUATION ... 26
VALUE CREATION ANALYSIS ... 27
REFERENCES ... 28
APPENDIX ... 29
MCDONALD’S COMPANY REPORT
PAGE 3/32
McDonald’s in Context
Ray Krok is the mastermind behind McDonald’s empire, the iconic brand recognized worldwide, counting 37,855 stores in more than 120 geographies [year-end 2018], close to 210,000 employees, over $96.1 billion in systemwide sales (franchised and company-operated sales) of which $21 billions represents company’s revenues (company-operated sales plus rents, royalties and fees charged to franchisees). McDonald’s has been disrupting the informal eating out segment of the Restaurant industry, impacting the way we live our lives today. The provision of a highly efficient quick service with a uniform pattern, either in the tastiness, either in the time record methodology was the turning point of a whole sector. Although McDonald’s owes its worldwide success to Ray Krok, the original concept came from the McDonald’s brothers, Richard and Maurice, who set up the very first “McDonalds’s Bar-B-Que” in San Bernardino, California, and then in 1940, later relaunched as “McDonald’s”. In 1948, the brothers created the “Speeded Service System” organizing the kitchen as an assembly line. Later, they ended up selling their equity to Krok.
Throughout the years the company has been developing and improving its franchised business model, turning out to become primarily a franchisor with 93% of the restaurants operating under this model [2018 year-end]. The company organizes the contracts into: Conventional Franchise, Development License or Affiliate (figure 2). Under the first, McDonald’s holds the real estate infrastructures and/or secures a long-term lease for the location and the franchisee pays for the facilities, i.e. equipment, signs, seating and décor (2018’s Annual Report). Franchisees are also required to reinvest capital in the business; however, if necessary, the company co-invests to enhance further improvements. Typically, this model lasts for 20 years and cash flows for the main company comes in the form of rent payment, royalties - upon a percentage of the sales, with minimum specified rent payments, and initial fees to be paid upon the opening or the provision of a new grant. Under the second, licensees enter with the real estate and with the facilities, are required to manage, operate the business, develop and open new brunches. The cash-flows are returned in the form of initial fees in the same circumstances described above, and as royalties upon a sales’ percentage. To note that Affiliate arrangements represent a small portion of the whole model, since its only used in a limited number of foreign markets. Also, the share of the net results in this last format are recorded in Unconsolidated affiliates, since it requires equity investment from the company. According to the annual report of 2018, the company owned approximately 50% of the land and approximately 80% of the buildings of its restaurants in consolidated markets at year-end 2018 and 2017.
Fig. 1. McDonald’s Initial Menu.
Fig. 2. Sales Distribution in % of Annual Sales. Source: Company Report.
Fig. 3. Sales Distribution in % of Annual Sales. Source: Company Report.
Sales Distribution (%) 2016 2017 2018 Conventional Franchised 80% 76% 73% Developmental Licensed 13% 16% 16% Foreign Affiliated 7% 8% 11% 73% 16% 11% Sales Distribution in 2018 (%) Conventional Franchised Developmental Licensed Foreign Affiliated
MCDONALD’S COMPANY REPORT
PAGE 4/32
The Strategy
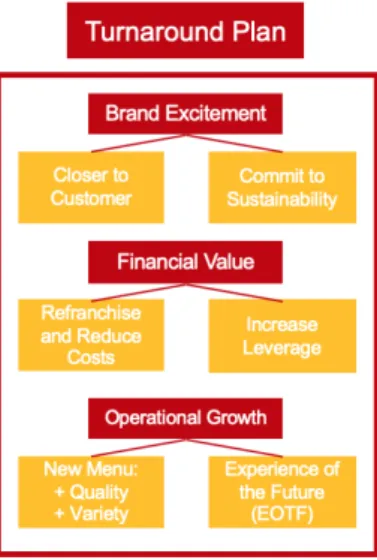
Steve Easterbrook, previous McDonald’s’ CEO, launched two leading strategic plans: The Turnaround Plan (2015) and The Velocity Growth Plan
(2017).
I. Turnaround Plan
After 5 years (2010 – 2014) of unsatisfactory performance the company decided to reorganize international operations by maturity and growth potential, namely: US, International Lead Markets (established markets), High Growth Markets (high potential restaurant growth), and Foundational Markets & Corporate (the remaining markets and company corporate operations), replacing the previous regional segmentation: Us, Europe, Asia/Pacific, Middle East and Africa. Moreover, improving operational growth became an urgency forcing the company rethinking menu offerings and quality, by removing some sandwiches, while adding premium key ingredients. According to Business Insider, the menu grew 42.4%, between 2007 and 2015, from 85 to 121 items, and drive-thru waiting time achieved 3 minutes (the longest average time in 15 years). Refining ingredients’ quality become a “top priority” for Easterbrook after the food safety scandal in Asia, which triggered public distrust over the company and lead to a 15% loss in sales, in 2014. At the time, franchisors relationships were at all-time low levels, with 81% of the company business model under the franchise scheme. Moreover, the company set the target to become 95% franchised in the long-term. This plan was a huge success, driving the company’s stock from $118, year-end 2015, to $172, year-end 2017, an increase of 45.8% in 2 years.
II. The Velocity Growth Plan (VGP)
The Velocity Growth Plan has been the guide to pursuit a customer-centric strategy, as it was designed to drive sustainable guest count growth supported by three main growth accelerators: retaining existing customers, regaining and converting casual to comitted customers. In order to strenght those drivers, the company identified three main pillars:
1. Experience of the Future (EOTF)
The EOTF is deeply tied to the digital strategy of the company and consists on the modernization of all McDonald’s restaurants in terms of design, customer interaction and technological transformation. This concept introduces “Restaurant Guest Experience Leader”, table service and curb-side pick-up aiming to provide a better experience, driving incremental visits and increasing average checks. Under this format, McDonald’s’ was able to improve the options for customers to interact with the brand, either when ordering, paying or collecting, and also adding
Fig. 6. Self-Order Kiosks. Fig. 5. Velocity Growth Plan Scheme. Source: Company Report.
Fig. 4. Turnaround Plan Scheme. Source: Company Report.
MCDONALD’S COMPANY REPORT
PAGE 5/32
“on table” service. At year-end 2018, there were already 17,000 restaurants with self-order kiosks, more than 21,000 restaurants with digital menu boards and over 22,000 restaurants allowed for “Mobile Order and Pay”.
2. Digital
The Digital has been the fuel of the transformation by converting restaurants into what McDonald’s believes to be the “Experience of the Future” while contributing to further integration through the mobile application. At year-end 2017, over 20 million users were registered in the App, only in the US. The global mobile app become a key component in McDonald’s strategy since it allows direct customer interaction, bringing convenience i.e. “Mobile Order & Pay” and also advertising promotions and discounts, while rewarding repetead purchases through a system of points. Each customer is identified by a QR code allowing the company to monitor its journey while refining efficiency and gathering data.
3. Delivery
McDonald’s partnered with Grab (Asia), Grub Hub, DoorDash and Uber Eats, being this last already available in 12,000 restaurants across 60 locations worldwide in 2018 (July 19th, Business Insider). McDonald’s realized that extending its services would be the way to increase convenience, while allowing the company to pierce other layers of the market. As of 2018’s year-end, delivery was available in half of the systemwide outlets and is still expanding. In 2019, 23,000 restaurants in over 80 countries are able to provide the service. According to the company’s former CEO, in the 2019’s Q3 Earnings Call, there was an average of 10 McDelivery orders per second, 864,000 orders a day, 26 million orders a month and 315 million orders a year. As of 2019 year-end, the sales through delivery are expected to account 4% systemwide sales ($4 billion), achieving the $5 billion in 2020. Customer satisfaction indexes have been rising, boosted by the service extent while the company have been benefiting by higher average checks (in compassion with non-delivery transactions), higher re-order rates and average checks are 1.5 to 2 times higher.
III. Discounts and Coupons
In the last couple of years, companies in the QSR industry have been fighting for market share resulting in a aggressive price competition. In order to remain competitive, McDonald’s launched “$1 $2 $3 Dollar Menus”, “McPick 2 for $5”, “Buy One Get One for $1” and others discount campaigns. Even though it had started in the US, where competition is fierceless, it is already in the remaining geographies. This strategy have been driving the increase in guest counts up as it acts as an invitation for customers to visit McDonald’s stores more often.
Fig. 8. McDelivery Staff. Fig. 7. McDonald’s App.
MCDONALD’S COMPANY REPORT
PAGE 6/32
IV. McCafé
Taking advantage of the pre-existent infrastructures, the company has been working to improve its offer through a specialized coffee shop with fair price points. Breakfast and coffee markets are very competitive with major players like
Starbucks or Dunkin’ Donuts. According to Euromonitor International1, in 2017
McCafé owned 8% of the market share in Western Europe and 19% of the market share in Australasia, regarding the specialist coffee shop category. Still, in order to gain more market share, McDonald’s is betting on sustainability and value deals i.e. The company expects 100% of their coffee to be 100% from sustainable sources in 2020. Sustainability is good, but allied with value deals like $2 for a small McCafé drink or $1 for a drip coffee definitely is inviting for customers on a budget. According to Euromonitor, McCafé is leader in Germany, Australia and Brazil and number two in China and Italy for the coffee category. V. Technology
McDonald’s is testing provisioning with automated voiced and personalized service in the thru for some restaurants to decrease waiting lines in drive-thru and to provide a better experience for the customer. In 2019, McDonald’s acquired Dynamic Yield for $300 million and Apprente for an undisclosed amount. The first is a platform that uses data and real-time information to personalize the experience of the customer and the second is a start-up that has been building conversational agents that can automate voice-based ordering in multiple languages. With the new technology McDonald’s could personalize user experience as deep as offering discounts based on purchased items, weather or geographic location. As of the end of the third quarter of 2019, dynamic yield technology was already incorporated in 9,500 US drive-thru and the objective is to further implement this technology in the mobile app and self-ordering kiosks. VI. Sustainability
The company has identified five critical areas: packaging and recycling, climate action, beef sustainability, youth opportunity and commitment to families. In 2018, McDonald’s re-launched its sustainability platform with “Better M” initiative, in which the company set the goal to reduce/remove plastic usage from restaurants, while increasing recyclability without compromising the packaging recognized worldwide. For example, only in France, 1,200 tonnes of plastic would be saved by introducing fibre lid in all beverage’s cups, while, in Germany, customers are encouraged to bring reusable bottles to the restaurants under the “ReCup”
1 “McDonald’s Corp in Consumer Foodservice (World)”, by Stephen Dutton
Fig. 11. McDonalds’s Acquisitions:
Dynamic Yield and Apprente.
Fig. 10. McCafé. 0 5000 10000 15000 20000 2014 2015 2016 2017 2018 Number of Stores
MCDONALD’S COMPANY REPORT
PAGE 7/32
programme. McDonald’s, together with Starbucks, also makes part of the “Next Generation Cup Consortium” encouraging innovation in cups development. “Scale for Good” or efforts on “Edible Packaging” are other initiatives tackling customer concerns on health and on sustainability. This echoes the brand strategy in building deeper ties with its customers, more than simply offering convenience and tastiness. McDonalds is committed into developing a sustained relationship between the customer and the brand.
Financials
For the last couple of years Easterbrook’s plans have been a success: (1) The percentage of franchised restaurants increased from 82%, in 2014, to 93%, in 2018; (2) Operating margin increased from 29% to 42% driven by more franchised restaurants with better operating margins; (3) The number of restaurants increased by 1,597 (net), as a result of 5,541 additional franchised stores and a decrease of 3,944 in company-operated restaurants, for the same period of analysis; (4) Systemwide sales increased 9.5% ($8,361 billion) enhanced by franchising, which alone improved 24% ($16,517 billion) from 2014 to 2018; (5) Comparable sales improved from -1%, in 2014, to 4.5%, in 2018, having been 5.90% in the last Q3 of 2019 (figures 13 and 14). This means that, not only the company was able to open more stores, but also each store is selling more with a higher price/mix. Note that comparable sales have been driven by price mix’s upward trend since 2014, even though the number of guests is also experiencing an upward trend since VGP has been implemented.
Even though total revenues decreased $6.416 billions, in the period of analysis (figure 12), the portion coming from franchised restaurants increased $1.74 billions - explained, in part, by the re-franchising program which has been contributing to the increase of the share coming from franchisees, while revenue from company operated stores has been reducing as a consequence of the decrease in the number of company-operated stores. Still, Revenue decrease has been partially offset by the increase in the number of total stores and positive comparable sales.
From the four segments – United States (US), International Lead Markets (ILM), High Growth Markets (HGM) and Foundational Markets & Corporate (FMC) - the most represented in number of stores is the US, which has 37% of total stores, while HGM is the revenues leader, having contributed with 42% of total revenues (figure 15). The four segments have different franchising percentages, as of 2018 year-end, US was 95% franchised, ILM was 88% franchised, HGM was 83% franchised and FMC was 98% franchised. As the long-term objective is to be
Fig. 12. Franchised Revenues and
Operating Margin as % Revenues.
Source: Company Reports.
Fig. 13. McDonald’s Comparable Sales,
Price Mix and Guest Counts Evolution.
Source: Company Reports.
Fig. 14. Reported Comparable Sales Evolution. Source: Company Report.
Fig. 15. Revenues by Segment. Source: Company Report.
0% 20% 40% 60% 80% 100% $5 $10 $15 $20 $25 $30 2014 2015 2016 2017 2018 Bi lli on s McDonald's Indicators Revenues Franchised Restaurants (%) Operating Margin (%) -5.0% -4.0% -3.0% -2.0% -1.0% 0.0% 1.0% 2.0% 3.0% 4.0% 5.0% 6.0% 2014 2015 2016 2017 2018 Comparable Sales (% Change)
Global Comparable Sales Guest Counts Price/Mix
5.40% 6.50% 5.90% 0% 1% 2% 3% 4% 5% 6% 7% 1Q 2019 2Q 2019 3Q 2019 McDonald's Comparable Sales
26% 26% 42% 6% Revenues by Segment US ILM HGM FMC
MCDONALD’S COMPANY REPORT
PAGE 8/32
95% overall franchised, meaning that some segments are already at that point, while others will continue re-franchising.
Economic Outlook
Ranking top ten on FT’s Top 100 Global Brands and Forbes’ World’s Most Valuable Brands, in 2019, McDonalds is undoubtfully one of the most global companies worldwide. Taking advantage of the company extended presence, in 1986, The Economist launched the Big Mac Index as an attempt to access purchasing power parity disparities across regions, using the price of the Big Mac as the benchmark. However, even though the scale is crucial for the business, being international at this extent echoes operational, reputational and economic risks. McDonald’s is exposed to local economic swings, currency fluctuations, infrastructures quality levels, domestic policies and cultural sensibility.
In a global scenario, growth is in a synchronized slowdown, forecasted to be 3% in 2019, the slowest pace since 2008’s Financial Crisis (IMF, Oct 19). Moreover, US-China trade war is estimated to cumulatively reduce the global GDP by 0.8 p.p., already in 2020. Political tensions in emerging markets such as in Latin America - Chile, Bolivia, Brazil and Argentina, and in Middle East, still living under frictions, threat growth prospects in the regions.
Additionally, according to Damodaran, the Restaurant Industry had a beta levered of 0.8, between 2015 and 2019, meaning that there’s a positively strong correlation between the industry and uncontrollable events. However, when looking to McDonald’s peers, from 2014 until 2019, the beta levered falls in between 0.47 and 1.24, being 0.42 for McDonald’s (figure 17). This strengthens the company position regarding adverse scenarios, since it is 5 basis points below the second well positioned peer. Moreover, the company strategy regarding franchising ends up transferring part of the risks in each location, while allowing for a deeper adaptability to local markets.
In developed economies, low productivity growth and aging demographics exposes the company to monetary policy decisions and to target inflation expectations.
In the beginning 2019, Easterbrook, previous CEO, signed a letter to UK parliament warning the rise in food prices would be unavoidable in a context of a Brexit, enhancing to investors that “Consumer uncertainty is growing, from France
to China to the UK and elsewhere across the globe in response to tightening economies and shifting political environments”. Brexit consequences are
unknown, complicating the situation for McDonald’s, which owes part of its success in Europe to its UK restaurants. According to Bernstein Research, early 2016, UK represented 7% of McDonalds sales, while 28% of the sales were
0.42 0.58 0.47 0.52 0.60 0.48 1.24 0 0.2 0.4 0.6 0.8 1 1.2 1.4 MCD US
Equity YUM USEquity SBUX USEquity DNKN USEquity WEN USEquity DPZ USEquity QSR USEquity
Beta Levered
Fig. 17. McDonald’s Comparables Levered
Beta.
Source: Bloomberg and Analysts estimates. Fig. 16. Real GDP Growth and
forecasts
Source: International Monetary Fund. 0% 1% 2% 3% 4% 201420152016201720182019E2020E2021E2022E2023E2024E World Real GDP Growth
MCDONALD’S COMPANY REPORT
PAGE 9/32
originated in Europe. Under EOTF transformation, International Lead Markets, segment in which the UK is inserted, saw an increase of 5.2% in comparable sales, however, political environment may compromise the way company operates in the location.
Additionally, the fight over climate change, which already has been discussed at a decision level, presents multiple challenges to the company. McDonald’s is struggling regarding plastic usage and its disposable packaging model in an increasingly conscious eco-friendly global economy. According to Financial Time’s, McDonald’s, together with Starbucks, already spent $15 million in a partnership with Closed Loop Partners to pursue sustainable investments.
Industry Outlook
In generic terms, the Restaurant Industry is divided into three main categories: Quick Service Restaurants (QSR) – fast food service, low-cost food at fair quality, up to $8, Casual Dining Restaurants (CSR) – differentiated quality, enjoyable atmosphere, price ranging from $15, and the Quick/Fast Casual Restaurants (QCR), which lies in between. McDonald’s Corporation owns, by operating and franchising, restaurants in the QSR Industry targeting the Informal Eating Out2
(IEO) layer of the market.
In a very compettive market, scale matters. At a time in which the number of guest counts are at low rates, global fast-food companies have beeen intaking aggressive discount strategies, despite rising labour costs and commodity inflation. This strategy has been attracting new layers of the market like low-income consumers, while industry oversupply and rising concerns regarding health care have been shifting Millenials to other options in the Fast Casual segment. The global QSR Industry is expected to grow at 7.61% CAGR, between 2019 and 2026, according to Big Market Research, boosted by delivery, digital and consumer data.
Also, the Restaurant Finance Monitor Index, which improved 16% year-to-date (June 2019), surpassed the 15% of the S&P composite index driven by heavily weighted companies of the sector such as McDonalds, Starbucks, Chipotle, which have been benefiting from the momentum in stock market, rather than company-specifics (Bloomberg Intelligence).
US, Canada, Australia, UK, Hong Kong/China, Japan and New Zealand were the top markets, in per capita value spending, in the QSR industry for the year of 2018, according to Euromonitor. Households spent, on average, between $500 to
2The IEO includes: “casual dining full-service restaurants, street stalls or kiosks, cafés, delivery/ takeaways providers, specialist coffee
shops, self-service cafeterias and juice/smoothies’ bars”. – Passport Euromonitor
Fig. 17. US’s Sales Leading Brands 2012-2017.
MCDONALD’S COMPANY REPORT
PAGE 10/32
$800. The market size for QSR is forecasted to grow at 3.6% CAGR in Eastern Europe, 2% CAGR in Western Europe, 2.6% CAGR in Australasia and 4% CAGR in Latin America, between 2017 and 2022 (Source: Statista).
Technology has been allowing chains to curb the practice of deep dicounting and, more than that, to superior data collection regarding consumers preferences. Mobile Apps, self-order kiosks, order platforms and payment aplications have been helping chains to address customer needs, bring convenience and improving their satisfaction (figure 18).
Delivery has been driven by partnerships to accelerate the process, however, even though this strategy allows for rapid organic growth, the typical fee structure is still very narrow (between 20%-30%) not being sustainable in the long term. Moreover, the lack of company control to elevate the brand over deliveries is almost none, as proven in a study conducted by SeeLevel Hx where 51% of the inquirees alleged to have negative experiences with deliver. Still, as we can see from figure 19, home delivery is a growing industry and McDonald’s is well positioned to take a major steak of the cake.
United States
North America is undoubtedly the strongest market for fast-food industry, both in fast-food meals and in cafeteria services, with a respective CAGR of nearly 2.5% in meals and 3% in coffee shop services, with sales volume above $260 billions in food and $26 billions in cafeteria. Also, according to Zion Market Research, the QSR industry in the US was capped in nearly $540 billion, in 2016, and it is expected to achieve $690 billion in value in 2022, which corresponds to a CAGR of nearly 4.20% over 2016-2022. In order to increase in-store traffic, as well as to capture other segments of the market such as low-income consumers, more sensitive to the price, fast food chains had entered in a massive price war in which McDonalds followed the trend launching in January 2018 the dollar menu. Taco Bell, KFC and Wendy’s are some of the names within the competitors. In a context in which there is customer demand for new approaches to in-store experiences, reengineering facilities with user-technology to bring brand excitement as well as to increase efficiency becomes a priority. Delivering convenience through traffic management in a margin squeeze context highlighted the need of transformation in the industry. Moreover, concerns regarding food quality over millennials and public health alarms rang the bell to reinforce premium-sandwiches, such as shack-and-shack, as local casual dining is evolving.
Europe
The region is shifting from the tradition dinning culture to convenient and flexible options. Even though the differences in market size, predictable growth,
Fig. 19. Home Delivery sales from Limited
Service Restaurants in US
Source: Statista.
Fig. 18. American Customer Satisfaction
Index Scores for Limited Services Restaurant Chains in the US.
Source: Statista. 65 67 69 71 73 75 77 79 81 83 Mc D o n a ld 's KF C Bu rg e r Ki n g Ta co B e ll Do m in o 's We nd y' s St a rb u ck s Pi zz a H u t
Consumer Satisfaction Index
MCDONALD’S COMPANY REPORT
PAGE 11/32
size of the economy and country-specific characteristics, the food landscape in Europe has been affected by the same trends as North America. Also, it is important to bear in mind that 44% of the restaurant sales in US are absorbed by fast food chains, in Europe the share falls between 5% to 13%. To note that European main market are UK, Germany, Netherlands, France, Belgium, Italy, Portugal and Spain, where burgers are the most popular category and where there’s a collective demand for quality and premium. Moreover, according to Aaron Allen Global Restaurants Consultants, only in Western locations, fast-food market is expected to increase $10.3 billion in the next three years.
China
As income is rising in China, the region became a trend setter in foodservice market in which chicken-based meals are preferable to the beef-based menu, McDonalds’s speciality. International chains have been struggling in a market where domestic supply is prepared to fulfil demand. Still, since the beginning, McDonalds was never capable of surpassing YUM! Brands, namely KFC and Pizza Hut, that benefited from early-move competitive advantage. Western influence in the region has boosted demand for fast food: according to ACMR-IBISWorld, in 2019, China is expected to generate $178 bn, an increase of 7.8% in comparison with 2018. Moreover, for the next five years, the revenue of the industry is expected to growth at 8.9% CAGR, over the 2.4 million restaurants.
McDonald’s Comparables
McDonald’s is primarily a franchisor with 93% of the stores under this scheme, in 2018’s year-end, with the remaining 7% (equivalent to 2,770 million stores) remaining under company operations, aiming to achieve 95% franchising structure in the long-term. The company had a market cap of nearly $149 billion, as year-end 2018, with an average price per share of $194. The brand value is estimated to be $130 millions (2019, Statista), placing McDonald’s as one of the most valuable brands worldwide. In 2018 fiscal year, the company billed $96.14 billion in Sales in more than 37,000 stores over 100 locations. US, alone, contributed for nearly 40% of the results, being the company most consolidated market.
RBI
Restaurants Brands International operates in the QSR industry, counting more than 26,000 outlets in over 100 locations. The company operates under three independent brands: Burger King (1954), Tim Hortons (1964, Canada) and Popeyes (1972, US). Burger King has a fully franchised business model directly competing with McDonald’s either in the products offering, target audience and
Fig. 20. McDonald’s Logo.
MCDONALD’S COMPANY REPORT
PAGE 12/32
price mix. As of March 2019, the company accounted $32 billion systemwide sales.
Starbucks
Founded in 1971, and public since 1992, Starbucks is the world’s leading coffeehouse chain, counting 30,000 stores over 80 markets (2019, June). The company’s offers handcrafted premium beverages and coffees, merchandise and fresh bakeries driven by high quality and price point. At year-end 2018, 70% of the sales were from beverages, while 20% from food. Company achieved $5.7 billion in Revenues, owning 100% of US operations, while partially franchising in other geographies.
Yum! Brands
Yum was created as a spin-off of PepsiCo in 1997. It is composed by three main restaurant brands: KFC - chicken-specialized products, Pizza Hut - casual dining ready-to-eat/delivery pizza and Taco Bell - Mexican-style food products. The group manages 49,000 restaurants worldwide, 98% franchised with over $49 billion in systemwide sales (2018). In numbers, the group is the closest competitor to McDonald’s, however this is only possible due to the sum of the parts.
Wendy’s
Founded in 1969, Wendy’s is the third largest quick-service restaurant company in the hamburger sandwich segment. The company has 6,700 restaurants (year-end 2018), with 95% franchised, over 30 countries. Systemwide sales were around $10.5 billions in year-end 2018, equivalent to one tenth of McDonald’s sales. Although the considerably lower dimension, the products/services’ offering and business model (95% - 5% McDonald’s target), makes it a suitable comparable.
Domino’s Pizza
Domino’s Pizza, Inc. is the leading pizza delivery company and the second largest pizza franchise after Yum!. The business is organized into US, international franchise and supply chain. The company is primarily a franchisor owning 15,900 stores, from which 10,038 were internationally franchised. As year-end 2018, Domino’s was in 85 markets. In 2018, the company billed $3.4 billion, reflecting its investments efforts in technology to improve customer experience.
Dunkin’ Brands
Dunkin’ Brands is an American multinational coffee/donut company founded in 1948 that operates under: Dunkin’ and Baskin-Robins brands, specialized in ice-cream. The company offers a wide variety of coffee beverages and baked
Fig. 22. Starbucks Logo.
Fig. 24. Wendy’s Logo.
Fig. 25. Domino’s Pizza Logo.
Fig. 26. Dunkin’ Brands Logo.
MCDONALD’S COMPANY REPORT
PAGE 13/32
goods in more than 20,900 outlets over 60 countries worldwide, 100% franchised. As of 2018’s fiscal year, 76% of systemwide sales ($8.8 billion) were from US, while the remaining $2.2 billion came primarily from the Asian and the Middle East’s franchises.
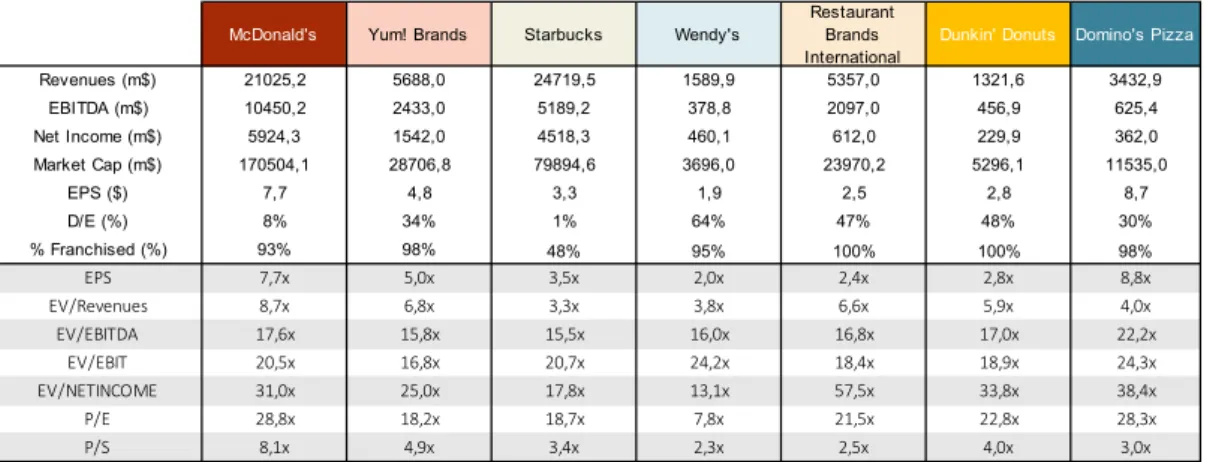
In the table below we can observe additional key financial information for McDonald’s and its peers:
Valuation
We believe that 2025 will be the year in which the VGP will mature, as by then, the 3 pillars will be already established in McDonald’s system, for at least 1 or 2 years (management expects to have EOTF systemwide in 2022). With the Turnaround Plan in 2015 the company set a long-term objective of having 95% of the stores franchised, which, according to our forecasts is expectable to happen in 2024. Additionally, until the target is accomplished, company-operated stores are expected to decrease, on average, 4% until 2024, either because of re-franchising or closing. From 2024 onwards, we predicted modest growth (about 1%) while maintaining the ratio of 95% franchised to 5% company-operated. As we expect comparable sales to be lower in the future, revenues will then depend more on the growth of number of stores, and not so much on sales per store. Therefore, for clarification purposes, in order to value the company, one considered two key metrics: number of stores and sales per store. In order to forecast the number of stores and comparable sales for the future we took into account historical performance, management prespectives and available information on each segment.
Revenue
Franchised sales do not have a direct conversion to franchised revenues, since those last depend on contract terms which are different on the type of franchise, on the country and on the type of agreement between the two parts.In
Fig. 27. McDonald’s and Comparable company’s financial information and multiples. Source: Bloomberg and Company Report.
McDonald's Yum! Brands Starbucks Wendy's
Restaurant Brands International
Dunkin' Donuts Domino's Pizza
Revenues (m$) 21025,2 5688,0 24719,5 1589,9 5357,0 1321,6 3432,9 EBITDA (m$) 10450,2 2433,0 5189,2 378,8 2097,0 456,9 625,4 Net Income (m$) 5924,3 1542,0 4518,3 460,1 612,0 229,9 362,0 Market Cap (m$) 170504,1 28706,8 79894,6 3696,0 23970,2 5296,1 11535,0 EPS ($) 7,7 4,8 3,3 1,9 2,5 2,8 8,7 D/E (%) 8% 34% 1% 64% 47% 48% 30% % Franchised (%) 93% 98% 48% 95% 100% 100% 98% EPS 7,7x 5,0x 3,5x 2,0x 2,4x 2,8x 8,8x EV/Revenues 8,7x 6,8x 3,3x 3,8x 6,6x 5,9x 4,0x EV/EBITDA 17,6x 15,8x 15,5x 16,0x 16,8x 17,0x 22,2x EV/EBIT 20,5x 16,8x 20,7x 24,2x 18,4x 18,9x 24,3x EV/NETINCOME 31,0x 25,0x 17,8x 13,1x 57,5x 33,8x 38,4x P/E 28,8x 18,2x 18,7x 7,8x 21,5x 22,8x 28,3x P/S 8,1x 4,9x 3,4x 2,3x 2,5x 4,0x 3,0x
MCDONALD’S COMPANY REPORT
PAGE 14/32
our analysis, we took into consideration two effects: the historic percentage of revenues over sales per segment and the percentage of franchised stores. First, we believe that sales is the best driver for franchised revenues because rent and royalties depend on sales. Second, the historic percentage of revenues over sales for the past is a fair enough estimator available in this context. Looking to the history, the higher the percentage of franchised restaurants in the segment, the lower the revenues of those restaurants as percentage of sales. Taking this into account, we used historical values for segments that were 95% franchised and discounted the ones that weren’t yet 95% franchised until they reach the long-term objective.
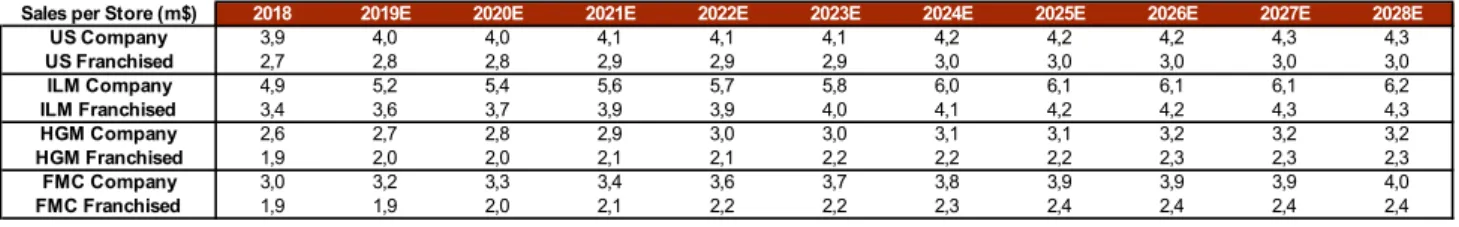
Sales per Store
Systemwide sales represent all the sales within the system (company-operated and franchised), which, according to the company Annual Report, is expected to grow 3% to 5% in the long-term. For the next six years (until 2024) we forecasted systemwide sales to grow, on average, 3.5% mainly driven by HGM, which are expected to increase 5.6%, whereas ILM and FMC will grow around 3.9% and US 1.7%.
Sales per Store (SpS) were estimated based on the previous year SpS adjusted for the current year comparable sales. Note that comparable sales correspond to the annual sales variation of each store opened by more than 13
months3, and it represents the combination of guests counts and price mix. For
clarification purposes: “Guest Counts” are the change in the number of transactions compared with the previous period and “Price Mix” is the difference in average money spent, per transaction, compared with the previous year.
3In this context it was assumed the growth to be equal for every store, by default.
Fig. 29. Sales per Store by Segment in millions of dollars. Source: Company Report and Analysts Estimates.
Fig. 28. Systemwide Sales and Segment Revenues in millions of dollars. Source: Company Report and Analysts Estimates.
Millions of $ 2018 2019E 2020E 2021E 2022E 2023E 2024E 2025E 2026E 2027E 2028E
Systemwide Sales 87 786 82 714 85 002 90 910 96 147 101 263 104 831 108 372 111 600 114 841 118 018
US Revenues 7 666 7 871 7 965 8 073 8 183 8 307 8 432 8 534 8 637 8 741 8 845 ILM Revenues 7 600 7 540 7 270 7 179 7 055 7 074 7 284 7 443 7 568 7 656 7 745 HGM Revenues 3 989 3 755 3 509 3 356 3 226 3 069 2 840 2 942 3 046 3 136 3 227 FMC Revenues 1 771 2 083 2 411 2 755 3 107 3 464 3 839 3 960 4 045 4 090 4 136
Sales per Store (m$) 2018 2019E 2020E 2021E 2022E 2023E 2024E 2025E 2026E 2027E 2028E
US Company 3,9 4,0 4,0 4,1 4,1 4,1 4,2 4,2 4,2 4,3 4,3 US Franchised 2,7 2,8 2,8 2,9 2,9 2,9 3,0 3,0 3,0 3,0 3,0 ILM Company 4,9 5,2 5,4 5,6 5,7 5,8 6,0 6,1 6,1 6,1 6,2 ILM Franchised 3,4 3,6 3,7 3,9 3,9 4,0 4,1 4,2 4,2 4,3 4,3 HGM Company 2,6 2,7 2,8 2,9 3,0 3,0 3,1 3,1 3,2 3,2 3,2 HGM Franchised 1,9 2,0 2,0 2,1 2,1 2,2 2,2 2,2 2,3 2,3 2,3 FMC Company 3,0 3,2 3,3 3,4 3,6 3,7 3,8 3,9 3,9 3,9 4,0 FMC Franchised 1,9 1,9 2,0 2,1 2,2 2,2 2,3 2,4 2,4 2,4 2,4
MCDONALD’S COMPANY REPORT
PAGE 15/32
United States
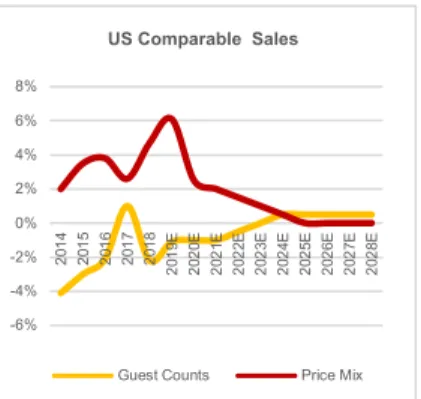
In 2018, the US segment surpassed the company long-term objective by being 95,1% franchised. The number of stores have been decreasing 200, on average, per year, since 2015, driven by the decrease in company-operated stores. Still, in the long term, in order to succeed, and in accordance with the company “convenience” purpose, we believe McDonald’s will continue to slowly expand the number of stores for the segment, either by openning solely pick-up stores or indepent McCafé brunches. Guest counts have been ranging from -4% to 1%, since 2014, with the exception being 2017 (figure 30), evidenciating a negative tendency in the number of transactions. However, by 2024, we believe this tendency will invert with all the company efforts to encourage repetead purchases under the Velocity Growth Plan. Moreover, fierce competition in the QSR industry forced McDonald’s to engage in promotions and meals at affordable prices, still price/mix has been unterruptly expanding, mainly driven by the increases in menu prices and by delivery higher average check. We can also observe on figure 31 that consumers are spending more on the QSR industry, which can also explain the increases in the price/mix. Even so, we believe its will peak in 2019 and will decrease afterwards, stabilizing after 2025. The reason for our expectation is
momentum: as the company launched delivery, there was an increasing hype; but
as the number of stores offering delivery stabilizes and as peers will take more attention to the potencial of delivery, the hype will also decrease, competition will increase and price/mix will slowdown.
International Lead Markets
International Lead Markets represents countries where McDonald’s is already well established. McDonald's is market leader in the UK, France, Germany, Australia and number two in Canada. We consider to maintain its leadership, as well as to meet the company’s franchising long-term target, there will be incentives to continue to expand even further the number of stores. Only in France, the company expects to open around 400-500 stores, by 2025. As of year-end 2018, McDonald’s operated 816 stores and franchised 6,171 stores, which corresponds to a 88.3% structure franchised. We believe the company will be able to meet its target in 2023, mainly driven by the reduction in company-operated stores (at an average rate of 14% until 2023) while slightly increasing the number of franchisees, at an average rate of 2%, for the same period of analysis (figure 32). Furthermore, as EOTF reaches all the stores, the hype over the new restaurants will fade away and competitiors most problably also will add self-order kiosks, revamp their stores, so, in the long-term, comparable sales will most likely lower.
Fig. 30. US Comparable Sales Evolution. Source: Bloomberg and Analysts Estimates.
Fig. 32. ILM Stores.
Source: Bloomberg and Analysts Estimates. Fig. 31. US Consumer Spending in QSR. Source: Statista 0 1,000 2,000 3,000 4,000 5,000 6,000 7,000 8,000 20 14 20 15 20 16 20 17 20 18 20 19 E 20 20 E 20 21 E 20 22 E 20 23 E 20 24 E 20 25 E 20 26 E 20 27 E 20 28 E ILM Stores
Company-operated Stores Franchised Stores -6% -4% -2% 0% 2% 4% 6% 8% 20 14 20 15 20 16 20 17 20 18 20 19 E 20 20 E 20 21 E 20 22 E 20 23 E 20 24 E 20 25 E 20 26 E 20 27 E 20 28 E US Comparable Sales
Guest Counts Price Mix
$ 240 $ 250 $ 260 $ 270 $ 280 $ 290 $ 300 $ 310 2014 2015 2016 2017 2018 Bi lli on s US Consumer Spending in QSR
MCDONALD’S COMPANY REPORT
PAGE 16/32
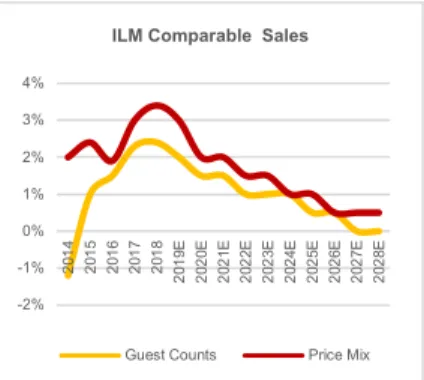
The price mix has been high for International Lead Markets (figure 33), mostly due to the expansion of the delivery in Europe and Australia, fueled by the partnership with UberEats. In the Annual Report of 2018, the company stated that France and the UK had double digit sales increase in delivery, also mentioning that those purchases have 1.5 to 2 times higher average price per transaction. As a significant part of the orders are done late at night, it was observerd that consumers are willing to spend more, thus contributing to the increase in price mix. Moreover, concerns regarding food quality and sustainability are expected to increase and quality will be most likely to be reflected into menu’s price increase. We believe price mix will continue to be positive but at a slower pace, as the company needs to accommodate quickly consumers requests, in a context where there isn't a consolidated delivery system besides outsources like Uber Eats and where environmental issues regarding the menu are not solutioned yet. Also, the idea of catching up high segments made the company launch "McDonalds Signature" offering premium burgers with more quality at higher prices. As demand for premium burgers increases in Europe, this leads to an average higher price mix. However, as the excitement of digital goes by and delivery reaches all the markets, we believe that price mix will slow down.
High Growth Markets
High Growth Markets are composed by countries in which McDonald's isn't yet fully established, being the main markets China, Italy, Korea, Netherlands, Poland, Russia, Spain, Switzerland, and related markets. Only 82.7% of the restaurants are franchised in the segment and we expect that the target of 95% to be achieved in 2024 (figure 34). Between 2013 and 2018, McDonald's sales historic CAGR have been around 3.8% in Western Europe, 7.8% in Latin America, 10% in Middle East and Africa and around 5.3% in Asia Pacific (Euromonitor). Also, according to the same source, China is forwarded to be McCafé's largest contributor to growth as the proliferation of coffee consumption in China's middle class is expanding. We believe that this growth can only be sustained by the constant increase in the number of stores, mainly franchisings, while repassing company-operated restaurants. The number of stores have been growing close to 5.5% per year (320 stores/year). In 2019, half of the total stores that the company expected to open were located in China, meaning that we should observe an aggressive increase in 2019, compared with the previous years. Therefore we estimated 400 new net stores, in 2019, for this segment.
With the delivery success across HGM, specially in China, and with the integration of the app WeChat, we believe that price mix will be 2.5% in 2020 (figure 35) and will start decreasing as EOTF and digital become more common
Fig. 33. ILM Comparable Sales. Source: Bloomberg and Analysts Estimates.
Fig. 34. HGM Stores.
Source: Bloomberg and Analysts Estimates. 0 1,000 2,000 3,000 4,000 5,000 6,000 7,000 8,000 9,000 20 14 20 15 20 16 20 17 20 18 20 19 E 20 20 E 20 21 E 20 22 E 20 23 E 20 24 E 20 25 E 20 26 E 20 27 E 20 28 E HGM Stores
Company-operated Stores Franchised Stores
-4.00% -3.00% -2.00% -1.00% 0.00% 1.00% 2.00% 3.00% 4.00% 5.00% 20 14 20 15 20 16 20 17 20 18 20 19 E 20 20 E 20 21 E 20 22 E 20 23 E 20 24 E 20 25 E 20 26 E 20 27 E 20 28 E HGM Comparable Sales
Guest Counts Price Mix
Fig. 35. HGM Comparable Sales. Source: Bloomberg and Analysts Estimates.
-2% -1% 0% 1% 2% 3% 4% 20 14 20 15 20 16 20 17 20 18 20 19 E 20 20 E 20 21 E 20 22 E 20 23 E 20 24 E 20 25 E 20 26 E 20 27 E 20 28 E
ILM Comparable Sales
MCDONALD’S COMPANY REPORT
PAGE 17/32
not only in the McDonald’s stores but also in its peers.. In terms of guest count, it has been negative in the past with a sudden recovery in 2017. From 2014 to 2016, guest counts have been negative, increasing by 1.8%, in 2017 and 2018. Specially in Asia, coffe shops have a lot of traffic and McDonald's is able to leverage McCafé to drive guest counts higher while revamping stores to increase visits.
Foundational Markets and Corporate
This segment is composed by dispersed markets, in which the most relevant are Brazil, Japan, Taiwan, Phillippines and also where the firm reports corporate activity. In 2018 this segment was already 98% franchised, unlike the others, making us believe that this value will revert to the 95% in the long-term (figure 36). The number of stores have been increasing slightly and we believe it will continue that way because this segment is neither the high growth and neither the stablished market, it is composed by fragmented markets that are not expected to grow much. Guest counts increased to positive territory in 2016 due to the effectiveness of the velocity growth plan.
Brazil responded very well to the EOTF and self-ordering kiosks, specially because it happened after the crisis, in 2014, where people had to spend with caution and McDonald’s appeared with affordable and convenient meals. Also, in Phillippines McDonald's launched NXTGEN stores that feature modern design, self-ordering kiosks and cashless payments. The success was obvious and there are more stores opening in the following years. All of this contributes to positive guest counts.
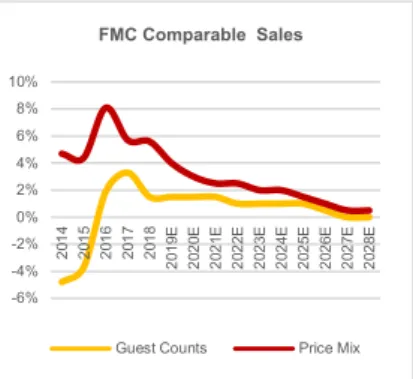
Price mix has been very high since 2014 (figure 37), even before the effect of the Turnaround Plan in 2015. This puts the baseline very high and much above the baseline of the other segments. This may be explained by the sales per store which is only $1.89 million in 2018 versus $3.57 million in HGM, for example. We believe that, as delivery expands to more markets and as the digital app gets to more customers, there will be higher spending per visit. It also makes sense that sales per store converges with other segments and for that to happen, comparable sales have to be higher than the other segments.
Operating Margin Analysis
In order to analyse the cost structure of the company it is important to look to company-operated and franchised restaurants separately, since both have different margins structure. Still, there are cost such as SG&A that affect both the company-operated and franchised restaurants. In company-operated restaurants there are 3 types of costs (figure 38): “Food and Paper”, “Payroll and Employee
Fig. 37. FMC Comparable Sales. Source: Bloomberg and Analysts Estimates. Fig. 36. FMC Stores.
Source: Bloomberg and Analysts Estimates. 0 2,000 4,000 6,000 8,000 10,000 12,000 20 14 20 15 20 16 20 17 20 18 20 19 E 20 20 E 20 21 E 20 22 E 20 23 E 20 24 E 20 25 E 20 26 E 20 27 E 20 28 E FMC Stores
Company-operated Stores Franchised Stores
-6% -4% -2% 0% 2% 4% 6% 8% 10% 20 14 20 15 20 16 20 17 20 18 20 19 E 20 20 E 20 21 E 20 22 E 20 23 E 20 24 E 20 25 E 20 26 E 20 27 E 20 28 E FMC Comparable Sales
MCDONALD’S COMPANY REPORT
PAGE 18/32
benefits” and “Other Occupancy and Operating Expenses”, while, for franchises, there are only “Occupancy Expenses” (figure 41).
Food and Paper
Food and Paper costs are tied with a basket of 10 commodities that represent 75% of those costs. We gathered data from World Bank on some commodities that we believe to be representative of the costs of McDonald’s (figure 39). We can observe that in 2019 most of the commodities are expected to go down, however, the company announced in the quarterly reports that Food and Paper are expected to increase around 2% to 3% in 2019. We believe that the change behind this increase is the beef price, which is expected to increase 8%, in 2019. From 2019 onwards the commodities increase at around 2% but beef, one of the main commodities, decreases at 1% a year, on nominal prices. Taking into account that revenues increase already takes into account inflation (through price/mix), we expect Food and Paper, as percentage of company-operated Revenues, to be constant from 2019 onwards.
Payroll and employee benefits
In order to estimate Payroll and employee benefits we related this cost with the number of employees working for the company (figure 40). The number of employees is mainly related with company-operated restaurants and that’s why it has been decreasing over the last years and we still forecast a further reduction until the company becomes 95% franchised. We also forecasted the payroll and employee benefit per employee to increase slightly in the future because of competitive labour market and pressures on wage increases. According with the Financial Times article “Rising global labour costs poised to hit equity markets”, by Steve Johnson, global unemployment has fallen to its lowest level since 1970; Due to this fact, the labour market has become increasingly competitive and the growth in productivity is no longer higher than the growth in wages like it used to be in the past. The trend we are observing now is more share of GDP going towards employees and less share of GDP going towards companies. Hence, we believe that in the long-term this trend will continue and raise the payroll costs. Other occupancy and operating expenses
Other occupancy and operating expenses are related with depreciation, lease expenses and other occupancy costs that company-operated restaurants incur. Briefly, in order to forecast these costs, we compared them on a per store level over the past years and we forecasted what those per store costs would be in the future. In figure 41, we observe that these costs have been decreasing, but we expect them to go up as percentage of company-operated revenues, since we
Fig. 39. Commodities nominal growth rate. Source: World Bank.
Fig.40. Payroll and Number of Employee
evolution.
Source: Company Report and Analysts Estimates.
Fig.38. Cost as % of Revenues Evolution. Source: Company Reports and Analysts Estimates.
2019E 2020E 2021E 2022E 2023E 2024E 2025E
Crude oil, avg -12% -3% 2% 2% 2% 2% 2%
Coffee, Arabica -4% 2% 2% 2% 2% 2% 2% Coffee, Robusta -13% 3% 3% 3% 3% 3% 3% Wheat, US, HRW -5% 2% 2% 2% 2% 2% 2% Meat, beef 8% -1% -1% -1% -1% -1% -1% Meat, chicken -11% 1% 1% 1% 1% 1% 1% Cocoa 0% 2% 2% 2% 2% 2% 2% Sugar 2% 3% 3% 3% 3% 3% 3%
Fig. 41. Company-Operated Occupancy
Expenses as % of Revenues.
Source: Company Reports and Analysts Estimates 0 100 200 300 400 500 $0 $1 $2 $3 $4 $5 2014201620182020E 2022 E 2024 E 2026 E 2028 E Thous ands Bi lli on s
Employees and Payroll Expenses
Payroll and Employee Benefits Nº of Employees 15% 20% 25% 30% 35% 40% 201420152016201720182019E 2020 E 2021 E 2022 E 2023 E 2024 E 2025 E 2026 E 2027 E 2028 E Company-operated Costs to Revenues
Food & Paper Payroll & employee benefits Other occupancy and operating expenses
10% 12% 14% 16% 18% 20% 22% 24% 26% 20 14 20 15 20 16 20 17 20 18 20 19 E 20 20 E 20 21 E 20 22 E 20 23 E 20 24 E 20 25 E 20 26 E 20 27 E 20 28 E
Other occupancy and operating expenses
MCDONALD’S COMPANY REPORT
PAGE 19/32
believe the decrease was artificially generated in response to high number of closed company-operated stores, which is expected to return to previous levels in the long term. Also, as we can observe on figure 42, the global real house index has been increasing which mean that the tendency is for lease expenses to continue to go up as real estate also gets more expensive, especially in big cities. Franchised occupancy expenses
From McDonald’s perspective, franchised restaurants only have one associated cost: the occupancy expense. In this line it is included depreciation from franchised restaurants, leases expense and other occupancy operating expenses. We compared these costs with the revenue from franchised restaurants in order to understand how the margin has changed (figure 43). We can see that these costs represent about 15% to 16% of franchised revenues and we estimate that, in the long run, these costs will increase slightly in relative terms. Additionally, according to the International Monetary Fund (figure 42), the real house index has been increasing in the past years and we believe this trend will continue, especially on less developed countries, leading occupancy costs to increase and thus decrease McDonald’s margins.
Selling, General and Administrative (SG&A)
The company refers in its annual reports that SG&A should be benchmarked with total revenues (figure 44) because it relates with both company-operated and franchised restaurants. We forecasted these costs to increase slightly in the following years as a percentage of total revenues since we believe the company will continue its strategy of acquiring new digital companies such as Apprente and Dynamic Yield (which are registered in SG&A). According to former CEO Steve Easterbrook, the next step after the investment in EOTF restaurants is to use software to improve the customer experience. This means that the EOTF provided the infrastructure necessary to create a bridge to the age of the digital, and the objective is to use this bridge to further improve the customer relationship with the brand. Furthermore, continuous investment in digital products and companies is the way to get the most benefit from the infrastructure already built, but that also requires extra spending which is registered on SG&A.
Capital Expenditures
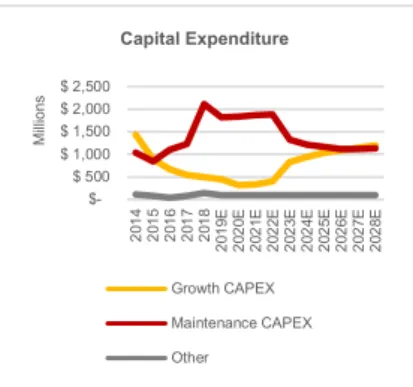
In the last couple of years, the structure of the capital expenditure of the company has been changing. There are two main forms of capital expenditures: the growth capex, which represents the investment in new units, and the
Fig. 43. SG&A as percentage of total
revenues.
Source: Company Reports and Analysts Estimates
Fig. 42. Global Real House Index. Source: IMF.
Fig. 44. SG&A as percentage of total
revenues.
Source: Company Report and Analysts Estimates. 0% 1% 2% 3% 4% 5% 6% 7% 20 14 20 15 20 16 20 17 20 18 20 19 E 20 20 E 20 21 E 20 22 E 20 23 E 20 24 E 20 25 E 20 26 E 20 27 E 20 28 E
SG&A as % of Total Revenues 90 100 110 120 130 140 150 160 170 2000q 1 2001q 2 2002q 3 2003q 4 2005q 1 2006q 2 2007q 3 2008q 4 2010q 1 2011q 2 2012q 3 2013q 4 2015q 1 2016q 2 2017q 3 2018q 4
Global Real House Index
10% 11% 12% 13% 14% 15% 16% 17% 20 14 20 15 20 16 20 17 20 18 20 19 E 20 20 E 20 21 E 20 22 E 20 23 E 20 24 E 20 25 E 20 26 E 20 27 E 20 28 E
Franchised Restaurants Occupancy Expenses as % of Franchised
MCDONALD’S COMPANY REPORT
PAGE 20/32
maintenance capex, which represents the investment on current stores (including the EOTF re-modelling).
From 2014 until 2018, it is observable in figure 45 that the majority of the capex switched from growth to maintenance capex, as a result of the high investment need to re-model all the restaurants for “The Experience of the Future”. We believe that, in the short-term, the maintenance capex will continue to be higher, as the company continues to re-model its restaurants. In the long run we believe that growth capex will catch up with maintenance capex since we believe that the company will continue to invest in its restaurants and implement new features and more technology, while also growing the number of restaurants across the system. Working Capital
Comparing to its peers, McDonald’s seems to be doing very well in terms of working capital. If we look to figure 46 and 47, we conclude that while the comparable companies have an average of 25 days of cash conversion cycle, in 2018, McDonald’s has -7 days, meaning that they receive from clients 7 days before paying to suppliers. We believe that the reason for this to happen is related with the bargaining power of the company in result of their operations’ volume. It is also observable, in figure 47, that both collecting period and payable period has been increasing over the period of analysis.
We believe that, one of the possible reasons for receivables have been increasing over time is because, while the company re-franchises, the clients stop being the consumers and start being the franchisees, meaning that instead of receiving right on the spot, the company is now receiving in the form of rents and royalties that have a specific period in which they can be paid. The payable period had also increased, and we believe the reason for this to happen behind is even more bargaining power over suppliers. Although there are more franchised restaurants now, it is still the parent company who chooses suppliers; this might be giving an edge to company-operated restaurants for better terms on the payable period. This way, we believe that in the future McDonald’s will continue to outperform its peers on the cash conversion cycle, following the results achieved in 2018.
Fig. 45. Capital Expenditure Evolution. Source: Company Report and Analysts Estimates
Fig. 46. Cash Conversion Cycle. Source: Bloomberg and Analyst Estimates.
Fig. 47. Cash Conversion Cycle.
Source: Company Reports and Analyst Estimates.
2014 2015 2016 2017 2018 2019E 2020E 2021E 2022E 2023E 2024E 2025E 2026E 2027E 2028E
Collecting Period 16 18 21 28 38 38 38 38 38 38 38 38 38 38 38
Holding Period 3 3 2 2 2 2 2 2 2 2 2 2 2 2 2
Payable Period 21 23 24 30 47 47 47 47 47 47 47 47 47 47 47
Cash Conversion Cycle -2 -2 -1 0 -7 -7 -7 -7 -7 -7 -7 -7 -7 -7 -7
Year of 2018 WEN US Equity DNKN US Equity SBUX US Equity DPZ US Equity QSR US Equity YUM US Equity Collecting Period 25 35 6 47 22 33 Holding Period 1 1 10 77 4 2 Payable Period 5 14 9 68 6 13
Cash Conversion Cycle 21 21 7 56 20 22
$ 500 $ 1,000 $ 1,500 $ 2,000 $ 2,500 20 14 20 15 20 16 20 17 20 18 20 19 E 20 20 E 20 21 E 20 22 E 20 23 E 20 24 E 20 25 E 20 26 E 20 27 E 20 28 E Mi lli on s Capital Expenditure Growth CAPEX Maintenance CAPEX Other
MCDONALD’S COMPANY REPORT
PAGE 21/32
Long-Term Debt
In the past few years McDonald’s has been loading on debt, mainly using it for stock repurchasing and dividend payments. Even though the company generates enough cash flow to return cash to shareholders, it doesn’t generate enough for the amount of stock that the company has been repurchasing. From figure 48 it is observable that net debt almost tripled from $13 billions, in 2014, to $30 billions, in 2018. Although this aggressive strategy has been paying up, raising the stock price from $94 a share, in January 2014, to nearly $180, in December 2018, is something that we consider dangerous, since the debt has been mainly used to return cash to shareholders and not to grow the business (through even more investment). In November 2015 Moody’s downgraded the rating of McDonald’s from A3 to Baa1 after the company announcement that it would return $30 billions to shareholders from 2014 until 2016, where previous shareholder return targets were around $20 billions. Moody’s also described that ratios of debt to EBITDA below 3.25x and EBIT to interest above 6x would result in a future upgrade to the rating. On the other hand, a level below 3.75x debt to EBITDA and EBIT to interest close to 4x would result in a further downgrade to the rating. We believe that, in the long-term, the company will meet the ratios required to return to its previous rating (A3), and therefore We fixed the debt to EBITDA in 3.21x level. Consequently, the interest coverage ratio is expected to be around 8x (figure 49). The debt to EBITDA ratio of 3.21x is the expected for 2019 taking into account the target of $25 billions that the company should be returning to its shareholders from 2016 until 2019 through stock repurchases and dividends. The debt ratios target that we estimated will, however, require less future stock buybacks. Even so, we believe that the board of McDonald’s wouldn’t allow for such a prestigious company to be downgraded to a junk bond.
Shareholder Structure
As of 2019’s January 31, the number of shareholders of record and beneficial owners of the Company’s stock was estimated to be 2,150,000. Due to its sizable market cap, volume in operations and international character of revenues, McDonald’s assumes a significant role in the industry integrating some of the most relevant indexes: the Dow Jones Industrial/Composite Average (DJIA/DJCA), S&P 100, S&P 500 and S&P 500 Consumer Discretionary. McDonald’s stock clearly outperforms the S&P 500 and DJIA, from 2014 to 2019 (figure 49), which can be explained, in part, by the company efforts on returning money to shareholders either through dividends payment on common stock, either from stock repurchasing, increasing in value of the company’s shares. In 2019 it was
Fig. 49. McDonald’s Debt Ratios. Source: Company Report and Analysts Estimates
Fig. 48. McDonald’s Net Debt. Source: Company Report and Analysts Estimates
Fig. 50. Cumulative Return. Source: Company Report.
00x 02x 04x 06x 08x 10x 12x 14x 16x 20182019E 2020 E 2021 E 2022 E 2023 E 2024 E 2025 E 2026 E 2027 E 2028 E Debt Ratios
Net Debt to EBITDA EBIT to Interest $5 $10 $15 $20 $25 $30 $35 $40 $45 2014 2016 20182020E2022E2024E2026E2028E Bi lli ons Net Debt 0 50 100 150 200 250 2014 2015 2016 2017 2018 2019 5-Years Cumulative Total Return
McDonald's S&P500 Index Dow Jones Industrials