CERN-EP/2016-324 2017/07/13
CMS-TOP-12-039
Search for associated production of a Z boson with a single
top quark and for tZ flavour-changing interactions in pp
collisions at
√
s
=
8 TeV
The CMS Collaboration
∗Abstract
A search for the production of a single top quark in association with a Z boson is presented, both to identify the expected standard model process and to search for flavour-changing neutral current interactions. The data sample corresponds to an
integrated luminosity of 19.7 fb−1 recorded by the CMS experiment at the LHC in
proton-proton collisions at √s = 8 TeV. Final states with three leptons (electrons
or muons) and at least one jet are investigated. An events yield compatible with tZq standard model production is observed, and the corresponding cross section is measured to be σ(pp → tZq → `νb`+`−q) = 10+−87fb with a significance of 2.4
standard deviations. No presence of flavour-changing neutral current production of tZq is observed. Exclusion limits at 95% confidence level on the branching fractions of a top quark decaying to a Z boson and an up or a charm quark are found to be
B(t→Zu) <0.022% andB(t→Zc) <0.049%.
Published in the Journal of High Energy Physics as doi:10.1007/JHEP07(2017)003.
c
2017 CERN for the benefit of the CMS Collaboration. CC-BY-3.0 license
∗See Appendix A for the list of collaboration members
1
Introduction
The top quark is the most massive particle in the standard model (SM) of particle physics. Since its discovery in 1995 [1, 2], considerable advances have been made in understanding its properties. At hadron colliders top quarks arise predominantly from the production of top quark-antiquark (tt) pairs through the strong interaction. However, top quarks may also be produced singly from electroweak processes through three different production mechanisms. These are categorised by the virtuality of the W boson involved in the interaction: t-channel, s-channel and associated tW production. At the CERN LHC, the t- and tW channel produc-tion have been observed by the ATLAS and CMS Collaboraproduc-tions and their cross secproduc-tions have been measured at both 7 and 8 TeV, respectively [3–8]. The ATLAS and CMS Collaborations have recently published results of searches for s-channel single top quark production using 8 TeV data [9, 10]. The high integrated luminosity and centre-of-mass energy at the LHC mo-tivate the search for rare SM single top quark production processes, such as the production of a single top quark in association with a Z boson, where the top quark is produced via the t channel and the Z boson is either radiated off one of the participating quarks or produced via W boson fusion (Fig. 1). These production mechanisms, referred to here as tZq-SM pro-duction, lead to a signature with a single top quark, a Z boson, and an additional quark. The process is sensitive to the coupling of the top quark to the Z boson, as illustrated in Fig. 1(middle-right). It is also related to WZ boson production, as can be seen in Fig. 1(bottom-left). Thus, the observation of tZq production and the subsequent measurement of the produc-tion cross secproduc-tion represent a test of the SM. The predicted tZq-SM producproduc-tion cross secproduc-tion for proton-proton collisions at a centre-of-mass energy of 8 TeV, at next-to-leading order (NLO), is σ(pp→tZq) =236+−114 (scale)±11 (PDF) fb [11], where t denotes either a top quark or an-tiquark. The first uncertainty is associated with the renormalisation and factorisation scales used, and the second one is associated with the choice of parton distribution functions (PDFs). The CTEQ6M set of PDFs [12] is used to determine the predicted cross section. The cross sec-tion of the three-lepton final state, σ(pp → t`+`−q) B(t → `
νb), where` denotes a charged
lepton (electron, muon, or tau), is calculated to be
σ(pp→t`+`−q) B(t→ `νb) =8.2 fb
with a theoretical uncertainty of less than 10%. The calculation is made in the five-flavour
scheme, where b quarks are considered as coming from the interacting protons, with MAD
-GRAPH5 aMC@NLO[13], using the NNPDF (version 2) PDF set [14]. This includes lepton pairs
from off-shell Z bosons with an invariant mass m`+`− >50 GeV. This cross section is used as a
reference in this paper. The ATLAS and CMS Collaborations have published results searching for ttZ production, which is also sensitive to the coupling of the top quark to the Z boson [15– 18]. A production cross section of σ(pp → ttZ) = 200−+8070(stat)+−4030(syst) fb was measured by CMS at 8 TeV [16]. Within the SM, any flavour-changing neutral current (FCNC) involving the top quark and the Z boson, referred to here as tZ-FCNC, is forbidden at tree level and is sup-pressed at higher orders because of the GIM mechanism [19]. Some SM extensions, such as R-parity violating supersymmetric models [20], top-colour assisted technicolour models [21] and singlet quark models [22], predict enhancements of the FCNC branching fraction, which
could be as large as O(10−4) [23]. The production of a single top quark in association with
a Z boson is sensitive to both tZq and tgq anomalous couplings [23–25] as shown in Figs. 2
and 3. Searches for FCNC in the top quark sector have already been performed at the
Fer-milab Tevatron [26, 27] and at the LHC. The ATLAS Collaboration performed searches for anomalous tgq couplings [28] and the CMS Collaboration performed searches for tγq anoma-lous couplings [29], while both the ATLAS and CMS Collaborations performed searches for
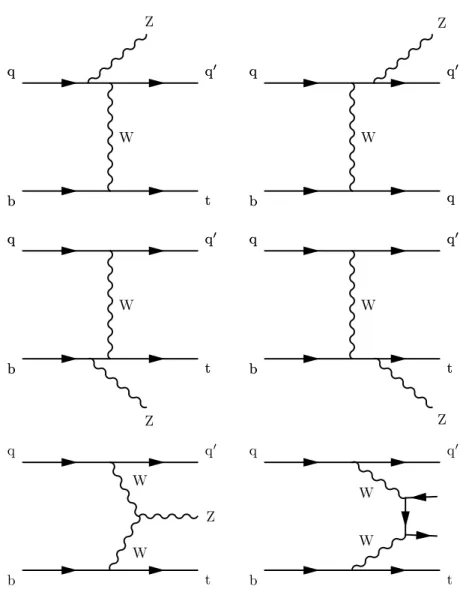
2 1 Introduction W b q t q0 b q t q0 Z W b q q q0 b q q q0 Z W b q t q0 b q t q0 Z W b q t q0 b q t q0 Z W W b q t q0 Z W W b q t q0
Figure 1: Leading-order tZq production Feynman diagrams (all but bottom-right). The
initial-and final-state quarks denoted q initial-and q0 are predominantly first generation quarks, although
there are smaller additional contributions from strange- and charm-initiated diagrams. The bottom-right diagram represents the NLO nonresonant contribution to the tZq process.
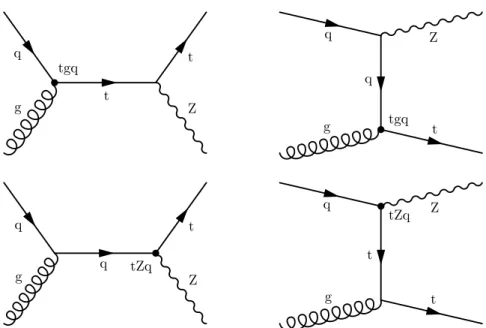
g q t t Z tgq g q q Z t tgq g q q t Z tZq g q t Z t tZq
Figure 2: Feynman diagrams for the production of tZ in tZ-FCNC channels.
g g ¯t g t Z q tZq
4 2 Theoretical framework
tZq anomalous couplings [30, 31]. The most stringent exclusion limit at 95% confidence level
(CL) on the branching fraction B(t → Zq), set by the CMS Collaboration, excludes
branch-ing fractions greater than 0.05% [31]. In this paper, two separate searches, usbranch-ing similar event selections and background estimates, are presented: a search for tZq-SM production and a search for tZ-FCNC production from anomalous couplings. Both searches are performed using a data set of proton-proton collisions at a centre-of-mass energy of 8 TeV, corresponding to an
integrated luminosity of 19.7 fb−1. In tZq-SM production, because the processes involved are
based on t-channel single top quark production, the signature consists of a single top quark, a Z boson, and an additional jet preferentially emitted in the forward region of the detector
(absolute pseudorapidity|η| > 2.4). The search for tZ-FCNC is performed by combining the
single top quark and tt production modes. The single top quark production leads to a signa-ture containing a top quark and a Z boson (single-top-quark-FCNC) with no extra jets from the matrix-element calculation. For the tt production mode (tt-FCNC), the FCNC vertex appears in the decay of the top quark, and leads to the same signature as for tZq-SM, but with the jet not associated with the b quark being produced in the central region of the detector. Both searches are performed in the trilepton final state, where both the W boson from the top quark and the Z boson decay into either electrons or muons, resulting in four possible leptonic combinations in the final state: eee, µµµ, µµe, and eeµ. As they are not specifically excluded, there is also a contribution from leptonic τ decays. The main sources of background to these searches are tt production, single top quark production, diboson production, ttV (V = W or Z) and Drell– Yan (DY) production. The tZq-SM production is a key irreducible background to the FCNC search. The discrimination between signal and background is achieved using a boosted deci-sion tree (BDT) and the nonprompt backgrounds are estimated from the data, whereas other backgrounds are estimated from simulation using constraints from data.
2
Theoretical framework
The generation of the tZq-SM events is performed at NLO using the MADGRAPH5 aMC@NLO
v5.1.3.30 generator [13]. For the tZ-FCNC production, the description and generation of signal events follow the strategy detailed in Ref. [25]. The generation is achieved by describing the relevant interactions in terms of a set of effective operators that are independent of the under-lying theory. The searches are thus performed in a model-independent way. The signature corresponding to the tZ-FCNC processes can be produced both via strong tgq and weak tZq couplings, as illustrated in Fig. 2. The tt-FCNC production, where the anomalous coupling appears in the top quark decay, is presented in Fig. 3. Both of these production modes can be
incorporated into the SM LagrangianLusing effective operators of dimensions 4 and 5 [25]:
L =
∑
q=u,c h√ 2gs κtgq Λ ¯tσµνTa(fqLPL+ fqRPR)qGaµν + √g 2cW κtZq Λ ¯tσµν(ˆfqLPL+ ˆfqRPR)qZµν + g 4cW ζtZq¯tγµ(¯fqLPL+ ¯fqRPR)qZµ i + h.c. (1)The effects of new physics contributions are quantified through the dimensionless parameters
κtgq, κtZq, and ζtZq together with the complex chiral parameters fL,Rq , ˆfL,Rq , and ¯fL,Rq , which
can be constrained as |fL
q|2+ |fqR|2 = |ˆfqL|2+ |ˆfqR|2 = |¯fqL|2+ |¯fqR|2 = 1. The energy scale
at which these effects are assumed to be relevant is parametrised by Λ. The two couplings
four couplings to the Z boson, κtZu/Λ, ζtZu, κtZc/Λ, and ζtZc relate to the diagrams shown
at the bottom of Fig. 2. The anomalous couplings related to the weak and strong sectors are assumed to be independent of each other, although interference is expected to occur between the κtZq/Λ and ζtZqcontributions. The sensitivity to the κtgq/Λ coupling is poor in comparison
to other channels [28], while ζtZq couplings lead to very small cross sections [25]. For these
reasons we consider here only cases where κtZq/Λ6=0, while setting ζtZq=0 and κtgq/Λ=0.
Furthermore, the interference between single top quark and tt-FCNC processes is neglected and the 4 fermion interactions are not included in this analysis [32].
3
CMS detector
The central feature of the CMS apparatus is a superconducting solenoid of 6 m internal diame-ter, providing a magnetic field of 3.8 T. Within the solenoid volume are a silicon pixel and strip tracker, a lead tungstate crystal electromagnetic calorimeter (ECAL), and a brass and scintilla-tor hadron calorimeter (HCAL), each composed of a barrel and two endcap sections. Forward calorimeters extend the pseudorapidity coverage provided by the barrel and endcap detectors. Muons are measured in gas-ionisation detectors embedded in the steel flux-return yoke outside
the solenoid. The ECAL provides coverage in pseudorapidity|η| < 1.48 in the barrel region
and 1.48< |η| <3.0 in two endcap regions (EE). A preshower detector consisting of two planes
of silicon sensors interleaved with a total of 3X0 of lead is located in front of the EE. The
elec-tron momenta are estimated by combining energy measurements in the ECAL with momentum measurements in the tracker [33]. The relative transverse momentum resolution for electrons
with pT≈45 GeV from Z→ee decays ranges from 1.7% in the barrel region to 4.5% in the
end-caps [33]. The dielectron mass resolution for Z → ee decays when both electrons are in the
ECAL barrel is 1.9%, and is 2.9% when both electrons are in the endcaps. Muons are measured
in the range |η| < 2.4. Matching muons to tracks measured in the silicon tracker results in a
relative pT resolution for muons with 20 < pT < 100 GeV of 1.3–2.0% in the barrel and better
than 6% in the endcaps. The pTresolution in the barrel is better than 10% for muons with pTup
to 1 TeV [34, 35]. Events of interest are selected using a two-tiered trigger system [36]. The first level, composed of custom hardware processors, uses information from the calorimeters and muon detectors to select events at a rate of around 100 kHz within a time interval of less than 4 µs. The second level, known as the high-level trigger, consists of a farm of processors running a version of the full event reconstruction software optimised for fast processing, and reduces the event rate to less than 1 kHz before data storage. A more detailed description of the CMS detector, together with a definition of the coordinate system used and the relevant kinematic variables, can be found in Ref. [37].
4
Monte Carlo simulation
Simulated tZq-SM and ttZ events are produced, at NLO, with the MADGRAPH5 aMC@NLO
v5.1.3.30 generator [13], interfaced with PYTHIA version 8.212 [38] for parton showering and
hadronisation. Several of the background processes considered in this analysis (tt and ttW production, diboson production and Z boson production in association with multiple jets) are
produced at leading order (LO) using the MADGRAPH5 aMC@NLOMonte Carlo (MC)
gener-ator interfaced with PYTHIA version 6.426 [39]. Single top quark background processes (tW
and ¯tW) are simulated using the POWHEG v.1.0 r1380 generator [40–43], which is interfaced
to PYTHIA version 8.212 for parton showering and hadronisation. The tZ-FCNC events are
generated at LO using the MADGRAPH5 aMC@NLO generator interfaced with PYTHIA
6 5 Event reconstruction and data selection
in MADGRAPH5 aMC@NLO by means of the FEYNRULES package [44] and of the universal
FEYNRULESoutput format [45]. The complex chiral parameters are fixed to the following
val-ues: ˆfqR = 0 and ˆfqL = 1. All samples generated withPOWHEG and MADGRAPH5 aMC@NLO
use the CT10 [46] PDF set. The value of the top quark mass used in all the simulated
sam-ples is mt = 172.5 GeV. All samples include W boson decays to τ leptons, as well as to
electrons and/or muons. The characterisation of the underlying event uses the PYTHIA Z2*
tune [47, 48] for the MADGRAPH5 aMC@NLOandPOWHEGsamples, and the CUETP8M1 tune
[48] for the tZq-SM sample. Additional samples of tZq-SM, tZ-FCNC, ttV, and WZ are gen-erated, varying the renormalisation and factorisation scales, for studies of systematic effects. For the ttV and WZ backgrounds, further samples are generated varying the merging
thresh-old in MADGRAPH5 aMC@NLO. The expected cross sections are obtained from
next-to-next-to-leading-order calculations for t¯t [49] and Z/γ∗ processes [50], NLO plus
next-to-next-to-leading-logarithmic calculations for single top quark production in the tW or ttW channels [51], and NLO calculations for VV [52] and ttV [53, 54] processes. For all samples of
simu-lated events, multiple minimum-bias events generated withPYTHIAare added to simulate the
presence of additional proton-proton interactions (pileup) from the same bunch crossing or in neighbouring proton bunches. To refine the simulation, the events are weighted to reproduce the distribution in the number of pileup vertices inferred from data. Most generated samples
contain full simulation of detector effects, using the GEANT4 package [55], including
simula-tion of the machine running condisimula-tions, while the FCNC samples are processed using a fast simulation of the detector [56].
5
Event reconstruction and data selection
In the searches presented in this paper, the signal signature contains a Z boson and a top quark, which both decay leptonically to either electrons or muons. Thus the final state for both searches consists of three leptons (electrons and/or muons, including those coming from tau decays), plus an escaping undetected neutrino that is inferred from an imbalance in the transverse momentum. The signature also includes a bottom quark jet (b jet) that arises from the hadronisation of the b quark produced in the top quark decay. In the final state for tZq-SM production, or for tt-FCNC, there is an additional jet arising from the hadronisation of a light or a charm quark. The data used in this analysis were collected with the CMS detector during the 2012 proton-proton data taking period at a centre-of-mass energy of 8 TeV. The data are
selected online using triggers that rely on the presence of two high-pT leptons, ee, eµ, or µµ.
The highest-pT lepton is required to satisfy pT > 17 GeV, while the second-highest-pT lepton
must satisfy pT > 8 GeV. In addition, the trigger selection requires loose lepton identification
for both lepton flavours; electrons are additionally required to pass online isolation require-ments. The resulting trigger efficiencies are 99% for eee and eeµ, 98% for µµµ and 89% for
µµe. For tZ-FCNC production, the trigger acceptance is enhanced by using single-lepton and
trilepton triggers with various pT thresholds, resulting in a trigger efficiency close to 100%,
af-ter all selection cuts. The trigger efficiency is obtained from data collected with an independent trigger selection based on missing transverse momentum. The missing transverse momentum
vector~pTmiss is defined as the projection on the plane perpendicular to the beams of the
neg-ative vector sum of the momenta of all reconstructed particles in an event. Its magnitude is
referred to as missing transverse momentum, pmiss
T . A particle-flow event reconstruction
algo-rithm [57, 58] identifies each individual particle with an optimised combination of information from the various elements of the CMS detector. The energy of the photons is directly obtained from the ECAL measurement. The energy of the electrons is determined from a combination of the electron momentum at the primary interaction vertex as determined by the tracker, the
energy of the corresponding ECAL cluster, and the energy sum of all bremsstrahlung photons spatially compatible with originating from the electron track. The momentum of the muons is obtained from the curvature of the corresponding track. The energy of the charged hadrons is determined from a combination of their momentum measured in the tracker and the matching ECAL and HCAL energy deposits. Finally, the energy of the neutral hadrons is obtained from the corresponding corrected ECAL and HCAL deposits. The tracks reconstructed in the silicon tracker are used to identify and construct a series of interaction vertices, which correspond to the pileup. For each vertex, the sum of the transverse momenta squared of the associated tracks is calculated. The vertex whose sum is largest is taken to be the event primary vertex, provided that it is reconstructed using four or more tracks and that it lies within 24 cm of the nominal interaction point in the z direction and within 2 cm in the transverse plane. Each event must contain exactly three electrons and/or muons, reconstructed by the particle-flow algorithm. Each lepton must have pT > 20 GeV and |η| < 2.5 (electron) or |η| < 2.4 (muon) and must
be isolated. Isolation is determined by calculating the sum of pT of all the other reconstructed
particles that lie within a cone of fixed radius ∆R =
√
(∆η)2+ (∆φ)2around the lepton, cor-recting for the expected contribution from pileup [59] and dividing the corrected sum by the
pT of the lepton. The resulting quantity is denoted Irel. For electrons, the cone size is set to
∆R = 0.3 and Irel must be less than 0.15. For muons, the cone size is set to∆R = 0.4 and Irel
must be less than 0.12. Events that contain additional leptons, satisfying the same kinematic selection but with relaxed lepton identification criteria, are rejected. Lepton isolation and iden-tification efficiencies in simulation are corrected to match the ones measured in data using a tag-and-probe method [60]. Two of the same-flavour leptons in each event are required to have
opposite electric charge, and have an invariant mass, m``, compatible with the Z boson mass,
i.e. 76<m``<106 GeV. In the eee and µµµ channels, the pair of oppositely charged leptons
having an invariant mass closest to the Z boson mass is used to form the Z boson candidate. In the eeµ and µµe channels, the same-flavour leptons are used to form the Z boson candidate. For all channels, the third lepton is assumed to come from the decay of the W boson. Jets are clustered from the particles reconstructed using the particle-flow algorithm with the infrared
and collinear safe anti-kT algorithm [61, 62], operated with a distance parameter R = 0.5. Jet
momentum is determined as the vectorial sum of all particle momenta in the jet, and is found from simulation to be within 5 to 10% of the true particle-level jet momentum over the whole
pTspectrum and detector acceptance. An offset correction is applied to jet energies to take into
account the contribution from pileup interactions. Corrections for the jet energy are derived from simulation, and are corrected with in situ measurements of the energy balance in dijet
and photon+jet events [63]. For the tZ-FCNC analysis, only jets that satisfy pT > 30 GeV and
|η| < 2.4 are used in the results presented here, while for the tZq-SM analysis, the maximum
allowed value of|η|is relaxed to 4.5 to improve the signal acceptance, as for single top quark
t-channel processes the extra light jet is mostly produced in the forward region. Jets that are
reconstructed close to a selected lepton (∆R < 0.5) are removed. Jets that originate from the
hadronisation of a b quark are identified (tagged) using the combined secondary vertex algo-rithm [64]. This algoalgo-rithm combines various track-based variables with vertex-based variables
to construct a discriminating observable in the region|η| < 2.4. The discriminant is used to
distinguish between b jets and non-b jets. For the results presented here, the so-called loose operating point is used. This corresponds to a b tagging efficiency of about 85% and a misiden-tification probability of 10% for light-flavour or gluon jets, as estimated from QCD multijet simulations. The value of the b tagging discriminant is also used in the multivariate discrim-inator. Corrections to the b tagging discriminant shape have been determined using tt and multijet control samples, and are then applied to the signal and background data sets [64]. In the search for tZq-SM production, two or more selected jets are required, one or more of which
8 6 Analysis method
must also satisfy the b tagging requirements. In the search for tZ-FCNC production, two dif-ferent signal selections are considered. In a first selection, denoted as single-top-quark-FCNC selection, exactly one selected jet is required, which has to pass the b tagging requirement. A second selection (tt-FCNC selection) asks for at least two selected jets with at least one passing the b tagging requirement. The selections result in a signal-enriched sample, with either single-top-quark-FCNC or tt-FCNC events. To further reject backgrounds, two additional selections
are made on the missing transverse momentum and the transverse mass of the W boson, mWT.
These selections are applied to the signal regions only and are optimised to maximise the ex-pected significance. The optimisation is made for the tZq-SM and tZ-FCNC signals separately.
For the tZq-SM analysis, mWT >10 GeV is required while for the tZ-FCNC analysis we require
pmissT > 40 GeV and mWT > 10 GeV. These selections define the signal regions for the analyses. In addition to the signal region, a background-enriched control region is defined by requiring one or two selected jets, but vetoing events containing a b-tagged jet, in order to increase the DY and WZ content. The event selections for the control and signal regions are presented in Table 1, while the number of events remaining for each process, after all selections have been applied is shown in Table 2 for the tZq-SM shape analysis.
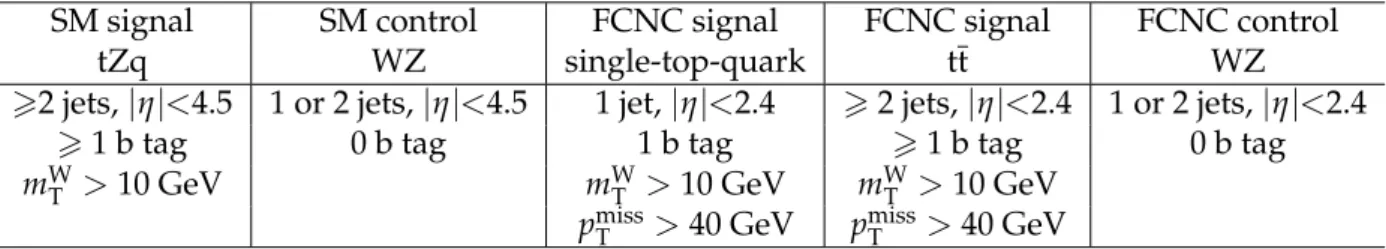
Table 1: The event selections for the signal and control regions for the SM and FCNC analyses.
SM signal SM control FCNC signal FCNC signal FCNC control
tZq WZ single-top-quark tt WZ
>2 jets,|η|<4.5 1 or 2 jets,|η|<4.5 1 jet,|η|<2.4 >2 jets,|η|<2.4 1 or 2 jets,|η|<2.4
>1 b tag 0 b tag 1 b tag >1 b tag 0 b tag
mWT >10 GeV mWT >10 GeV mWT >10 GeV
pmissT >40 GeV pmissT >40 GeV
Table 2: The number of events remaining for each process, after all selections have been applied, in the control and signal regions for the tZq-SM shape analysis. WZ+h.f. denotes WZ + heavy flavour.
Process Control Region Signal Region
ttZ 1.76±0.18 10.91±0.44 ZZ 10.64±0.03 1.58±0.01 WZ+h.f. 104.73±1.32 34.34±0.76 WZ 426.92±2.67 58.00±0.98 DY 192.95±13.89 49.24±7.02 tZq 5.89±0.03 16.05±0.04 Total prediction 743±18 170±9 Data 763 154
6
Analysis method
In order to enhance the separation between signal and background processes, a multivariate discriminator is used in both the tZq-SM and FCNC searches. The discriminator is based on the BDT algorithm [65] implemented in the standard toolkit for multivariate analysis TMVA [66]. A range of different quantities are used as input variables for the BDTs. They are selected based on their discriminating power and include kinematic variables related to the top quark and
the Z boson, such as pT, pseudorapidity, and charge asymmetry q`|η|, where q and η are the
charge and η of the lepton from the W decay, as well as jet properties, particularly those related to b tagging or the pseudorapidity of the recoiling jet. The BDTs are trained using half of the simulated samples for these processes and they are trained separately for each channel. The output discriminant distribution is then fitted, in the signal region, for each channel, to deter-mine whether there are any signal events present in the data. The second half of the simulated
samples are used to test that overtraining did not occur. For the SM search, the BDTtZq-SM is
used to discriminate between the tZq-SM signal and the dominating ttZ and WZ background
processes. The BDTtZq-SM distribution is fitted, together with the mWT distribution in the
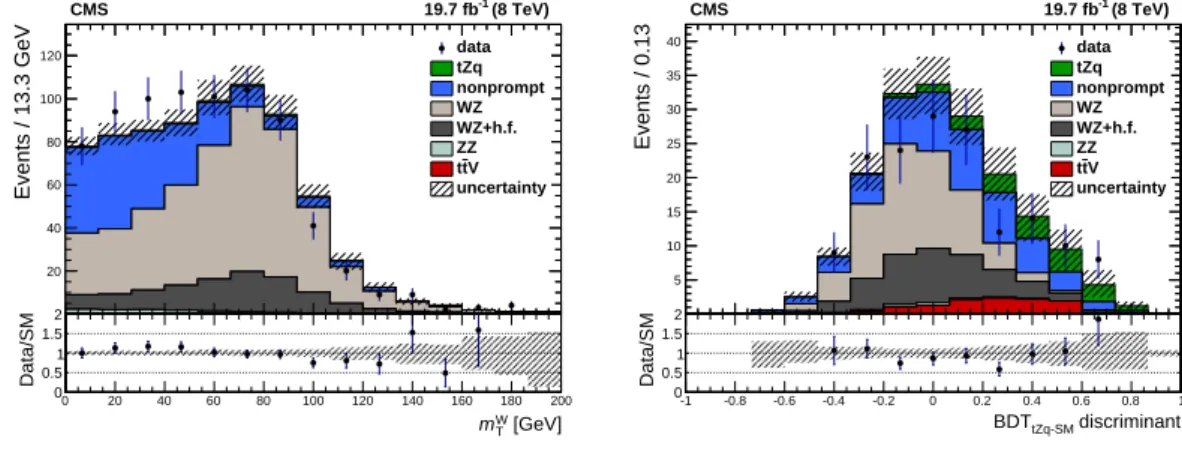
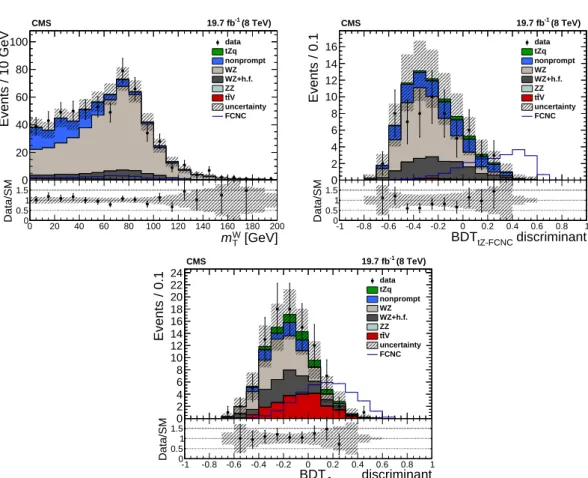
con-trol region. The results of the fits are presented in Fig. 4 for the four channels combined. For
Events / 13.3 GeV 20 40 60 80 100 120 data tZq nonprompt WZ WZ+h.f. ZZ V t t uncertainty CMS -1 (8 TeV) 19.7 fb [GeV] W T m 0 20 40 60 80 100 120 140 160 180 200 Data/SM0.50 1 1.5 2 Events / 0.13 5 10 15 20 25 30 35 40 data tZq nonprompt WZ WZ+h.f. ZZ V t t uncertainty CMS -1 (8 TeV) 19.7 fb discriminant tZq-SM BDT -1 -0.8 -0.6 -0.4 -0.2 0 0.2 0.4 0.6 0.8 1 Data/SM0.50 1 1.5 2
Figure 4: Data-to-prediction comparisons after performing the fit for mW
T distribution in the
control region (left) and for the BDTtZq-SMresponses in the signal region (right). The four lepton
channels are combined. The lower panels show the ratio between observed and predicted yields, including the total uncertainty on the prediction.
the FCNC searches, the BDTtZ-FCNC and BDTtt-FCNC are used to discriminate FCNC processes
from the SM background processes. The BDTtZ-FCNC, and BDTtt-FCNC, distributions are fitted,
together with the mW
T distribution in the control region. The results of the fits are presented in
Fig. 5 for the four channels combined. A number of different background processes are consid-ered. These include tt, single top quark, diboson, ttV, and DY production. The contamination from W+jets events involves two nonprompt leptons and is found to be negligible. Diboson production is dominated by the WZ sample, which is split into two parts: the production of WZ events in association with light jets, or in association with heavy-flavour jets. The ZZ pro-duction contributes with a small number of background events. While the cross section of WW production is slightly higher than ZZ production, a nonprompt lepton would have to be se-lected to replicate the signal, making its contribution to the background negligible. The tt SM and the DY backgrounds populate the signal region if they contain a reconstructed nonprompt lepton that passes the lepton identification and isolation selections; as the nonprompt lepton rates are not well modelled by the simulation, these backgrounds are estimated from data. The
mWT distribution is used as a discriminator in the background-enriched region to estimate the
backgrounds related to nonprompt leptons, as well as the dominant WZ background. Both the shape and normalisation of the other backgrounds are estimated from simulation.
The normalisation of the nonprompt lepton and WZ background is estimated by fitting the
mW
T distribution. The mWT distribution peaks around the W mass for a lepton and pmissT from a W
boson decay, while for nonprompt lepton backgrounds it peaks close to zero and falls rapidly. This difference in shape allows a simultaneous estimation of the nonprompt lepton and the
10 6 Analysis method Events / 10 GeV 0 20 40 60 80 100 CMS -1 (8 TeV) 19.7 fb data tZq nonprompt WZ WZ+h.f. ZZ V t t uncertainty FCNC [GeV] W T m 0 20 40 60 80 100 120 140 160 180 200 Data/SM 0 0.5 1 1.5 Events / 0.1 0 2 4 6 8 10 12 14 16 CMS -1 (8 TeV) 19.7 fb data tZq nonprompt WZ WZ+h.f. ZZ V t t uncertainty FCNC discriminant tZ-FCNC BDT -1 -0.8 -0.6 -0.4 -0.2 0 0.2 0.4 0.6 0.8 1 Data/SM 0 0.5 1 1.5 Events / 0.1 0 2 4 6 8 10 12 14 16 18 20 22 24 CMS -1 (8 TeV) 19.7 fb data tZq nonprompt WZ WZ+h.f. ZZ V t t uncertainty FCNC discriminant -FCNC t t BDT -1 -0.8 -0.6 -0.4 -0.2 0 0.2 0.4 0.6 0.8 1 Data/SM 0 0.5 1 1.5
Figure 5: Data-to-prediction comparisons for the tZ-FCNC search after performing the fit for
mWT distribution in the control region (top-left), and for the BDT responses in the single top
quark (BDTtZ-FCNC) (top-right), and tt (BDTtt-FCNC) (bottom), signal regions. An example of
the predicted signal contribution for a valueB(t →Zu) =0.1% (FCNC) is shown for
illustra-tion. The four channels are combined. The lower panels show the ratio between observed and predicted yields, including the total uncertainty on the prediction.
WZ backgrounds to be made. In the eeµ and µµe final states, the same-flavour opposite-sign leptons are assumed to come from the Z boson, hence the remaining lepton (third lepton) is assumed to come from the W boson and is used to compute the transverse mass. For the eee
and µµµ final states, both opposite sign combinations are considered. The normalised mW
T
dis-tributions (templates) for events containing a nonprompt lepton are obtained by inverting the isolation criteria on the third lepton. The resulting event sample is expected to be dominated by DY events, although a small number of tt events are expected. The signal is extracted by performing a simultaneous binned maximum-likelihood fit to the distributions of the signal samples and the background-enriched control region, using the two different discriminators. The background-enriched control region helps to constrain the backgrounds in the signal sam-ple by means of nuisance parameters. A common fit is performed simultaneously for the four different final states (eee, eeµ, µµe, and µµµ). In order to validate the fit procedure, an
addi-Events / 8 GeV 0 20 40 60 80 100 120 140 CMS -1 (8 TeV) 19.7 fb data nonprompt WZ WZ+h.f. ZZ V t t uncertainty
of lepton from W [GeV] T p 0 20 40 60 80 100 120 140 160 180 200 Data/SM 0 0.5 1 1.5 Events / 10 GeV 0 20 40 60 80 100 120 CMS -1 (8 TeV) 19.7 fb data nonprompt WZ WZ+h.f. ZZ V t t uncertainty [GeV] miss T p 0 20 40 60 80 100 120 140 160 180 200 Data/SM 0 0.5 1 1.5 Events / 0.8 GeV 0 10 20 30 40 50 60 70 80 90 CMS -1 (8 TeV) 19.7 fb data nonprompt WZ WZ+h.f. ZZ V t t uncertainty [GeV] ll m 70 75 80 85 90 95 100 105 110 Data/SM 0 0.5 1 1.5
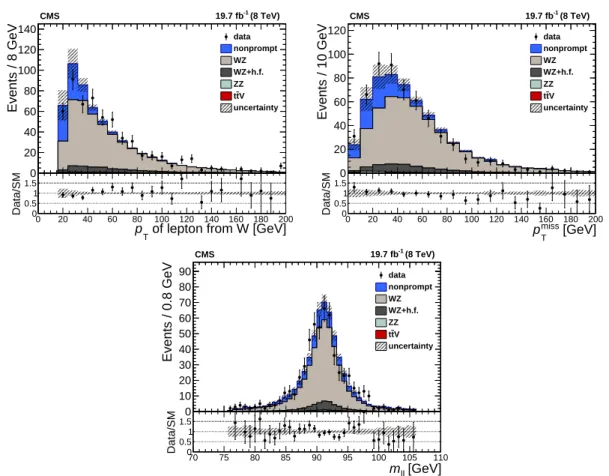
Figure 6: Data-to-prediction comparisons in the background-enriched samples, after applying
background normalisation scaling factors as described in the text, of the pT of the lepton from
the W boson (top-left), pmissT (top-right), and m`` (bottom). The four channels are combined.
The lower panels show the ratio between observed and predicted yields, including the total uncertainty on the prediction. The distributions shown here are for the tZ-FCNC search, where WZ + h.f. denotes WZ + heavy flavour.
tional fit is performed in the background-enriched region only and the background normal-isations are extracted from this fit. These normalnormal-isations are used to compare the data to the predictions as shown in Fig. 6. Reasonable agreement in normalisation and shape between data and predictions is found, validating the background model.
12 7 Systematic uncertainties
7
Systematic uncertainties
Different sources of systematic uncertainty are considered. They can affect the number of events passing the selection, the shape of the BDT response, or both.
• Luminosity measurement: The integrated luminosity measurement is extracted
us-ing the pixel cluster countus-ing method [67], with the correspondus-ing uncertainty beus-ing
±2.6%.
• Pileup estimation: The uncertainty in the average expected number of additional
interactions per bunch crossing is±5%.
• Lepton trigger, reconstruction, and identification efficiency:To ensure that the
effi-ciency of the dilepton triggers observed in data is properly reproduced, a set of data-to-simulation corrections is applied to all simulated events ; likewise, an additional set of corrections (pT- and η- dependent) is used to ensure that the efficiency for
re-constructing and identifying leptons observed in the data is correctly reproduced in the simulation. The corrections are varied by their corresponding uncertainties, which amounts to about 4% per event for the trigger selection and 2% per event for the lepton selection. For the tZ-FCNC production the trigger selection is extended, which increases the acceptance and in turn leads to a reduction in the trigger uncer-tainty.
• Jet energy scale (JES), jet energy resolution (JER), and missing transverse
momen-tum: In all simulated events, all the reconstructed jet four-momenta are
simultane-ously varied by the uncertainties associated with the jet energy scale and resolution. Changing the jet momenta in this fashion causes a corresponding change in the total
momentum in the transverse plane, thus affecting pmissT as well. The contribution
to pmissT that is not from particles identified as leptons or photons, or that are not
clustered into jets is varied by±10% [68].
• b tagging: The b tagging and misidentification efficiencies are estimated using
con-trol samples [69]. The resulting corrections are applied to all simulated samples to
ensure that they reproduce the efficiencies in data. The corrections are varied by±1
standard deviation (σ).
• Background normalisation: The normalisation of the nonprompt lepton and WZ
background processes are estimated from data while performing the final fit. The normalisation uncertainties in the backgrounds estimated from simulation are taken as 30%. The WZ + jets sample is split into two parts: WZ + light-flavour jets and WZ + heavy-flavour (b and c) jets. The normalisations of these two backgrounds, which are treated separately, are left free in the fit.
• Z boson pT:Uncertainty coming from the Z boson pTreweighting is accounted for
by not applying, or applying twice, the reweighting.
• Physics process modelling:The renormalisation and factorisation scales used in the
WZ, tZq-SM and tZ-FCNC signal simulation, as well as for the ttZ simulated sam-ples, are multiplied or divided by a factor of two, and the corresponding variations
are considered as shape systematic uncertainties. The procedure used in PYTHIAto
match the partons in the matrix-element calculation with those in the parton show-ering includes a number of scale thresholds. These are varied in the simulated WZ sample and the resulting variation is taken as the associated systematic uncertainty.
• PDFs:The nominal PDF sets used for the analyses described in this paper are quoted
are reweighted by using the eigenvalues associated to each PDF set. The correspond-ing variations are summed in quadrature and the results are compared with the nominal prediction. Uncertainties estimated from different PDF sets are also com-pared and the largest uncertainty is taken.
• Simulated sample size: The statistical uncertainty arising from the limited size
of the simulated samples is taken as a source of systematic uncertainty using the ”Barlow-Beeston light” method [70].
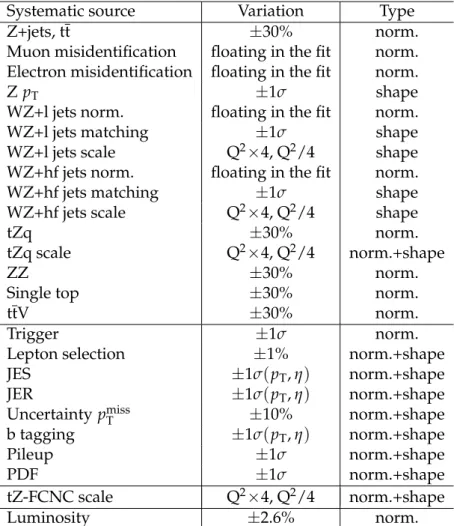
The systematic sources, variation and type (shape/normalisation) are summarised in Table 3. For a given source of systematic uncertainty there is 100% correlation between the 4 channels, except for the lepton misidentification where the µµµ and eeµ channels are 100% correlated and the µµe and eee channels are 100% correlated, due to the isolation inversion of the lepton candidate from the W decay.
Table 3: The systematic sources, variation and type, which represent how the uncertainty is treated in the likelihood fit.
Systematic source Variation Type
Z+jets, tt ±30% norm.
Muon misidentification floating in the fit norm.
Electron misidentification floating in the fit norm.
Z pT ±1σ shape
WZ+l jets norm. floating in the fit norm.
WZ+l jets matching ±1σ shape
WZ+l jets scale Q2×4, Q2/4 shape
WZ+hf jets norm. floating in the fit norm.
WZ+hf jets matching ±1σ shape
WZ+hf jets scale Q2×4, Q2/4 shape
tZq ±30% norm.
tZq scale Q2×4, Q2/4 norm.+shape
ZZ ±30% norm.
Single top ±30% norm.
ttV ±30% norm.
Trigger ±1σ norm.
Lepton selection ±1% norm.+shape
JES ±1σ(pT, η) norm.+shape
JER ±1σ(pT, η) norm.+shape
Uncertainty pmissT ±10% norm.+shape
b tagging ±1σ(pT, η) norm.+shape Pileup ±1σ norm.+shape PDF ±1σ norm.+shape tZ-FCNC scale Q2×4, Q2/4 norm.+shape Luminosity ±2.6% norm.
8
Results
The fit is performed on the BDT discriminant distributions in the signal samples, and on the mWT
14 8 Results
and µµµ). This is implemented using the Theta program [71], with most of the systematic un-certainties treated as nuisance parameters. Prior to fitting, the templates for each background process are scaled to correspond to the predicted SM cross section, including all relevant cor-rections, and the integrated luminosity of the data sample used for the analysis. The systematic uncertainties discussed in Section 7 are included in the fit. For each source of systematic uncer-tainty, u, a nuisance parameter, θu, is introduced. Systematic uncertainties can affect the rate of
events and/or the shape of the template distribution. The data are used to constrain the nui-sance parameters for all systematic uncertainties except for those related to the physics process modelling and PDF parameters. The significance is calculated using a Bayesian technique. 8.1 Search for tZq-SM production
By performing a simultaneous fit on the mWT distribution in the background-enriched sample
and on the BDT outputs in the signal region, the number of events in excess of the background-only hypothesis is determined. This excess can then be compared to the SM expectation for tZq production in order to measure the cross section. The efficiency times acceptance for the BDT-based analysis is 0.10 for the inclusive cross section. The measured cross sections for the
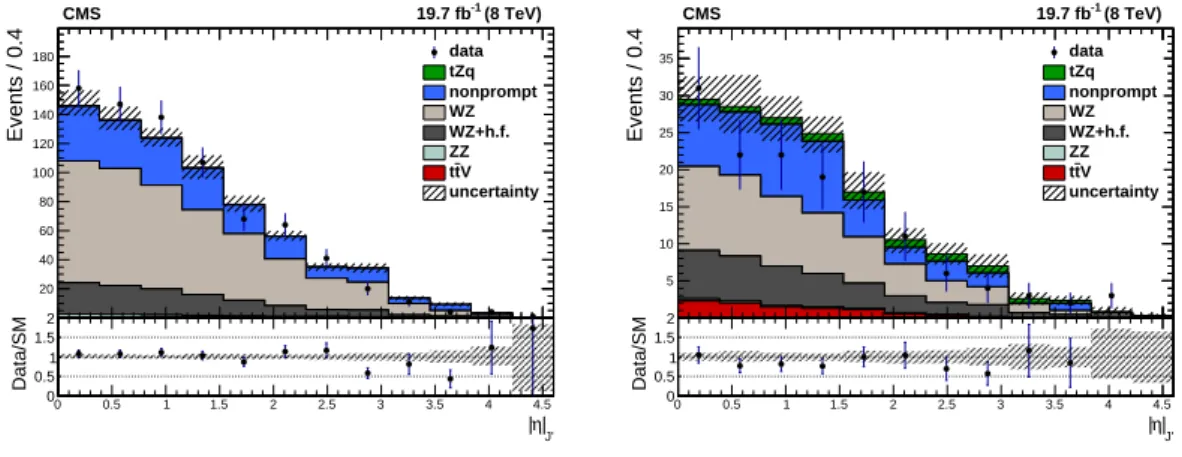
Events / 0.4 20 40 60 80 100 120 140 160 180 data tZq nonprompt WZ WZ+h.f. ZZ V t t uncertainty CMS -1 (8 TeV) 19.7 fb J' | η | 0 0.5 1 1.5 2 2.5 3 3.5 4 4.5 Data/SM 0 0.5 1 1.5 2 Events / 0.4 5 10 15 20 25 30 35 data tZq nonprompt WZ WZ+h.f. ZZ V t t uncertainty CMS -1 (8 TeV) 19.7 fb J' | η | 0 0.5 1 1.5 2 2.5 3 3.5 4 4.5 Data/SM 0 0.5 1 1.5 2
Figure 7: Data-to-prediction comparisons after performing the fit for the|η|distribution of the
recoiling jet in the control region (left), and the signal region (right). The four lepton chan-nels are combined. The lower pachan-nels show the ratio between observed and predicted yields, including the total uncertainty on the prediction.
individual channels and the channels combined are shown in Table 4. The combined measured signal tZq cross section is found to be 10+−87fb and is consistent with the SM prediction of 8.2 fb with a theoretical uncertainty of less than 10%. For illustration, the data-to-prediction compar-isons, including the post-fit uncertainties, are presented in Fig. 7 for the|η|distribution of the
leading jet not originating from the top quark decay (ηJ0) in the control region and in the signal
region. The corresponding observed and expected significances are 2.4 and 1.8 standard devia-tions, respectively, with the expected significance having a one standard deviation range of [0.4 – 2.7] at 68% CL. The observed signal exclusion limit on the tZq cross section is 21 fb at 95% CL. As a cross-check, the search for tZq-SM is also performed using a counting experiment. The main differences in the event selection compared to the BDT-based analysis are a tighter elec-tron isolation requirement, Irel <0.1, and a tighter m``selection 78 < m`` <102 GeV. For this
analysis, the WZ background is estimated by counting the number of events in a region en-riched in WZ events, defined by inverting the b tagging requirements. Contamination of other sub-dominant processes is subtracted using the prediction of the simulation and a systematic uncertainty is estimated by varying their yields according to their respective uncertainties.
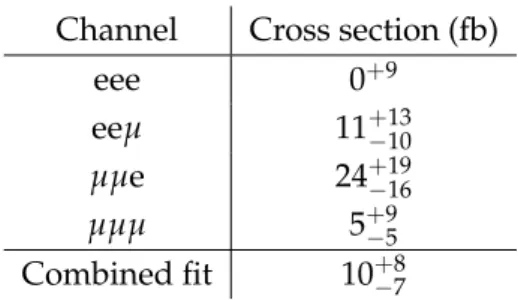
Ad-Table 4: The measured cross sections, together with their total uncertainties, for the individual channels and the channels combined for the BDT-based analysis.
Channel Cross section (fb)
eee 0+9
eeµ 11+−1310
µµe 24+−1916 µµµ 5+−95
Combined fit 10+−87
ditional systematic uncertainties due to the WZ modelling are accounted for by considering renormalisation and factorisation scale variations as well as matching threshold variations. For
the cross-check analysis the total expected number of events is 15.4±0.5, dominated by ttZ
events (5.2±0.3) and WZ events (3.6±0.2). The contribution from ZZ, tt, and DY events
is 2.7±0.3, and the contribution from ttW events is 0.5±0.02. The expected number of signal
events is 3.4±0.1. A total of 20 events passing all signal selections are observed in the data. The efficiency times acceptance for the counting experiment is 0.021 for the inclusive cross section. The measured cross sections for each channel, and the combination of channels, is calculated
using the ROOSTATSpackage [72]. The results obtained are shown in Table 5. The cross section
Table 5: The measured cross sections for the individual channels and the channels combined for the counting analysis.
Channel Cross section (fb)
eee 29+−3224(stat)+−87(syst)
eeµ 6+−236 (stat)+−43(syst)
µµe 19+−2418(stat)±5(syst) µµµ 20+−1915(stat)+−43(syst)
Combined fit 18+−119 (stat)±4(syst)
is measured to be 18+−119 (stat) ±4(syst)fb, in agreement with the SM prediction and with the BDT-based result. The corresponding signal significance is observed to be 1.8 standard devi-ations, while the expected significance is 0.8 standard devidevi-ations, with a 68% CL range of [0 –1.59].
8.2 Search for tZ-FCNC production
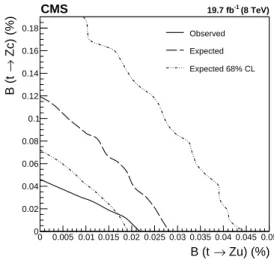
To search for tZ-FCNC interactions, the single-top-quark-FCNC, tt-FCNC and background-enriched samples are combined in a single fit. The result of the fit is consistent with the SM-only hypothesis. Exclusion limits at 95% CL for tZ-FCNC are calculated by performing simultane-ously the fit in the single-top-quark-FCNC-, tt-FCNC-, and WZ-enriched regions. The limits are calculated for different combinations of tZu and tZc anomalous couplings, as shown in Fig. 8. The independent exclusion limits are summarised in Table 6 where the branching fraction of the coupling not under consideration is assumed to be zero. A more stringent limit is observed on the tZu couplings compared to the tZc couplings as a result of the larger cross section for
tZ-FCNC in the tZu channel. The limits areB(t → Zu) < 0.022% and B(t → Zc) < 0.049%,
16 9 Summary Zu) (%) → B (t 0 0.005 0.01 0.015 0.02 0.025 0.03 0.035 0.04 0.045 0.05 Zc) (%) → B (t 0 0.02 0.04 0.06 0.08 0.1 0.12 0.14 0.16 0.18 Observed Expected Expected 68% CL (8 TeV) -1 19.7 fb CMS
Figure 8: The expected and observed exclusion limits at 95% CL onB(t→Zc)as a function of
the limits onB(t→Zu). The expected 68% CL is also shown.
Table 6: Expected and observed 95% exclusion limits on the branching fraction of the tZ-FCNC couplings.
Branching fraction Expected 68% CL range 95% CL range Observed
B(t→Zu)(%) 0.027 0.018 – 0.042 0.014 – 0.065 0.022
B(t→Zc)(%) 0.118 0.071 – 0.222 0.049 – 0.484 0.049
9
Summary
A search for the associated production of a top quark and a Z boson, as predicted by the stan-dard model was performed with the full CMS data set collected at 8 TeV, corresponding to
an integrated luminosity of 19.7 fb−1. An events yield compatible with tZq standard model
production is observed, and the corresponding cross section is measured to be 10+−87fb. The
corresponding observed and expected significances are 2.4 and 1.8 standard deviations, respec-tively. A search for tZ production produced via flavour-changing neutral current interactions, either in single-top-quark or tt production modes, was also performed. For this search the standard model tZq process was considered as a background. No evidence for tZ-FCNC in-teractions is found, and limits at 95% confidence level are set on the branching fraction for the
decay of a top quark into a Z boson and a quark. The limits are B(t → Zu) < 0.022% and
B(t → Zc) < 0.049%, which improve the previous limits set by the CMS Collaboration by about a factor of two.
Acknowledgments
We congratulate our colleagues in the CERN accelerator departments for the excellent perfor-mance of the LHC and thank the technical and administrative staffs at CERN and at other CMS institutes for their contributions to the success of the CMS effort. In addition, we grate-fully acknowledge the computing centres and personnel of the Worldwide LHC Computing Grid for delivering so effectively the computing infrastructure essential to our analyses. Fi-nally, we acknowledge the enduring support for the construction and operation of the LHC and the CMS detector provided by the following funding agencies: the Austrian Federal Min-istry of Science, Research and Economy and the Austrian Science Fund; the Belgian Fonds de
la Recherche Scientifique, and Fonds voor Wetenschappelijk Onderzoek; the Brazilian Fund-ing Agencies (CNPq, CAPES, FAPERJ, and FAPESP); the Bulgarian Ministry of Education and Science; CERN; the Chinese Academy of Sciences, Ministry of Science and Technology, and Na-tional Natural Science Foundation of China; the Colombian Funding Agency (COLCIENCIAS); the Croatian Ministry of Science, Education and Sport, and the Croatian Science Foundation; the Research Promotion Foundation, Cyprus; the Secretariat for Higher Education, Science, Technology and Innovation, Ecuador; the Ministry of Education and Research, Estonian Re-search Council via IUT23-4 and IUT23-6 and European Regional Development Fund, Estonia; the Academy of Finland, Finnish Ministry of Education and Culture, and Helsinki Institute of Physics; the Institut National de Physique Nucl´eaire et de Physique des Particules / CNRS, and Commissariat `a l’ ´Energie Atomique et aux ´Energies Alternatives / CEA, France; the Bundes-ministerium f ¨ur Bildung und Forschung, Deutsche Forschungsgemeinschaft, and Helmholtz-Gemeinschaft Deutscher Forschungszentren, Germany; the General Secretariat for Research and Technology, Greece; the National Scientific Research Foundation, and National Innova-tion Office, Hungary; the Department of Atomic Energy and the Department of Science and Technology, India; the Institute for Studies in Theoretical Physics and Mathematics, Iran; the Science Foundation, Ireland; the Istituto Nazionale di Fisica Nucleare, Italy; the Ministry of Science, ICT and Future Planning, and National Research Foundation (NRF), Republic of Ko-rea; the Lithuanian Academy of Sciences; the Ministry of Education, and University of Malaya (Malaysia); the Mexican Funding Agencies (BUAP, CINVESTAV, CONACYT, LNS, SEP, and UASLP-FAI); the Ministry of Business, Innovation and Employment, New Zealand; the Pak-istan Atomic Energy Commission; the Ministry of Science and Higher Education and the Na-tional Science Centre, Poland; the Fundac¸˜ao para a Ciˆencia e a Tecnologia, Portugal; JINR, Dubna; the Ministry of Education and Science of the Russian Federation, the Federal Agency of Atomic Energy of the Russian Federation, Russian Academy of Sciences, the Russian Foun-dation for Basic Research and the Russian Competitiveness Program of NRNU ?MEPhI?; the Ministry of Education, Science and Technological Development of Serbia; the Secretar´ıa de Es-tado de Investigaci ´on, Desarrollo e Innovaci ´on, Programa Consolider-Ingenio 2010, Plan de Ciencia, Tecnologa e Innovaci ´on 2013-2017 del Principado de Asturias and Fondo Europeo de Desarrollo Regional, Spain; the Swiss Funding Agencies (ETH Board, ETH Zurich, PSI, SNF, UniZH, Canton Zurich, and SER); the Ministry of Science and Technology, Taipei; the Thailand Center of Excellence in Physics, the Institute for the Promotion of Teaching Science and Tech-nology of Thailand, Special Task Force for Activating Research and the National Science and Technology Development Agency of Thailand; the Scientific and Technical Research Council of Turkey, and Turkish Atomic Energy Authority; the National Academy of Sciences of Ukraine, and State Fund for Fundamental Researches, Ukraine; the Science and Technology Facilities Council, UK; the US Department of Energy, and the US National Science Foundation.
Individuals have received support from the Marie-Curie programme and the European Re-search Council and EPLANET (European Union); the Leventis Foundation; the A. P. Sloan Foundation; the Alexander von Humboldt Foundation; the Belgian Federal Science Policy Of-fice; the Fonds pour la Formation `a la Recherche dans l’Industrie et dans l’Agriculture (FRIA-Belgium); the Agentschap voor Innovatie door Wetenschap en Technologie (IWT-(FRIA-Belgium); the Ministry of Education, Youth and Sports (MEYS) of the Czech Republic; the Council of Sci-ence and Industrial Research, India; the HOMING PLUS programme of the Foundation for Polish Science, cofinanced from European Union, Regional Development Fund, the Mobil-ity Plus programme of the Ministry of Science and Higher Education, the National Science Center (Poland), contracts Harmonia 2014/14/M/ST2/00428, Opus 2014/13/B/ST2/02543, 2014/15/B/ST2/03998, and 2015/19/B/ST2/02861, Sonata-bis 2012/07/E/ST2/01406; the Na-tional Priorities Research Program by Qatar NaNa-tional Research Fund; the Programa
Clar´ın-18 9 Summary
COFUND del Principado de Asturias; the Thalis and Aristeia programmes cofinanced by EU-ESF and the Greek NSRF; the Rachadapisek Sompot Fund for Postdoctoral Fellowship, Chula-longkorn University and the ChulaChula-longkorn Academic into Its 2nd Century Project Advance-ment Project (Thailand); and the Welch Foundation, contract C-1845.
References
[1] CDF Collaboration, “Observation of top quark production in p ¯p collisions”, Phys. Rev. Lett. 74 (1995) 2626, doi:10.1103/PhysRevLett.74.2626,
arXiv:hep-ph/9503002.
[2] D0 Collaboration, “Observation of the top quark”, Phys. Rev. Lett. 74 (1995) 2632,
doi:10.1103/PhysRevLett.74.2632, arXiv:hep-ph/9503003.
[3] CMS Collaboration, “Measurement of the t-channel single top quark production cross
section in pp collisions at√s =7 TeV”, Phys. Rev. Lett. 107 (2011) 091802,
doi:10.1103/PhysRevLett.107.091802, arXiv:1106.3052.
[4] CMS Collaboration, “Measurement of the single-top-quark t-channel cross section in pp
collisions at√s=7 TeV”, JHEP 12 (2012) 035, doi:10.1007/JHEP12(2012)035,
arXiv:1209.4533.
[5] CMS Collaboration, “Measurement of the t-channel single-top-quark production cross
section and of the|Vtb|CKM matrix element in pp collisions at
√
s=8 TeV”, JHEP 06
(2014) 090, doi:10.1007/JHEP06(2014)090, arXiv:1403.7366.
[6] ATLAS Collaboration, “Comprehensive measurements of t-channel single top-quark
production cross sections at√s=7 TeV with the ATLAS detector”, Phys. Rev. D 90
(2014) 112006, doi:10.1103/PhysRevD.90.112006, arXiv:1406.7844.
[7] CMS Collaboration, “Observation of the associated production of a single top quark and
a W boson in pp collisions at√s=8 TeV”, Phys. Rev. Lett. 112 (2014) 231802,
doi:10.1103/PhysRevLett.112.231802, arXiv:1401.2942.
[8] ATLAS Collaboration, “Measurement of the production cross-section of a single top quark in association with a W boson at 8 TeV with the ATLAS experiment”, JHEP 01 (2016) 064, doi:10.1007/JHEP01(2016)064, arXiv:1510.03752.
[9] ATLAS Collaboration, “Evidence for single top-quark production in the s-channel in
proton-proton collisions at√s=8 TeV with the ATLAS detector using the matrix
element method”, Phys. Lett. B 756 (2016) 228,
doi:10.1016/j.physletb.2016.03.017, arXiv:1511.05980.
[10] CMS Collaboration, “Search for s-channel single top quark production in pp collisions at√
s =7 and 8 TeV”, JHEP 09 (2016) 027, doi:10.1007/JHEP09(2016)027,
arXiv:1603.02555.
[11] J. M. Campbell, R. K. Ellis, and R. Roentsch, “Single top production in association with a Z boson at the LHC”, Phys. Rev. D 87 (2013) 114006,
doi:10.1103/PhysRevD.87.114006, arXiv:1302.3856.
[12] J. Pumplin et al., “New generation of parton distributions with uncertainties from global QCD analysis”, JHEP 07 (2002) 012, doi:10.1088/1126-6708/2002/07/012,
arXiv:hep-ph/0201195.
[13] J. Alwall et al., “The automated computation of tree-level and next-to-leading order differential cross sections, and their matching to parton shower simulations”, JHEP 07 (2014) 079, doi:10.1007/JHEP07(2014)079, arXiv:1405.0301.
20 References
[14] NNPDF Collaboration, “Parton distributions with LHC data”, Nucl. Phys. B 867 (2013) 244, doi:10.1016/j.nuclphysb.2012.10.003, arXiv:1207.1303.
[15] ATLAS Collaboration, “Measurement of the ttW and ttZ production cross sections in pp
collisions at√s=8 TeV with the ATLAS detector”, JHEP 11 (2015) 172,
doi:10.1007/JHEP11(2015)172, arXiv:1509.05276.
[16] CMS Collaboration, “Observation of top pairs produced in association with a vector
boson in pp collisions at√s=8 TeV”, JHEP 01 (2016) 096,
doi:10.1007/JHEP01(2016)096, arXiv:1510.01131.
[17] CMS Collaboration, “Measurement of top quark-antiquark pair production in association
with a W or Z boson in pp collisions at√s=8 TeV”, Eur. Phys. J. C 74 (2014) 3060,
doi:10.1140/epjc/s10052-014-3060-7, arXiv:1406.7830.
[18] ATLAS Collaboration, “Measurement of the t¯tZ and t¯tW production cross sections in
multilepton final states using 3.2 fb−1of pp collisions at√s =13 TeV with the ATLAS
detector”, (2016). arXiv:1609.01599. Submitted to Eur. Phys. J. C.
[19] S. L. Glashow, J. Iliopoulos, and L. Maiani, “Weak interactions with lepton hadron symmetry”, Phys. Rev. D 2 (1970) 1285, doi:10.1103/PhysRevD.2.1285. [20] J. M. Yang, B.-L. Young, and X. Zhang, “Flavor changing top quark decays in
R-parity-violating SUSY”, Phys. Rev. D 58 (1998) 055001,
doi:10.1103/PhysRevD.58.055001, arXiv:hep-ph/9705341v3.
[21] G.-R. Lu, F.-R. Yin, X.-L. Wang, and L.-D. Wan, “Rare top quark decays t→cV in the
topcolor assisted technicolor model”, Phys. Rev. D 68 (2003) 015002, doi:10.1103/PhysRevD.68.015002, arXiv:hep-ph/0303122.
[22] J. Aguilar-Saavedra, “Effects of mixing with quark singlets”, Phys. Rev. D 67 (2003) 035003, doi:10.1103/PhysRevD.67.035003, arXiv:hep-ph/0210112. [Erratum: doi:10.1103/PhysRevD.69.099901].
[23] J. Aguilar-Saavedra, “Top flavor-changing neutral interactions: Theoretical expectations and experimental detection”, Acta Phys. Polon. B. 35 (2004) 2695,
arXiv:hep-ph/0409342.
[24] F. del Aguila, J. Aguilar-Saavedra, and L. Ametller, “Zt and γt production via top flavor changing neutral couplings at the Fermilab Tevatron”, Phys. Lett. B. 462 (1999) 310,
doi:10.1016/S0370-2693(99)00929-6, arXiv:hep-ph/9906462.
[25] J.-L. Agram et al., “Probing top anomalous couplings at the LHC with trilepton signatures in the single top mode”, Phys. Lett. B. 725 (2013) 123,
doi:10.1016/j.physletb.2013.06.052, arXiv:1304.5551.
[26] CDF Collaboration, “Search for the flavour-changing neutral-current decay t→Zq in p ¯p
collisions at√s=1.96 TeV”, Phys. Rev. Lett. 101 (2008) 192002,
doi:10.1103/PhysRevLett.101.192002, arXiv:0805.2109.
[27] D0 Collaboration, “Search for flavor changing neutral currents via quark-gluon couplings in single top quark production using 2.3 fb−1of p ¯p collisions”, Phys. Lett. B
[28] ATLAS Collaboration, “Search for single top-quark production via flavour-changing neutral currents at 8 TeV with the ATLAS detector”, Eur. Phys. J. C 76 (2016) 55, doi:10.1140/epjc/s10052-016-3876-4, arXiv:1509.00294.
[29] CMS Collaboration, “Search for anomalous single top quark production in association
with a photon in pp collisions at√s =8 TeV”, JHEP 04 (2016) 035,
doi:10.1007/JHEP04(2016)035, arXiv:1511.03951.
[30] ATLAS Collaboration, “Search for flavour-changing neutral current top-quark decays to
qZ in pp collision data collected with the ATLAS detector at√s=8 TeV”, Eur. Phys. J. C
76(2016) 12, doi:10.1140/epjc/s10052-015-3851-5, arXiv:1508.05796.
[31] CMS Collaboration, “Search for flavor-changing neutral currents in top-quark decays t to
Zq in pp collisions at√s=8 TeV”, Phys. Rev. Lett. 112 (2014) 171802,
doi:10.1103/PhysRevLett.112.171802, arXiv:1312.4194.
[32] G. Durieux, F. Maltoni, and C. Zhang, “Global approach to top-quark flavor-changing interactions”, Phys. Rev. D 91 (2015) 074017, doi:10.1103/PhysRevD.91.074017,
arXiv:1412.7166.
[33] CMS Collaboration, “Performance of electron reconstruction and selection with the CMS
detector in proton-proton collisions at√s=8 TeV”, JINST 10 (2015) P06005,
doi:10.1088/1748-0221/10/06/P06005, arXiv:1502.02701.
[34] CMS Collaboration, “Performance of CMS muon reconstruction in pp collision events at√
s =7 TeV”, JINST 7 (2012) P10002, doi:10.1088/1748-0221/7/10/P10002,
arXiv:1206.4071.
[35] CMS Collaboration, “The performance of the CMS muon detector in proton-proton
collisions at√s=7 TeV at the LHC”, JINST 8 (2013) P11002,
doi:10.1088/1748-0221/8/11/P11002, arXiv:1306.6905.
[36] CMS Collaboration, “The CMS trigger system”, (2016). arXiv:1609.02366. Submitted to JINST.
[37] CMS Collaboration, “The CMS experiment at the CERN LHC”, JINST 3 (2008) S08004,
doi:10.1088/1748-0221/3/08/S08004.
[38] T. Sj ¨ostrand et al., “An introduction to PYTHIA 8.2”, Comput. Phys. Commun. 191 (2015) 159, doi:10.1016/j.cpc.2015.01.024, arXiv:1410.3012.
[39] T. Sj ¨ostrand, S. Mrenna, and P. Skands, “PYTHIA 6.4 physics and manual”, JHEP 05 (2006) 026, doi:10.1088/1126-6708/2006/05/026, arXiv:hep-ph/0603175. [40] E. Re, “Single-top Wt-channel production matched with parton showers using the
POWHEG method”, Eur. Phys. J. C 71 (2011) 1547,
doi:10.1140/epjc/s10052-011-1547-z, arXiv:1009.2450.
[41] S. Alioli, P. Nason, C. Oleari, and E. Re, “A general framework for implementing NLO calculations in shower Monte Carlo programs: the POWHEG BOX”, JHEP 06 (2010) 043,
doi:10.1007/JHEP06(2010)043, arXiv:1002.2581.
[42] S. Alioli, P. Nason, C. Oleari, and E. Re, “NLO single-top production matched with shower in POWHEG: s- and t-channel contributions”, JHEP 09 (2009) 111,
22 References
[43] S. Frixione, P. Nason, and C. Oleari, “Matching NLO QCD computations with parton shower simulations: the POWHEG method”, JHEP 11 (2007) 070,
doi:10.1088/1126-6708/2007/11/070, arXiv:0709.2092.
[44] A. Alloul et al., “FeynRules 2.0—A complete toolbox for tree-level phenomenology”, Comput. Phys. Commun. 185 (2014) 2250, doi:10.1016/j.cpc.2014.04.012, arXiv:1310.1921.
[45] C. Degrande et al., “UFO—The Universal FeynRules Output”, Comput. Phys. Commun.
183(2012) 1201, doi:10.1016/j.cpc.2012.01.022, arXiv:1108.2040.
[46] M. Guzzi et al., “CT10 parton distributions and other developments in the global QCD analysis”, (2011). arXiv:1101.0561.
[47] CMS Collaboration, “Study of the underlying event at forward rapidity in pp collisions
at√s=0.9, 2.76, and 7 TeV”, JHEP 04 (2013) 072, doi:10.1007/JHEP04(2013)072,
arXiv:1302.2394.
[48] CMS Collaboration, “Event generator tunes obtained from underlying event and multiparton scattering measurements”, Eur. Phys. J. C 76 (2016) 155,
doi:10.1140/epjc/s10052-016-3988-x, arXiv:1512.00815.
[49] M. Czakon and A. Mitov, “Top++: a program for the calculation of the top-pair cross-section at hadron colliders”, Comput. Phys. Commun. 185 (2014) 2930, doi:10.1016/j.cpc.2014.06.021, arXiv:1112.5675.
[50] K. Melnikov and F. Petriello, “Electroweak gauge boson production at hadron colliders
throughO(α2s)”, Phys. Rev. D 74 (2006) 114017, doi:10.1103/PhysRevD.74.114017,
arXiv:hep-ph/0609070.
[51] N. Kidonakis, “Two-loop soft anomalous dimensions for single top quark associated
production with a W−or H−”, Phys. Rev. D 82 (2010) 054018,
doi:10.1103/PhysRevD.82.054018, arXiv:1005.4451.
[52] J. M. Campbell, R. K. Ellis, and C. Williams, “Vector boson pair production at the LHC”, JHEP 07 (2011) 018, doi:10.1007/JHEP07(2011)018, arXiv:1105.0020.
[53] J. M. Campbell and R. K. Ellis, “t¯tW±production and decay at NLO”, JHEP 07 (2012)
052, doi:10.1007/JHEP07(2012)052, arXiv:1204.5678.
[54] M. V. Garzelli, A. Kardos, C. G. Papadopoulos, and Z. Trocsanyi, “t¯tW±and t¯tZ
hadroproduction at NLO accuracy in QCD with parton shower and hadronization effects”, JHEP 11 (2012) 056, doi:10.1007/JHEP11(2012)056, arXiv:1208.2665. [55] GEANT4 Collaboration, “GEANT4 — a simulation toolkit”, Nucl. Instrum. Meth. A 506
(2003) 250, doi:10.1016/S0168-9002(03)01368-8.
[56] A. Giammanco, “The fast simulation of the CMS experiment”, J. Phys. Conf. Ser. 513 (2014) 022012, doi:10.1088/1742-6596/513/2/022012.
[57] CMS Collaboration, “Particle–flow event reconstruction in CMS and performance for jets,
taus, and EmissT ”, CMS Physics Analysis Summary CMS-PAS-PFT-09-001, 2009.
[58] CMS Collaboration, “Commissioning of the particle–flow event reconstruction with the first LHC collisions recorded in the CMS detector”, CMS Physics Analysis Summary CMS-PAS-PFT-10-001, 2010.
[59] A. Perloff, “Pileup measurement and mitigation techniques in CMS”, J. Phys. Conf. Ser.
404(2012) 012045, doi:10.1088/1742-6596/404/1/012045.
[60] CMS Collaboration, “Measurement of inclusive W and Z boson production cross sections
in pp collisions at√s=8 TeV”, Phys. Rev. Lett. 112 (2014) 191802,
doi:10.1103/PhysRevLett.112.191802, arXiv:1402.0923.
[61] M. Cacciari, G. P. Salam, and G. Soyez, “The anti-ktjet clustering algorithm”, JHEP 04
(2008) 063, doi:10.1088/1126-6708/2008/04/063, arXiv:0802.1189.
[62] M. Cacciari, G. P. Salam, and G. Soyez, “FastJet user manual”, Eur. Phys. J. C 72 (2012) 1896, doi:10.1140/epjc/s10052-012-1896-2, arXiv:1111.6097.
[63] CMS Collaboration, “Jet energy scale and resolution in the CMS experiment in pp collisions at 8 TeV”, JINST 12 (2017) P02014,
doi:10.1088/1748-0221/12/02/P02014, arXiv:1607.03663.
[64] CMS Collaboration, “Performance of b tagging at√s=8 TeV in multijet, t¯t and boosted
topology events”, CMS Physics Analysis Summary CMS-PAS-BTV-13-001, 2013. [65] L. Breiman, J. Friedman, C. J. Stone, and R. A. Olshen, “Classification and regression
trees”. Chapman & Hall, New York, 1984.
[66] H. Voss, A. H ¨ocker, J. Stelzer, and F. Tegenfeldt, “TMVA, the toolkit for multivariate data analysis with ROOT”, in XIth International Workshop on Advanced Computing and Analysis Techniques in Physics Research (ACAT), p. 40. 2007. arXiv:physics/0703039.
[67] CMS Collaboration, “CMS luminosity based on pixel cluster counting — Summer 2013 update”, CMS Physics Analysis Summary CMS-PAS-LUM-13-001, 2013.
[68] CMS Collaboration, “Determination of jet energy calibration and transverse momentum resolution in CMS”, JINST 6 (2011) P11002,
doi:10.1088/1748-0221/6/11/P11002, arXiv:1107.4277.
[69] CMS Collaboration, “Identification of b-quark jets with the CMS experiment”, JINST 8 (2013) P04013, doi:10.1088/1748-0221/8/04/P04013, arXiv:1211.4462. [70] R. Barlow and C. Beeston, “Fitting using finite Monte Carlo samples”, Comput. Phys.
Commun. 77 (1993) 219, doi:10.1016/0010-4655(93)90005-W.
[71] T. Muller, J. Ott, and J. Wagner-Kuhr, “Theta—a framework for template-based statistical modeling and inference”, (2012). IEKP-KA-CMS/2012-1.
[72] L. Moneta et al., “The RooStats project”, in 13th International Workshop on Advanced Computing and Analysis Techniques in Physics Research (ACAT2010). SISSA, 2010.
A
The CMS Collaboration
Yerevan Physics Institute, Yerevan, Armenia A.M. Sirunyan, A. Tumasyan
Institut f ¨ur Hochenergiephysik, Wien, Austria
W. Adam, E. Asilar, T. Bergauer, J. Brandstetter, E. Brondolin, M. Dragicevic, J. Er ¨o, M. Flechl, M. Friedl, R. Fr ¨uhwirth1, V.M. Ghete, C. Hartl, N. H ¨ormann, J. Hrubec, M. Jeitler1, A. K ¨onig, I. Kr¨atschmer, D. Liko, T. Matsushita, I. Mikulec, D. Rabady, N. Rad, B. Rahbaran, H. Rohringer, J. Schieck1, J. Strauss, W. Waltenberger, C.-E. Wulz1
Institute for Nuclear Problems, Minsk, Belarus
O. Dvornikov, V. Makarenko, V. Mossolov, J. Suarez Gonzalez, V. Zykunov National Centre for Particle and High Energy Physics, Minsk, Belarus N. Shumeiko
Universiteit Antwerpen, Antwerpen, Belgium
S. Alderweireldt, E.A. De Wolf, X. Janssen, J. Lauwers, M. Van De Klundert, H. Van Haevermaet, P. Van Mechelen, N. Van Remortel, A. Van Spilbeeck
Vrije Universiteit Brussel, Brussel, Belgium
S. Abu Zeid, F. Blekman, J. D’Hondt, N. Daci, I. De Bruyn, K. Deroover, S. Lowette, S. Moortgat, L. Moreels, A. Olbrechts, Q. Python, K. Skovpen, S. Tavernier, W. Van Doninck, P. Van Mulders, I. Van Parijs
Universit´e Libre de Bruxelles, Bruxelles, Belgium
H. Brun, B. Clerbaux, G. De Lentdecker, H. Delannoy, G. Fasanella, L. Favart, R. Goldouzian, A. Grebenyuk, G. Karapostoli, T. Lenzi, A. L´eonard, J. Luetic, T. Maerschalk, A. Marinov, A. Randle-conde, T. Seva, C. Vander Velde, P. Vanlaer, D. Vannerom, R. Yonamine, F. Zenoni, F. Zhang2
Ghent University, Ghent, Belgium
A. Cimmino, T. Cornelis, D. Dobur, A. Fagot, M. Gul, I. Khvastunov, D. Poyraz, S. Salva, R. Sch ¨ofbeck, M. Tytgat, W. Van Driessche, E. Yazgan, N. Zaganidis
Universit´e Catholique de Louvain, Louvain-la-Neuve, Belgium
H. Bakhshiansohi, C. Beluffi3, O. Bondu, S. Brochet, G. Bruno, A. Caudron, S. De Visscher,
C. Delaere, M. Delcourt, B. Francois, A. Giammanco, A. Jafari, M. Komm, G. Krintiras, V. Lemaitre, A. Magitteri, A. Mertens, M. Musich, K. Piotrzkowski, L. Quertenmont, M. Selvaggi, M. Vidal Marono, S. Wertz
Universit´e de Mons, Mons, Belgium N. Beliy
Centro Brasileiro de Pesquisas Fisicas, Rio de Janeiro, Brazil
W.L. Ald´a J ´unior, F.L. Alves, G.A. Alves, L. Brito, C. Hensel, A. Moraes, M.E. Pol, P. Rebello Teles
Universidade do Estado do Rio de Janeiro, Rio de Janeiro, Brazil
E. Belchior Batista Das Chagas, W. Carvalho, J. Chinellato4, A. Cust ´odio, E.M. Da Costa,
G.G. Da Silveira5, D. De Jesus Damiao, C. De Oliveira Martins, S. Fonseca De Souza,
L.M. Huertas Guativa, H. Malbouisson, D. Matos Figueiredo, C. Mora Herrera, L. Mundim,
H. Nogima, W.L. Prado Da Silva, A. Santoro, A. Sznajder, E.J. Tonelli Manganote4, A. Vilela