DEPARTAMENTO DE BIOLOGIA VEGETAL
STUDY OF IRON AND COPPER
METABOLISM IN ALZHEIMER’S DISEASE
Ângela Pascoal da Costa Crespo
MESTRADO EM BIOLOGIA MOLECULAR HUMANA
DEPARTAMENTO DE BIOLOGIA VEGETAL
STUDY OF IRON AND COPPER
METABOLISM IN ALZHEIMER’S DISEASE
Ângela Pascoal da Costa Crespo
MESTRADO EM BIOLOGIA MOLECULAR HUMANA
2009
Dissertação de Mestrado orientada por:
Professor Doutor Manuel do Carmo Gomes
(Faculdade de Ciências da Universidade de Lisboa)
Doutora Luciana Maria Gonçalves da Costa
(Instituto Nacional de Saúde Dr. Ricardo Jorge)
A
GRADECIMENTOS
Apesar de ter escrito a minha tese em Inglês, quero fazer os agradecimentos em Português, uma vez que todas as pessoas a quem estou grata merecem receber o meu reconhecimento da forma mais calorosa possível…e não há língua melhor para tal do que a nossa língua marterna.
- Às minhas orientadoras externas, Doutora Luciana Maria Gonçalves da Costa e Doutora Madalena Cristina da Rocha Martins. Para começar, pela oportunidade de trabalhar num projecto ligado a uma doença tão importante como a doença de Alzheimer e que, pela abordagem feita, me permitiu adquirir, num curto espaço de tempo, conhecimentos muito diversos, tanto a nível teórico como a nível prático-laboratorial. Mas, principalmente, por todo o apoio e dedicação que me prestaram, estando sempre disponíveis para mim, orientando o meu trabalho no melhor sentido. Motivaram-me sempre nos momentos difíceis, tanto profissionais como pessoais, tendo-se revelado não apenas orientadoras, mas verdadeiras amigas que se preocuparam realmente comigo, como pessoa e não apenas como trabalhadora. Devo dizer que considero extremamente injusto o facto de apenas o nome de uma delas poder figurar na sub-capa, porque a orientação foi perfeitamente equitativa. Para as duas, o meu muito obrigado, e nunca esquecerei quem me iniciou na vida científica;
- Ao meu orientador interno, Professor Doutor Manuel do Carmo Gomes, por ser a minha ponte com a Faculdade e pela ajuda na análise estatística;
- Às minhas colegas de laboratório: Liliana Marques, a responsável mais directa pela minha formação a nível laboratorial, por todo o apoio e (paciência…) que me dedicou; Arminda Vilares, pela preciosa ajuda nas colheitas e nas determinações de actividade oxidásica…e por ser alguém com quem podemos sempre contar; e Alexandra Gomes, a minha companheira da aventura do Mestrado, que foi um verdadeiro pilar em todos os momentos (sentimo-nos sempre melhor quando temos alguém connosco no barco…);
- À Unidade Laboratorial Integrada do Departamento de Promoção da Saúde e Doenças Crónicas do Instituto Nacional de Saúde Dr. Ricardo Jorge, pela medição de todos os parâmetros bioquímicos;
- À Joana Xavier, Tiago Krug e João Costa, do Instituto Gulbenkian de Ciência, pelo importantíssimo apoio no trabalho de genotipagem dos genes candidatos;
- Ao Doutor Alexandre Mendonça e respectiva equipa, do Hospital de Santa Maria, e à Doutora Cristina Costa e respectiva equipa, do Hospital Fernando Fonseca, pelo recrutamento e avaliação dos participantes no estudo;
- Aos controlos saudáveis que se voluntariaram para participar no estudo (das Associações de Moradores e Reformados do Campo Grande e da Associação de Alzheimer Portugal)
- À Fundação Astrazeneca, a entidade financiadora do projecto “Biomarkers in Alzheimer’s Disease: The Lipid Homeostasis/Oxidative Stress Connection”, do qual a Doutora Madalena Martins é a Investigadora Responsável e no qual foi integrado o meu projecto de tese de Mestrado, tendo-o tornado, portanto, possível;
- À Fundação para a Ciência e Tecnologia, por me ter concedido parte do subsídio que me permitiu participar na “International Conference in Alzheimer’s Disease 2009” em Viena, Áustria (o restante subsídio foi retirado do orçamento do projecto financiado pela Fundação Astrazeneca);
- Aos meus amigos, que sempre me apoiaram, e que tiveram de ouvir inúmeras vezes “não posso, estou a escrever a tese”…
- Aos meus novos colegas do Programa Doutoral em Biologia Experimental e Biomedicina da Universidade de Coimbra, pela força dada nesta recta final, em especial à Marília Cordeiro, que me salvou ao emprestar-me o computador na última semana (o meu resolveu avariar na melhor altura…);
- E finalmente, aos meus pais, por me terem feito chegar até aqui, dando-me todo o amor, compreensão e paciência do mundo, mesmo quando eu não fazia nada para o merecer... Amo-vos!
A
BSTRACT
Alzheimer’s disease (AD) is the most frequent neurodegenerative disorder worldwide, remarkably characterized by memory impairment. The distinction between normal aging and AD is a relevant step to combat this disease efficiently; thus, the identification of biomarkers and genetic factors underlying AD pathology is extremely important. Oxidative injury in the brain, mediated by the imbalance of redox-active metals, iron (Fe) and copper (Cu), has been recognized to contribute to the pathology of AD. In this context, we further investigated this hypothesis by: (I) comparing serum biochemical markers of Fe/Cu metabolism in a sample of 73 AD patients and 60 healthy controls; (II) testing, in the same sample, a set of Fe/Cu metabolism-related genes and APOE for association with AD. Significant differences were found between female AD patients and controls for serum Fe concentration (71.02 ± 22.34 µg/dL and 86.38 ± 20.80 µg/dL, respectively, p=0.001) and transferrin saturation (22.29 ± 7.89 % and 26.21 ± 6.24 %, respectively, p=0.007). A significant association with AD was found for TF – transferrin gene (p=0.0082) and for the first time for SLC40A1 – ferroportin (Fpn) gene (p=0.0355). APOEε4 was also significantly associated with AD (p=0.0004), in agreement with previous studies. We hypothesize that the lower serum Fe concentration observed in AD patients can be due to impaired Fe excretion from cells, since Fpn is the only known Fe exporter in mammalian cells. The intracellular accumulation of Fe, particularly in the brain, where Fpn is also expressed, would lead to a rise in oxidative damage, contributing to the AD physiopathology. Further research is demanded in a greater sample to confirm the results obtained in this pilot study. Noteworthy, an integrative approach was followed to deal with heterogeneity in this complex disorder, and new directions were raised related to the study of the involvement of Fe metabolism in AD.
Keywords: Alzheimer’s disease, Iron/Copper metabolism, Oxidative stress, Biochemical markers, Genetic susceptibility
R
ESUMO
A doença de Alzheimer (DA) é uma doença neurodegenerativa progressiva que constitui o tipo de demência mais frequente em todo o mundo (60-80% dos casos). O sintoma mais característico é a perda de memória, embora outras funções cognitivas sejam também afectadas. As alterações patológicas nesta doença passam pela perda de neurónios e sinapses, e pela acumulação de agregados de proteínas intracelularmente (tranças neurofibrilares compostas pela proteína tau hiperfosforilada) e extracelularmente (placas senis, constituídas por depósitos de péptido β-amilóide - Aβ). No entanto, a DA é uma doença heterogénea e os mecanismos que conduzem ao seu aparecimento não estão completamente esclarecidos, principalmente na DA “late-onset” esporádica que inclui 95% dos indivíduos com esta doença. A DA “early-onset” hereditária, mais rara, é causada por mutações bem caracterizadas nos genes APP (precursor do péptido amilóide) e PSEN1/2 (presenilinas, proteínas que constituem o centro catalítico de uma das enzimas responsáveis pela produção do péptido amilóide). Alguns estudos identificaram vários factores ambientais e genéticos (como o alelo APOEε4) associados a um maior risco de desenvolver DA esporádica, mas que por si só não são suficientes para explicar o aparecimento da doença. Desta forma, torna-se imperativo compreender a complexa interacção existente entre tais factores. A distinção ente o envelhecimento normal e a DA é um passo muito importante no sentido de poder combater eficazmente esta doença.
Existem várias evidências da contribuição do aumento de stress oxidativo no cérebro para a patofisiologia da DA. O stress oxidativo é causado por uma desregulação na produção de radicais livres (como as espécies reactivas de oxigénio) em relação à produção de antioxidantes. Os radicais livres, quando em excesso, causam danos passíveis de conduzir à apoptose; as células neuronais são especialmente susceptíveis a tais danos, devido ao seu grande consumo de oxigénio. Os metais reactivos, como o ferro (Fe) e o cobre (Cu), acumulam-se normalmente no cérebro com a idade e contribuem para este aumento no stress oxidativo; no entanto, na DA, esta acumulação é mais pronunciada. Aliás, ambos os metais foram encontrados nas placas senis e promovem a formação das mesmas, e reagem com o próprio Aβ, que também tem potencial redox.
Vários estudos associaram alelos de alguns genes envolvidos no metabolismo do Fe com um maior risco de desenvolver DA. Nomeadamente, o gene da transferrina – TF (proteína transportadora de Fe) e HFE – gene da hemocromatose, cuja proteína correspondente tem um papel na regulação da absorção celular de Fe, reforçando assim a hipótese de a patologia da DA estar relacionada com problemas na homeostase de Fe.
Apesar de se esperar que os efeitos mais graves desta desregulação no metabolismo de Fe/Cu ocorram no cérebro, contribuindo assim para o desenvolvimento da DA, é possível que tais anomalias se reflictam no perfil sistémico de marcadores do metabolismo Fe/Cu no sangue. A avaliação destes perfis, integrada com a identificação de novos genes candidatos envolvidos nestes mecanismos e associados à DA, constitui uma interessante abordagem ao estudo da complexidade desta doença.
Neste contexto, compararam-se os valores de marcadores bioquímicos [concentração sérica de Fe, transferrina (Tf) e ferritina (Ft) e saturação de Tf] e imunológicos [concentração sérica de ceruloplasmina (Cp) e actividade oxidásica da mesma] do metabolismo de Fe/Cu medidos numa amostra de 73 doentes de Alzheimer e 60 controlos saudáveis, para pesquisar diferenças significativas entre os dois grupos. Nesta mesma amostra, testou-se a associação de um conjunto de genes directa ou indirectamente ligados ao metabolismo de Fe/Cu (CP - ceruloplasmina, CYBRD1 – citocromo b reductase, HAMP - hepcidina, HFE – gene da hemocromatose, IREB1 – proteína reguladora de ferro 1, IREB2 – proteína reguladora de ferro 2, SLC11A2 – transportador de metais divalentes 1, SLC40A1 - ferroportina, TF - transferrina, TFR2 – receptor 2 da transferrina, CALR - calreticulina, FB19 – proteína fosfatase 1) com o risco aumentado de desenvolver DA. O gene APOE (apolipoproteína E), o único factor genético de susceptibilidade aceite para DA “late-onset”, foi também genotipado para determinar as frequências dos alelos APOEε2, APOE ε3 e
APOE ε4 na nossa população de estudo. Para esta análise, foi realizada uma genotipagem
de alta densidade de polimorfismos (SNPs) seleccionados para estes genes.
Por razões fisiológicas, os valores normais dos parâmetros bioquímicos/imunológicos medidos são diferentes entre homens e mulheres (facto bem estabelecido na literatura). Desta forma, uma vez que as amostras de doentes de DA e controlos saudáveis se encontravam desequilibradas em termos de género, as análises de tais parâmetros foram conduzidas separadamente nos dois géneros.
Os resultados deste trabalho mostraram que a concentração média de Fe no soro das mulheres com DA é significativamente mais reduzida que a das mulheres saudáveis
(
71,02 ± 22,34 µg/dL e 86,38 ± 20,80 µg/dL, respectivamente, p=0,001), verificando-se o mesmo quanto à saturação da Tf (22,29 ± 7,89% nas mulheres com DA e 26,21 ± 6,24 % nas mulheres saudáveis, p=0,007). Os dois parâmetros estão correlacionados – é a mais baixa concentração de Fe que leva a uma mais baixa saturação da Tf. Embora não tenham sido encontradas diferenças significativas nos parâmetros bioquímicos entre homens com DA e homens saudáveis (provavelmente devido ao reduzido número de elementos do sexo masculino nas amostras), verificou-se a mesma tendência observada nas mulheres. De facto, neste estudo, a concentração de Fe no soro foi considerada um parâmetro com valor preditivo para a DA nas mulheres: a construção de um modelo de regressão logística pelométodo de “stepwise backward” não excluiu a [Fe] do modelo final (que incluiu apenas a idade, desajustada na nossa amostra, e a [Fe]). O modelo encontrado indicou que a probabilidade de ser doente de Alzheimer aumenta com a diminuição da [Fe] sérica. Este modelo, no entanto, teve um ajustamento moderado aos dados (R2 = 0,350), pelo que seria importante aumentar o tamanho da amostra estudada e incluir mais factores de risco, para compreender melhor a contribuição dos mesmos para o desenvolvimento da doença.
A análise genotípica revelou uma associação significativa de um maior risco de desenvolver DA com polimorfismos em três genes: APOE (alelo APOEε4, p=0,0004), TF (alelo C2, p=0,0082), ambos já anteriormente associados a DA, e SLC40A1 (rs1439816, p=0,0355), que constitui um resultado novo para um gene (da ferroportina - Fpn) nunca antes associado a DA. A presença destes alelos não se revelou, no entanto, significativamente associada aos resultados a nível bioquímico, embora os portadores (doentes de Alzheimer e controlos) do alelo de SLC40A1 associado a DA tivessem apresentado valores de [Fe] tendencialmente mais reduzidos. Nesta base, propomos a hipótese de a redução de [Fe] sérica (e consequentemente da saturação da Tf) observada nos doentes de DA poder ser devida a uma diminuição da exportação de Fe celular (em cujo processo a Fpn é a única proteína responsável identificada em mamíferos). Desta forma, o Fe poderá estar a acumular-se intracelularmente, onde contribuirá para o aumento do stress oxidativo. A Fpn é também expressa no cérebro, onde os efeitos dos danos oxidativos se farão sentir de forma mais grave devido à maior sensibilidade das células neuronais. O polimorfismo identificado poderá, assim, estar associado a uma ligeira diminuição da função da Fpn. De facto, foram já identificadas (em estudos anteriores) mutações em SLC40A1 responsáveis pelo desenvolvimento de um tipo de hemocromatose, uma doença de acumulação generalizada de Fe nos tecidos, onde se observam valores reduzidos de [Fe] no soro.
Em suma, o nosso estudo vem reforçar a hipótese da existência de alterações na homeostase do Fe na DA, mostrando a validade da estratégia integrativa aplicada. Este trabalho pode ser encarado como um estudo piloto que vem ajudar a direccionar a investigação futura, onde se tentará replicar os resultados numa amostra maior e tendo em conta outros factores de risco importantes para a DA.
Palavras-chave: Doença de Alzheimer, Metabolismo de Ferro/Cobre, Stress Oxidativo, Marcadores bioquímicos, Susceptibilidade genética
I
NDEX
Agradecimentos ... iii Abstract ... v Resumo ... vi 1. Introduction ... 11.1. Alzheimer’s disease: Epidemiology, Social Burden and Clinical Facts... 1
1.2. Biology and Pathophysiology of the Disease ... 3
1.3. Genetic Factors of the Disease ... 4
1.4. The Oxidative Stress / Metals Hypothesis in Alzheimer’s Disease ... 5
1.5. Objectives ... 9
2. Materials and Methods ... 10
2.1. Individuals: Recruitment and Clinical Characterization ... 10
2.1.1. Clinical Evaluation of Subjects ... 10
2.1.2. Sample Collection and Storage ... 11
2.1.3. Database and Biological Bank ... 11
2.2. Assessment of Fe/Cu Metabolism Role in the Pathology of AD ... .11
2.2.1. Measurement of Biochemical and Immunological Parameters ... 11
2.2.2. Genotyping of Variants on Fe/Cu related genes ... 12
2.2.2.1. DNA Extraction ... 12
2.2.2.2. SNP selection for genotyping ... 12
2.2.2.3. PCR primer design ... 12
2.2.2.4. MALDI-TOF MassARRAY genotyping procedure ... 13
2.2.2.4.1. Amplification reaction ... 13
2.2.2.4.2. MassEXTEND reaction ... 13
2.2.2.4.3. Genotype Calling and Results ... 13
2.3. Statistical Analysis ... .13
3. Results ... 14
3.1. Measurement of Biochemical and Immunological Parameters ... .14
4. Discussion ... 23 5. References ... 27
I
NDEX OF
T
ABLES AND
F
IGURES
Figure 1 - Schematic representation of Fe uptake and export in the brain ... 7 Figure 2 - Boxplots of the biochemical/immunological parameters measured in AD patients and controls, organized by gender ... 15
Figure 3 - Negative logarithmized significance values of the association of SNPs with
Alzheimer’s disease ... 21
Table I - Means, standard deviation and normal range of each biochemical/ immunological parameter measured in serum from male AD cases and controls, after removal of
outliers ... 14
Table II - Means, standard deviation and normal range of each biochemical/ immunological parameter measured in serum from female AD cases and controls, after removal of
outliers ... 14
Table III - Spearman correlation analysis of the biochemical/immunological parameters measured with age, in each gender. ... 17
Table IV – Multivariate analysis of variance of the biochemical/ immunological parameters between AD patients and controls, in each gender ... 17
Table V – Final logistic regression model for men ... 18
Table VI – Final logistic regression model for women ... 19
1.
I
NTRODUCTION
1.1.
A
LZHEIMER’
SD
ISEASE:
E
PIDEMIOLOGY,
S
OCIALB
URDEN ANDC
LINICAL FACTSAlzheimer’s disease (AD) is a neurodegenerative disorder that is classified as a type of dementia, being actually the most frequent dementia worldwide, accounting for 60-80% of the cases (Alzheimer’s Association – www.alz.org). According to estimates by Alzheimer’s Disease International (www.alz.co.uk), approximately 30 million people have some type of dementia worldwide and this number is believed to rise to 100 million in 2050, with the increasing number of aged population. This same source reports that 60% of people with dementia live in developing countries. In Portugal, estimates from Associação Portuguesa de
Familiares e Amigos de Doentes de Alzheimer (www.alzheimerportugal.org) indicate that
approximately 70 000 individuals suffer from AD. The estimated total world-wide cost of dementia is of 248 billion USD. AD has become a serious problem of public health and economy, as well as an enormous burden for families and society (Jellinger, 2006).
As a dementia, AD shares some of the characteristics of the other types, being difficult to perform diagnosis based only on the neuropsychological symptoms. AD has an insidious onset and a complex and heterogeneous progression, with many stages of severity that can include several disabilities, leading to death in 10-15 years (Jellinger, 2006). The most remarkable and earliest symptom is memory loss, but the disease advances and can affect language and communication, executive function and social life, causing dependency in most activities. Most patients present disorientation, lack of recognition and behavioral alterations such as changes of personality, aggressiveness, delusions, compulsiveness, anxiety and depression (Schmitt et al, 2006).
The most widely accepted criteria for diagnosis of AD (mainly for research purposes) are described by the Diagnostic and Statistical Manual of Mental Disorders (DSM-IV-TR) and the National Institute of Neurological Disorders and Stroke-Alzheimer Disease and Related Disorders (NINCDS-ADRDA) working group. The neuropsychological state of a patient is evaluated with a battery of tests like Mini-Mental State Examination – MMSE, the most widely used assessment, or the Clinical Dementia Rating Scale – CDR (Schmitt et al, 2006). The definite diagnosis of AD can only be confirmed post-mortem using histopathological methods to identify the characteristic pathological alterations in the brain.
The comprehension of the pathophysiology of AD is improving and, presently, it is possible to recognize markers of the disease in brain structure with magnetic resonance imaging (MRI), to study molecular neuroimaging changes with positron emission tomography (PET) and to measure alterations in cerebrospinal fluid biomarkers, features that have been proposed to be included in the NINCDS-ADRDA criteria (Dubois et al, 2007). However, many
of such observed alterations are not exclusive of AD and clinicians can still only diagnose “probable AD” (Dubois et al, 2007). The most obvious signs of AD only appear in later stages, so it is urgent to improve early diagnosis, in order to start the treatment of symptoms when the littlest possible number of faculties has already been lost.
It is accepted that there is a symptomatic “predementia phase” of AD, and it is characterized by symptoms that, although not severe enough to fulfill the accepted criteria for AD, are signs of cognitive and subjective/objective memory impairment, even if not interfering with daily life. This phase is known as mild cognitive impairment (MCI) and people in such stage have higher probability of progressing to clinically diagnosed dementia (Dubois
et al, 2007). The identification of this phase is crucial to start treatment in an early stage and
at least try to slow the probable progression to dementia. The distinction of normal aging and AD is, therefore, one first step to combat this disease efficiently.
Many studies have tried to identify risk factors for Alzheimer’s disease in order to find what conditions must be avoided or more attentively observed to prevent disease. The factors evaluated are usually based on lifestyle, physiological status or demographic characteristics. For instance, the Canadian Study of Health and Aging (a nation-wide population based study) found a significant association of a number of factors like advanced age (the major risk factor), lower level of education and apolipoprotein E ε4 (APOEε4) allele, with higher risk of developing Alzheimer’s disease. On the other hand, arthritis, regular use of non-steroid anti-inflammatory drugs, wine consumption, coffee consumption and regular physical activity were found to be protective (Lindsay et al, 2002). Other studies reported associations of female gender (Placanica L, 2009), aluminium intake (Flaten, 2001), traumatic brain injury (Lye et al, 2000), previous depression (Green et al, 2003), elevated serum cholesterol and blood pressure (Kivipelto et al, 2001; Kivipelto et al, 2002) with higher risk of developing the disease, while women taking estrogen on menopause seemed to be protected against an early onset of AD (Tang et al, 1996). However, the majority of these findings have not been reproduced in subsequent studies, giving further support to the fact that AD is a complex and heterogeneous disease. For example, subsequent studies of the age-specific incidence of AD showed no significant difference between women and men. Gender appears not to be a risk factor for AD or other dementias after the influence of age is taken into account. In fact, women seem to be at higher risk of developing AD and other dementias because they live long enough for it, and generally live longer than men (Alzheimer’s Association, 2009). These observations show the complexity of the pathophysiology of this disease and the need for more accurate studies to understand its heterogeneity.
1.2.
B
IOLOGY ANDP
ATHOPHYSIOLOGY OF THED
ISEASEThe definitive diagnosis of AD can only be achieved with post-mortem examinations. The hallmarks of AD in the brain are extracellular and intracellular protein deposits named senile plaques and neurofibrillary tangles, respectively. These deposits are widespread in the brain, but occur mainly in brain regions involved in learning and memory and emotional behaviors such as the entorhinal cortex, hippocampus, basal forebrain and amygdala, causing various types of lesions (Mattson, 2004).
Senile plaques are microscopic fibrillary and amorphous aggregates of a peptide named β-amyloid (Aβ). This peptide results from the cleavage of a precursor protein, the amyloid peptide precursor (APP), and its aggregates are visible with in vivo imaging with specific staining. APP is expressed in many cells types in the whole human body and its expression is regulated by the developmental and physiological state of the cells. This protein is integrated in the membrane and the fragment Aβ is localized close to the C-terminus. Its functions are not completely understood, but there is some evidence that it can be involved in the regulation of neuronal survival, neurite outgrowth, synaptic plasticity and cell adhesion (Mattson, 2004). APP is cleaved by 3 different secretases: α-, β- and γ-secretase. α-secretase is a membrane bound protein and its cleavage action releases APP from cell surface avoiding formation of Aβ, because its point of cleavage relies inside Aβ sequence. For Aβ formation, APP must be cleaved first by β-secretase, closer to the N-terminus, and then by γ-secretase, closer to the C-terminus. After this first cleavage, the peptide can be further processed by γ-secretase to generate the two most commons forms of Aβ, Aβ1-40 and Aβ1-42 (Mattson, 2004). These peptides are hydrophobic and can oligomerize, forming aggregates that precipitate and accumulate. The Aβ1-42 form has two additional hydrophobic aminoacid residues, being more susceptible to precipitation. Furthermore, the deposition of Aβ is related to an imbalance between its production and clearance. These deposits are associated with various cell components: ApoE, cholesterol, ApoJ, metals as copper (Cu), zinc (Zn) and iron (Fe), components of the extracellular matrix, and enzymes such as α1-antichymotrypsin and cathepsin D (Duyckaerts et al, 2009). The increased Aβ deposition that occurs in AD contributes to the neurodegeneration observed: Aβ aggregates can be directly toxic to neurons and also increases their vulnerability to oxidative and metabolic stress (Mattson et al, 2004). Moreover, the presence of senile plaques triggers an inflammatory process that causes injury to the brain (Duyckaerts et al, 2009).
On the other hand, the neurofibrillary tangles are intracellular helical filaments constituted by a hyperphosphorylated form of a microtubule-associated protein named tau. In healthy individuals, tau binds to and stabilizes microtubules, and this process requires a cycle of phosphorylation and dephosphorylation. In AD, an abnormal hyperphosporylation without the subsequent dephosphorylation is observed, and it causes the polymerization of
tau into straight filaments that crosslink with each other, affecting neuronal transport and eventually leading to neuron apoptosis (Kar et al, 2004). Tau pathology predominates in entorhinal cortex, hippocampus and amygdala, and these brain areas suffer of great atrophy, caused by neuronal death, but also loss of neuron volume. This atrophy, although well associated with tau deposits, is a generalized happening in the brain and can be observed macroscopically with brain imaging techniques (Duyckaerts et al, 2009).
Finally, the major contributor for Alzheimer’s dementia is, probably, synaptic loss. Synapses start to degenerate in hippocampus and neocortex, and this loss is probably related to tangle and plaque formation, since these phenomena colocalize. In AD, there is evidence of a failure of local neuronal regulatory mechanisms of synaptic plasticity, making a primary disturbance of synapse turnover an acceptable hypothesis. A pre-synaptic marker, synaptophysin, has been shown to decrease at early stages of AD. Synaptic loss is due partly to neuronal loss, but also to disruption of synapses in living neurons. It is suggested that Aβ oligomers impair synaptic plasticity mechanisms necessary for memory processing, while tau dysfunction perturbs axonal transport (Duyckaerts et al, 2009, Mattson, 2004).
1.3.
G
ENETICF
ACTORS OF THED
ISEASEAD is a multifactorial disease without a simple mode of inheritance. In terms of age of onset, AD can be classified in late-onset (usually sporadic) and early-onset, which is, in most cases, familial and autosomal dominant. This last form of disease is rare and caused by mutations in three identified genes: the gene for amyloid precursor protein (APP) and the genes for presenilin-1 and presenilin-2 (PSEN1 and PSEN2). Presenilins form the catalytic centre of the γ-secretase complex. The mutations in any of the three genes increase the frequency of formation of the Aβ1-42 species, which has a higher tendency to aggregate (Bertram et al, 2008).
The genetic susceptibility for late-onset sporadic form of disease is much more complex and less obvious. There is, probably, a combination of alleles that confer a higher risk of developing the disease, instead of only one. To date, several genome-wide association studies, systematic meta-analyses and candidate gene approaches have been performed and the results are available in an online database – AlzGene (www.alzgene.org). Despite all the information gathered, the only consistently reproduced result is the APOE ε4 allele, which confers a higher risk of developing late-onset AD. Some single nucleotide polymorphisms (SNPs) in close proximity to this gene have also been associated to AD, which may reflect linkage disequilibrium (LD) with APOE ε4 (Bertram et al, 2008).
The APOE gene has 3 alleles, APOE ε2, APOE ε3 and APOE ε4. The protein encoded, ApoE, is a cholesterol transport protein that binds to the low density lipoprotein
receptor (LDLR) and to LDLR-related protein (LRP). The ε3 is the most common allele and
ε4 type accounts for 15% of the APOE alleles in the general population. AD population
presents a frequency of 45% of APOE ε4 and homozygotes have 9- to 10-fold higher risk of developing dementia, although this effect depends on gender and age. APOE ε2 has a contrary effect, seeming to be protective (Gandy et al, 2005).
The mechanisms by which ApoE influence the development of AD are still not fully understood. Some evidence point to a defective distribution (by ApoE ε4) of lipids among cells in the central nervous system (CNS), which is important for cellular maintenance and repair. Also, ApoE suffers neuron-specific cleavage and this phenomenon affects ApoE ε4 more than ApoE ε3, releasing neurotoxic fragments that cause mitochondrial dysfunctions and cytoskeletal changes like formation of fibrils (Mahley et al, 2009). This mitochondrial dysfunction may involve a rise in oxidative stress, which is toxic to neurons. Further support for this hypothesis is given by the fact that ApoE ε4 was reported to have less anti-oxidant power than the other forms (Mattson, 2004).
1.4.
T
HEO
XIDATIVES
TRESS/
M
ETALSH
YPOTHESIS INA
LZHEIMER’
SD
ISEASEOxidative stress is caused by the overproduction of reactive oxygen (ROS) and nitrogen species (RNS), which consist of oxygen free radicals and related molecules like superoxide free radicals (O2•-), single oxygen (O-), nitric oxide (NO), hydrogen peroxide (H2O2) and peroxynitrite. This phenomenon contributes to destruction of neurons and vascular cells (Chong et al, 2005). The brain has a high oxygen consumption rate, considerable lipid content and few antioxidant enzymes when compared to other tissues, and these features make CNS very vulnerable to free radical damage. It is possible that cumulative oxidative damage over time account for late life onset and progressiveness of neurodegenerative disorders (Praticò, 2008). The consequences of the ROS production include membrane lipid destruction, cleavage of DNA and inhibition of complex enzymes in the electron transport chain of mitochondria, blocking mitochondrial respiration. These injuries usually lead to cellular apoptosis (Chong et al, 2005).
In AD, oxidative stress seems to play an important, not to say crucial, role in its pathophysiology. The brains of AD patients show evidence of ROS injury, and several oxidative stress products, such as 4-hydroxynonenal and advanced glycation endproducts, have been found close to Aβ deposits and neurofibrillary tangles (Sultana et al, 2009). It has been reported that human Aβ is redox-active, being able to produce H2O2 in a cell free dependent manner and can induce lipid peroxydation (Mattson, 2004). Also, heme-oxygenase, another indicator of oxidative stress response, colocalizes with the altered form of tau. On the other hand, oxidative stress seems to increase Aβ formation and aggregation, and neurofibrillary tangle formation can be influenced by oxidative modifications in tau
protein (Markesbery, 1997, Mattson, 2004). Thus, it is plausible that there may be some other sources of oxidative stress in the AD brain. The accumulation of redox-active metals such as iron (Fe) and copper (Cu) is a hypothesis that has gained increasing strength in the explanation in brain oxidative damage (Praticò, 2008).
Fe is an essential element in the human body and is particularly abundant in the brain, where it progressively accumulates with age (Zecca et al, 2004). This metal exists in two ionic forms, Fe3+ (ferric ion, non-reactive) and Fe2+ (ferrous ion). The last one is able to interact with H2O2 and generate ROS and free radicals (OH-) through the Fenton reaction, largely potentiating oxidative damage (Markesbery, 1997).
Several proteins are involved in Fe uptake and metabolism in the peripheral tissues and in the brain. Dietary Fe uptake takes place in the duodenum, which cells express a proton coupled Fe2+ transporter, divalent-metal transporter 1 (DMT1) in their apical membrane. These cells express also a reductase, duodenum cytochrome B reductase (Dcytb), which reduces Fe3+ to Fe2+ for transport by DMT1. In their basolateral membrane, the same cells express the only Fe exporter known in mammalians, IREG1 (Ferroportin or Fpn). Fpn exports Fe2+ from cells to circulation, where it is bound by transferrin (Tf - which has a high affinity for Fe) after being oxidized to Fe3+ by hephaestin, a duodenum ferroxidase. The circulating Fe can enter other cells through interaction of Tf with Tf receptor 1 (TfR1): the binding of Fe-loaded Tf to TfR1 causes the internalization of the complex formed in endosomes. The acid environment of endosomes promotes Fe3+ release and the endosomal reductases convert it to Fe2+, which is able to be transported to cytosol by endosomal DMT1. In the cytosol, Fe2+ can be bound by ferritin (Ft), which converts it to Fe3+ for storage. Cellular Fe uptake is regulated by a system of two iron regulatory proteins: IRP1/IRP2. These proteins perform a post-transcriptional regulation of expression of Ft and TfR in response to cell iron status, by binding to an IRE (iron regulatory element) in the 3’-UTR of TfR and 5’-3’-UTR of Ft. IRP1 and IRP2 control, in this way, Fe uptake, storage and homeostasis in the cells (Rouault et al, 2006). When these cells excrete Fe in its Fe2+ form, it is then oxidized to Fe3+ by ceruloplasmin (Cp), a Cu-binding protein present in serum (Zecca
et al, 2004), for incorporation into Tf. Absorption of dietary Fe is tightly regulated by
hepatocytes which secrete a regulatory peptide hormone, hepcidin, in direct proportion to hepatocytic Fe stores. Hepcidin secretion is higher in Fe-repleted hepatocytes; it binds to Fpn in duodenum cells and macrophages, causing its internalization and degradation in lysosomes. This way, hepcidin causes a decrease of serum Fe levels. There are several other proteins that contribute for Fe metabolism regulation: for example, appropriate hepatocytic hepcidin expression requires a TfR binding protein, HFE (hemochromatosis protein), which competes with Fe-bound Tf and regulates Fe entry in the cells. Mutations in HFE cause type I hemochromatosis, a disease of generalized Fe overload in the body
(Rouault et al, 2006), and mutations in hepcidin gene cause type II hemochromatosis (De Domenico et al, 2007).
The regulation of Fe metabolism in the brain is independent from liver, because of the blood-brain barrier (BBB). To enter the brain, Fe has to cross BBB: Fe-bound Tf binds TfR1 expressed on the luminal membrane of the endothelial cells of brain capillaries, and after Fe release in the cytosol, probably dependent on DMT1 (which is highly expressed in neurons), it is exported to the CNS by Fpn. Astrocytes in the BBB also express a membrane bound form of Cp [linked by a glycosilphosphatidylinositol (GPI) anchor], generated by alternative splicing (in relation to secreted Cp). Cp promotes Fpn activity by oxidizing the Fe2+ released to Fe3+ (non-toxic), which allows it to bind to Tf in the interstitial fluid (Rouault et al, 2006)- Figure 1. There is another form of TfR, TfR2, expressed in the brain (although also expressed in the liver), which is not regulated by Fe and has the ability of modulating hepcidin expression (Waheed et
al, 2008). Mutations in
TfR2 are responsible for
type III hemochromatosis (De
Domenico et al, 2006).
In AD pathology, Fe is associated with senile plaques and neurofibrillary tangles, and significantly increased Fe has been found in amygdala, hippocampus and olfactory pathway of AD brains compared with age-matched controls (Avramovich-Tirosh et
al, 2008). Ft and Tf have been found to be associated to senile plaques in AD. Besides, Fe
has been shown to enhance Aβ aggregation and to potentiate the formation of H2O2 by Aβ (Huang et al, 1999, Avramovich-Tirosh et al, 2008).
Fe metabolism and AD pathogenesis were shown to have a connection through IRP1 and IRP2. In AD, IRP2 protein levels are increased and associated with neurofibrillary tangles and oxidative stress markers (Smith et al, 1998). Besides, mutations in IREB2 (IRP2 gene) have been association with brain iron overload in mice (Rouault et al, 2006). But the
Figure 1 – Schematic representation of Fe uptake and export in the brain. Adapted from Moos et al, 2007
Astrocytic end‐foot
most remarkable finding was reported by Rogers et al in 2002: they described an IRE in the 5’-UTR of APP transcript, and this IRE is selectively responsive to intracellular Fe levels, showing an Fe-dependent regulation of APP synthesis.
In addition, genetic association studies have found an increased risk of AD in individuals with the allele C2 of transferrin gene (TF) and with hemachromatosis gene - HFE (substitutions C282Y and H63D), being the latest the cause of hereditary hemochromatosis type I. The two genes are also expressed in the brain, and carriers of the referred mutations have AD risk augmented 2-5 fold (Zecca et al, 2004).
Copper (Cu) is another transition metal that can function as a catalyst for oxygen free radical generation. As Fe, free Cu (not bound to proteins) is found in senile plaques and seems to increase Aβ aggregation and to participate in the redox reactions promoted by Aβ (Cu2+ is reduced to Cu+) (Lynch et al, 2000). Moreover, APP (and Aβ) has a Cu-binding site, being able to modulate Cu-induced toxicity and oxidative stress in vitro (reducing Cu2+ to Cu+). Some reports show that depletion of intracellular Cu results in decreased APP gene expression (Bellingham et al, 2004). The oxidative stress generation (mediated by Cu) cause modifications in Aβ itself, increasing its resistance to proteolysis. Cu is also a co-factor for β-secretase, and Aβ binds Cu and cholesterol, facilitating Cu oxidation of cholesterol to 7–OH cholesterol, a toxic compound to neurons. The Cu implicated in the ROS production is the “free” Cu, non-covalently bound to proteins and other molecules (Brewer, 2007).
Fe and Cu metabolism have an intimate physiological connection through Cp. Cp is a serum α2-glycoprotein containing over 95% of the circulating Cu of vertebrates, belongs to the multicopper oxidase family of enzymes and is an acute phase reactant. Serum Cp concentration reflects serum Cu levels. The incorporation of Cu is necessary for its ferroxidase activity. Its concentration in serum increases during inflammation, infection and trauma. The main source of serum Cp is the liver, but its expression has been demonstrated in other tissues namely in brain (Hellman et al, 2002). Particularly, Cp has been shown to be present in the membrane of astrocytes, linked via a GPI anchor, as already referred, exhibiting ferroxidase activity. Thereby, Cp prevents oxidative damage in the CNS by avoiding toxic Fe2+ accumulation in brain cells (converting it to the non-toxic Fe3+) (Patel et al, 2002). Cp decreased expression or function leads to neurological diseases such as aceruloplasminemia (hereditary deficiency in Cp) or Wilson’s disease (autosomal recessive disorder of Cu transport that leads to a deficient incorporation of Cu into Cp to produce holo-Cp) (Hellman et al, 2002). A study by Capo et al, in 2008, reported that Cp is less active in the cerebrospinal fluid (CSF) of AD patients than in controls, since there is a larger percentage of apo-Cp (not bound to copper). The observed decreased ferroxidase activity of Cp likely contributes to rise oxidative stress in the CNS, probably involved in AD pathology.
The amount of evidence already gathered strengthens the hypothesis that an impaired Fe/Cu homeostasis contributes to AD pathophysiology. This impairment may be due to deficiencies in the cellular uptake or export, transport, processing or storage of these metals, which are probably caused by abnormalities of expression, function or distribution of the Fe/Cu related proteins referred, that become more severe in the aged population and particularly in AD patients. Furthermore, it is likely that several deficiencies in these mechanisms have an underlying genetic cause.
Although the most severe effects of such abnormal events are expected to occur in the brain, contributing to the development of AD, it is reasonable to presume that such altered metabolism have a reflection on the systemic profile of Fe/Cu related proteins, namely in the peripheral blood. The evaluation of such profile, combined with the identification of new candidate genes involved in these mechanisms and associated to AD outcome, constitute an integrative approach to deal with the heterogeneity and complexity of AD.
1.5.
O
BJECTIVESIn this main context, our present work had two main objectives:
I) to compare biochemical (concentration of serum Fe, Tf, and Ft and determination of Tf saturation) and immunological (serum Cp concentration and Cp oxidase activity) markers of Fe/Cu metabolism in a sample of AD patients and age-matched healthy controls, in order to check if there are specific parameters associated to increased AD risk;
II) to test, in the same sample, a set of Fe/Cu related genes [CP – ceruloplasmin,
CYBDR1 - Dcytb (duodenal cytochrome B ferrireductase), HAMP – hepcidin, HFE –
hemochromatosis gene, IREB1 and IREB2 - iron regulatory proteins 1 and 2, SLC11A2 – DMT1 (divalent metal transporter 1), SLC40A1 – ferroportin, TF - transferrin and TFR2 – transferrin receptor 2] for the association with an higher risk of developing AD.
In addition, we decided to include two more genes, FB19 (protein phosphatase 1) and
CALR (calreticulin), based on their possible association with AD development and indirect
relation with Fe/Cu metabolism/oxidative stress. FB19 is a relatively recent described gene that lies in the MHC Class I cluster, in the same chromosomal region of HFE. Since an association was previously found between variants in HFE gene and AD, there is an hypothesis of linkage disequilibrium between variants of HFE and FB19 (Totaro et al, 1998). Calreticulin is a protein involved in calcium regulation and that has been hypothesized to interact with complement cascade of immune system, increasing ROS production in neurons that can contribute to AD (Luo et al, 2003). We also genotyped APOE gene, in order to determine the frequencies of APOE ε2, APOE ε3 and APOE ε4 alleles in our population.
2.
M
ATERIALS AND
M
ETHODS
2.1.
I
NDIVIDUALS:
R
ECRUITMENT ANDC
LINICAL CHARACTERIZATION2.1.1. Clinical evaluation of subjects
In this study, 73 AD patients [mean±SD age: 75±8 years; 14 men (72±9 years), 59 women (76±7 years)] attending the Outpatient Clinics at Hospital de Santa Maria and Hospital Fernando Fonseca, were included as cases. The clinical evaluation and characterization of AD patients was performed as defined by the National Institute of Neurological and Communicative Diseases and Stroke/Alzheimer's Disease and Related Disorders Association (NINCDS-ADRDA) criteria (McKhann et al, 1984). AD cases were subjected to clinical history, neurological examination, and a detailed neuropsychological assessment using the Battery of Lisbon for the Assessment of Dementia (Garcia, 1984). Mean MMSE of AD patients was 13.9.
The 60 control subjects [mean±SD age: 69±8 years; 28 men (70±8 years), 32 women (68±8years)] recruited were elderly people without any sign of cognitive decline, namely spouses or caretakers of the AD patients from the two hospitals and Associação de
Alzheimer de Lisboa, and attendees of Associação de Moradores do Campo Grande and Associação de Reformados do Campo Grande. Mean MMSE of controls was 28.6. The
inclusion criteria for the control subjects (Ribeiro et al, 2006) were age (≥ 50 years), Mini Mental State Examination (MMSE) score above cut-off (range 0-30; cut-offs: >15 if illiterate, > 22 if with 1-11 years of education and >27 if with more than 11 years of education) (Wechsler, 1969), community dwelling with maintained activities of daily living as evaluated by normal Instrumental Activities of Daily Living (IADL) scale (Pantoni et al, 2005), no evidence for cognitive deterioration or cognitive complaints, no neurological or psychiatric condition likely to interfere with cognition and without familial history of dementia. Subjects with any systemic disease and/or taking psychoactive medications with possible impact on cognition, as well as chronic alcohol or drug abuse, were excluded.
For all patients and controls, a form was filled with personal an clinical data, namely clinical characterization of the disease (AD patients only), education, habits, other diseases and medication (all subjects).
Informed consent was obtained from each donor or caretaker before blood collection. The study was submitted and approved by the local ethics committee of Hospital de Santa Maria and Hospital Fernando Fonseca.
2.1.2. Sample collection and storage
All participants donated a blood sample (~20 ml), obtained by venipuncture in vacuum conditions. Three blood tubes were collected: a serum gel tube (for serum isolation), an EDTA tube (for DNA extraction) and a CPT tube [for plasma and peripheral blood mononuclear cells (PBMC) isolation]. Standard protocols were used for the processing of each sample.
Isolated serum was stored at - 80ºC (for Cp oxidase activity determination) and - 20ºC (for all the other biochemical/immunological parameters measure). Plasma was stored at -80ºC. The EDTA tube was stored at -20ºC until DNA extraction. The isolated PBMCs were ressuspended in RNA Protect Cell Reagent (Qiagen®) and stored at 4ºC until RNA extraction, which was performed with mirVanaTM miRNA Isolation Kit (Ambion®). RNA was stored at -80ºC.
2.1.3. Database and biological bank
Clinical information on diagnosis, including medical conditions, prescribed medication, cognitive performance and other relevant clinical information, as well as biochemical and genetic data, were gathered to establish a database.
Serum, plasma, DNA and RNA for biochemical, immunological, genetic and gene expression studies were stored in appropriate conditions, at Instituto Nacional de Saúde Dr. Ricardo Jorge and at Instituto Gulbenkian de Ciência, to create a biobank. This biobank was used only for research purposes and the database is anonymous and limited to researchers directly involved in the project.
2.2.
ASSESSMENT OFF
E/C
U METABOLISM ROLE IN THE PATHOLOGY OFAD
2.2.1.
Measurement of biochemical and immunological parameters
All the measurements were performed at Instituto Nacional de Saúde Dr. Ricardo Jorge, using standard protocols already implemented in this Institute. Serum iron (Fe) and transferrin (Tf) concentration were measured in a Cobas Integra 400® (Roche) by colorimetric and immunoturbidimetric assays, respectively. Transferrin saturation was calculated using the formula: Tf sat. = (([Fe](µg/dL)x0.8) / [Tf](mg/dL))x100. Serum ferritin (Ft) concentration was measured by immunochemoluminescence in an IMMULITE® automated analyser (Diagnostic Products Corporation). Serum ceruloplasmin (Cp) concentration was measured by immunonephelometry in a Beckman Array® 360 System. Serum ceruloplasmin oxidase activity was measured using a manual colorimetric assay, following a protocol adapted from Schosinsky et al, 1974.
2.2.2 Genotyping of variants on Fe/Cu related genes – CP, CYBRD1, HAMP,
HFE, IREB1, IREB2, SLC11A2, SLC40A1, TF, TFR2 – FB19, CALR and APOE
All the work related to genotypic analysis was developed at Instituto Gulbenkian de Ciência.
2.2.2.1 DNA Extraction
DNA from peripheral blood collected in the EDTA tube was extracted using Promega® DNA extraction kit. Extracted DNA was stored in Tris-EDTA buffer (pH 8.0) at 4ºC and quantified using Nanodrop ® 1000.
2.2.2.2. SNP selection for genotyping
Particular emphasis was placed on characterizing risk variants on the CP, CYBRD1,
HAMP, HFE, IREB1, IREB2, SLC11A2, SLC40A1, TF, TFR2 (Fe/Cu related genes), FB19, CALR (indirectly related with Fe/Cu metabolism) and APOE genes. The International
HapMap Project (www.hapmap.org) database was used to select the single nucleotide polymorphism (SNPs) for the genotyping experiments (for the Caucasian population) of these candidate genes. The selected SNPs were tested to find tag-SNPs using Tagger® in Haploview 4.1 ® (2003-2006 Broad Institute of MIT and Harvard). Tagger avoids overfitting by only constructing multi-marker tests from SNPs which are in strong LD with each other, as measured by a pairwise LOD score (default cut-off of 3.0). The SNPs tested in Tagger had minor allele frequencies above 0.1.
ENSEMBL (www.ensembl.org) and AlzGene (www.alzgene.org) databases were used to identify and select functional SNPs (lying in exons) and SNPs previously associated with AD disease, respectively.
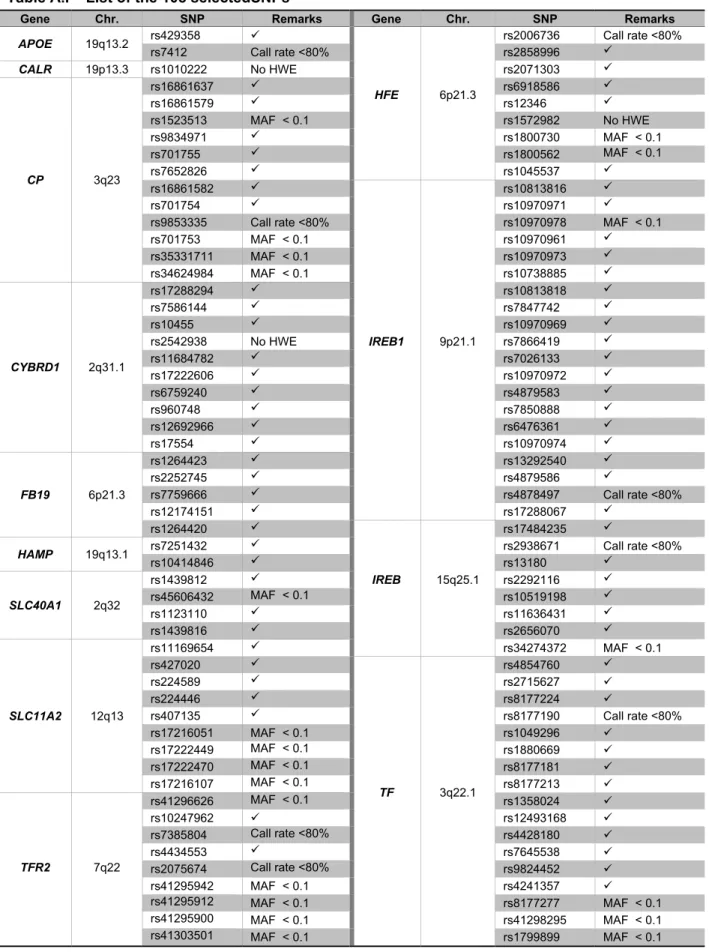
A total of 108 SNPs were selected: 1 for CALR gene; 12 for CP gene; 10 for CYBRD1 gene; 5 for FB19 gene; 2 for HAMP gene; 9 for HFE gene, 20 for IREB1 gene, 8 for IREB2 gene, 9 for SLC11A2 gene, 4 for SLC40A1 gene, 17 for TF gene and 9 for TFR2 gene. The remaining 2 SNPs lye in the APOE gene and distinguish the APOE ε2, ε3, ε4 alleles (see Attachment I, table A.I)
2.2.2.3. PCR primer design
MassARRAY® Assay Design 2.0 software (Sequenom®) was used to design both PCR and MassEXTEND® primers for multiplexed assays, up to 40 SNPs/Plex (iPLEX GoldTM method), of the Fe/Cu metabolism related genes described and APOE variants. Sequence information was obtained from the retrieval system ENTREZ
(www.ncbi.nlm.nih.gov). 4 plexes of 18, 26, 31 and 33 PCR primer pairs and MassEXTEND® primers were designed and ordered to Metabion®.
2.2.2.4. MALDI-TOF MassARRAY® genotyping procedure 2.2.2.4.1. Amplification reaction
The PCR amplification (5 μl total volume) contained 1.25× Sequenom® PCR buffer, 1.625 mM MgCl2, 500 μM dNTPs (Sequenom®), 0.5 U Sequenom® PCR Enzyme, 100 nM each forward and reverse primer, and 10 ng of genomic DNA. The PCR amplification was performed in 384-well plates using the following conditions: 94°C for 15 min and 45 cycles of 94°C for 20 s, 56°C for 30 s, 72°C for 1 min, followed by a final extension step of 72°C for 3 min.
2.2.2.4.2. Homogeneous MassEXTEND® (hME) reaction
The iPLEXTM assay used a single termination mix and universal reaction conditions for all SNPs (9 μl total volume) according to the Sequenom® protocol. The extended primer amplification was performed in 384-well plates using the following conditions: 94°C for 30 s; 40 cycles of: 94ºC for 5 seconds (1x), 52ºC for 5s + 80ºC for 5 s (5x); and a final extension step of 72°C for 3 min.
2.2.2.4.3. Genotype Calling and Results
The hME reaction products were transferred onto a SpectroCHIPTM using the MassARRAY® Nanodispenser robot. SpectroCHIPTM was read in the MassARRAY® reader MALDI-TOF mass spectrometer and the mass correlating genotype was determined in real time. Data were analyzed on the MassARRAY® Typer Analyzer 3.4 (Sequenom) software.
2.3.
S
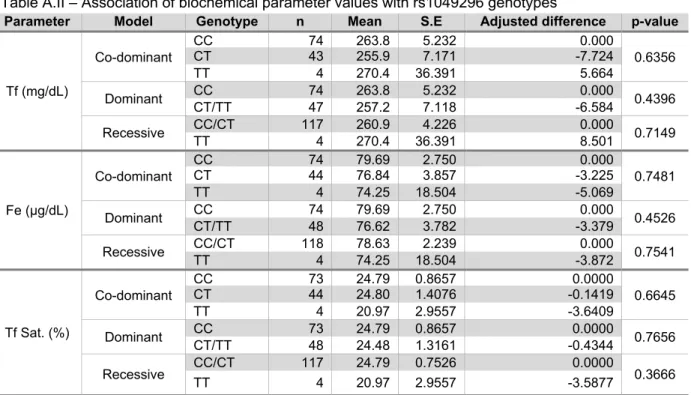
TATISTIC ANALYSISPASW Statistics 18.0® (SPSS Inc.) software was used for Mann-Whitney Rank Test, Spearman’ correlation, MANOVA and logistic regression analysis of biochemical/immunological parameters data. SNPassoc® package for R 2.8.1® (1999-2006 R Development Core Team) was used for logistic regression analysis of the genotyping data for association with AD, and for mean difference calculation (adjusted for gender) of biochemical/immunological parameters’ values between carriers of different genotypes for each associated SNP. p-values <0.05 were considered statistically significant.
3.
R
ESULTS
3.1
M
EASUREMENT OF BIOCHEMICAL AND IMMUNOLOGICAL PARAMETERSBiochemical and immunological markers of Fe/Cu metabolism (Fe, Tf, Ft and Cp concentration, Tf saturation and Cp oxidase activity) were measured in the serum of the 73 AD cases and 60 controls. Since it is well established that the normal ranges of these parameters are different between genders (e.g. serum [Fe] and [Ft] show higher levels in men than in women while [Cp] is higher in women, due to the estrogen levels (Johnson et al, 1994, Helmann et al, 2002)), analyses of the results obtained were performed separately for the two genders, after removal of outlier values. Tables I and II show the mean values of the parameters measured in cases and controls, and Figure 2 show a graphical representation of the dispersion of the values in the different groups studied.
Legend: Fe - Iron concentration; Tf - transferrin concentration; Tf Sat. - transferrin saturation; Ft - ferritin
concentration; Cp - ceruloplasmin concentration; Cp Ox. Act. - Ceruloplasmin oxidase activity
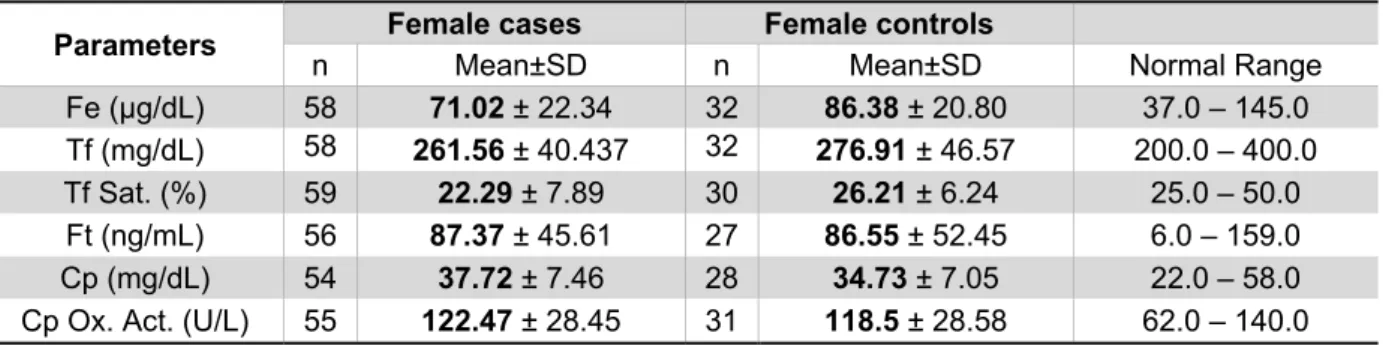
Table II - Means, standard deviation and normal range of each biochemical/immunological parameter
measured in serum from female AD cases and controls, after removal of outliers.
Parameters Female cases Female controls
n Mean±SD n Mean±SD Normal Range Fe (µg/dL) 58 71.02 ± 22.34 32 86.38 ± 20.80 37.0 – 145.0 Tf (mg/dL) 58 261.56 ± 40.437 32 276.91 ± 46.57 200.0 – 400.0 Tf Sat. (%) 59 22.29 ± 7.89 30 26.21 ± 6.24 25.0 – 50.0 Ft (ng/mL) 56 87.37 ± 45.61 27 86.55 ± 52.45 6.0 – 159.0 Cp (mg/dL) 54 37.72 ± 7.46 28 34.73 ± 7.05 22.0 – 58.0 Cp Ox. Act. (U/L) 55 122.47 ± 28.45 31 118.5 ± 28.58 62.0 – 140.0 Legend - Fe - Iron concentration; Tf - transferrin concentration; Tf Sat. - transferrin saturation; Ft - ferritin
concentration; Cp - ceruloplasmin concentration; Cp Ox. Act. - Ceruloplasmin oxidase activity.
Table I - Means, standard deviation and normal range of each biochemical/immunological parameter
measured in serum from male AD cases and controls, after removal of outliers.
Parameters Male cases Male controls
n Mean±SD n Mean±SD Normal Range Fe (µg/dL) 14 78.93 ± 26.49 27 89.70 ± 26.91 59.0 -158.0 Tf (mg/dL) 13 222.92 ± 33.07 28 259.08 ± 52.682 200.0 – 400.0 Tf Sat. (%) 14 27.54 ± 9.83 27 28.15 ± 8.03 25.0 – 50.0 Ft (ng/mL) 13 193.50 ± 118.56 27 188.73 ± 125.41 28.0 – 397.0 Cp (mg/dL) 13 31.33 ± 5.46 26 33.04 ± 8.59 22.0 – 58.0 Cp Ox. Act. (U/L) 13 91.71 ± 19.22 27 107.78 ± 22.79 62.0 – 140.0
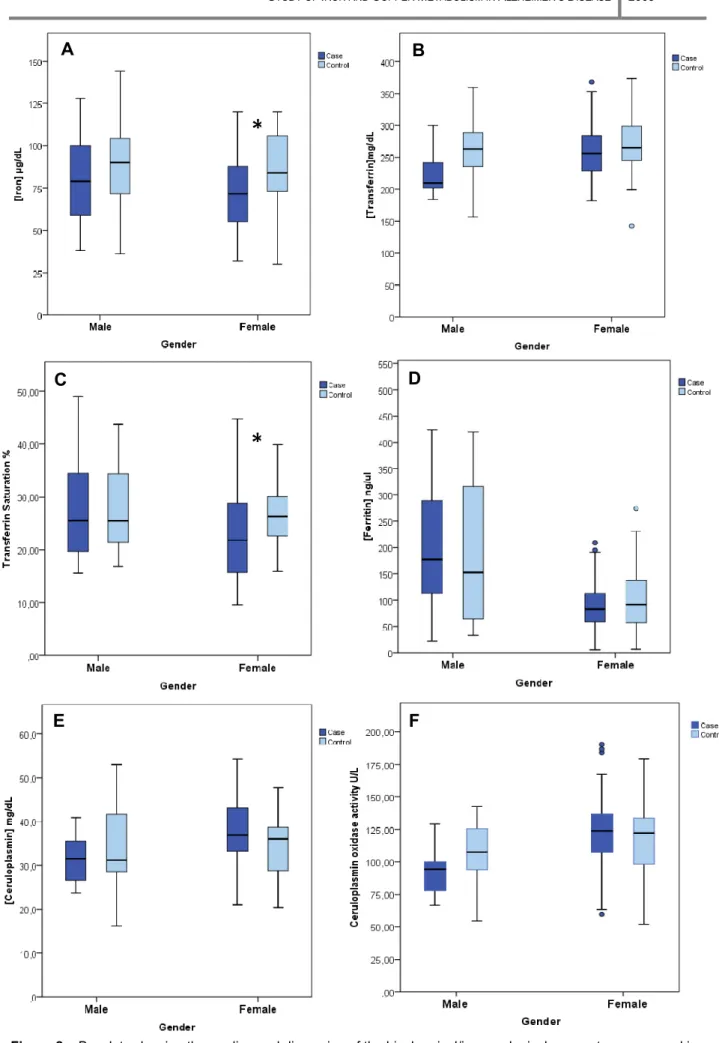
Figure 2 –Boxplots showing the median and dispersion of the biochemical/immunological parameters measured in AD patients (dark blue) and controls (light blue), after removal of outliers, organized by gender. A – [Iron] (µg/dL); B – [Transferrin] (mg/dL); C – Transferrin saturation (%); D – [Ferritin] (ng/mL); E – [Ceruloplasmin] (mg/dL); F –
B
E
C
A
D
F
*
*
The graphics point up the trends of the parameters measured in the serum of the different groups. In men, serum Fe (Fig.2A), Tf (Fig. 2B), Cp concentration (Fig. 2E) and Cp oxidase activity (Fig 2F) are diminished in AD cases compared with controls, while Ft concentration is elevated in AD patients. Tf saturation (Fig. 2C) shows no difference between cases and controls. On the other hand, in women serum Fe (Fig.2A), Tf (Fig.2B) and Tf saturation (Fig.2C) are diminished in AD cases in comparison with controls while Cp concentration (Fig.2E) and its oxidase activity (Fig.2F) are elevated in AD patients. Ft concentration (Fig.2D) showed no difference between cases and controls. Nevertheless, for study purposes it is necessary to test if the differences observed between AD patients and controls in each gender are statistically significant. In the following analysis we will take into account the reduced number of males in this sample. Thus, we will focus mainly on the results obtained for the female sample and check whether the male sample follows the same trend.
It is also widely known that age is a factor that influences the levels of the parameters under study (Johnson et al, 1994). Therefore, we tested the significance of the mean age difference in each group (cases and controls, for each gender). Furthermore, if statistically different we verified its influence in the differences observed in the biochemical/immunological parameters evaluated. Mann-Whitney Rank Test was applied for comparison of means (male and female cases’ age had a distribution significantly different from normal, checked by Shapiro-Wilk Test, with p-values 0.038 of and 0.030, respectively) and its results show that the mean age is not significantly different between male cases and controls value 0.276), but that female cases are significantly older than female controls (p-value <0.0001). Then, a Spearman’s correlation Test was performed to check if this difference in age is enough to cause differences in the values of the biochemical/immunological parameters measured. The results obtained (Table III) show that the range of ages in the female sample is not correlated with the values of the parameters, and consequently there’s no need to take the factor “age” into account in the subsequent analysis. Although a correlation of Tf values with age was observed for men, AD patients and controls have similar mean ages, so if any difference found between the two samples will not be due to age difference.
Table III – Spearman correlation analysis of the biochemical/immunological parameters measured with
age, in each gender.
Parameters
AGE
Male Female
Spearman's ρ Significance (2-tailed) Spearman's ρ Significance (2-tailed)
[Fe] (µg/dL) -0.245 0.123 (NS) -0.081 0.453 (NS) [Tf] (mg/dL) -0.365 0.019 (S) -0.140 0.196 (NS) Tf Sat.(%) -0.049 0.762 (NS) -0.065 0.549 (NS) [Ft] (ng/µl) -0.112 0.491 (NS) 0.128 0.257 (NS) [Cp] (mg/dL) -0.115 0.487 (NS) -0.046 0.686 (NS) Cp Ox Act. (U/L) -0.024 0.885 (NS) 0.044 0.690 (NS)
Legend: Fe - Iron concentration; Tf - transferrin concentration; Tf Sat. - Transferrin Saturation; Ft - ferritin
concentration; Cp - ceruloplasmin concentration; Cp Ox. Act. - Ceruloplasmin oxidase activity. S – significant; NS – non-significant.
In this study, several parameters were measured in the same individuals. Thus, a multivariate analysis of variance (MANOVA) was performed. This analysis requests a normal distribution and homogeneity of variances of the dependent variables (the biochemical/immunological parameters). A Shapiro-Wilk test was applied and [Ft] (ng/µl) in male controls was the only variable with a distribution significantly different from normal (p-value 0.024). In this case, data obtained for this variable was logarithmized (base e) in order to get a normal distribution. The variances between groups were homogeneous (checked by Levene’s Test - all p-values >0.05).
MANOVA was applied separately in males and females, comparing the means of the results obtained from the measurement of the different biochemical/immunological parameters. The analysis’ data is presented in Table IV which includes the p-values of the overall multivariate Test (the most relevant) and for each variable (the mean value for each parameter measured in each group is shown in Tables I and II).
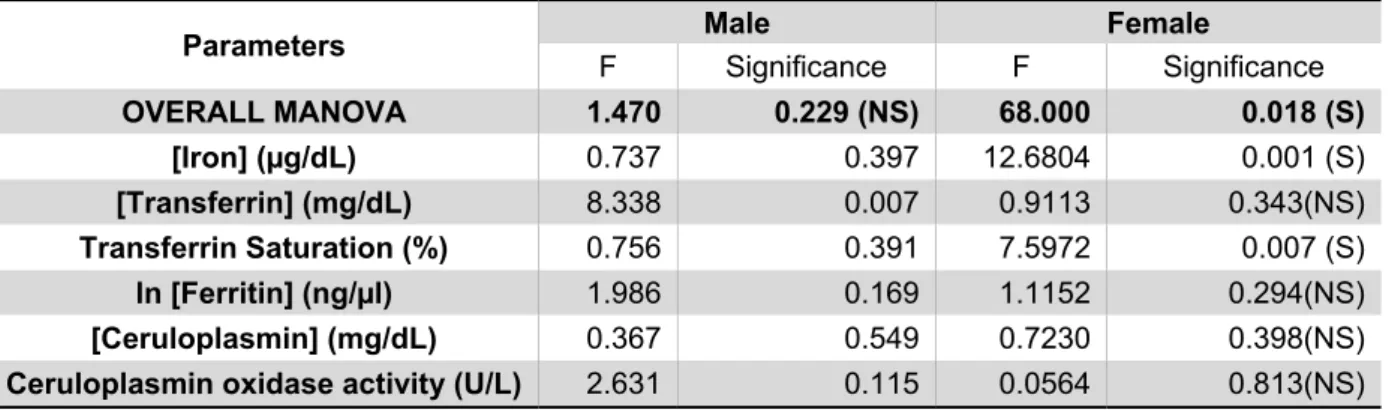
Table IV - Multivariate analysis of variance of the biochemical/immunological parameters between AD patients and controls.
Parameters Male Female
F Significance F Significance OVERALL MANOVA 1.470 0.229 (NS) 68.000 0.018 (S) [Iron] (µg/dL) 0.737 0.397 12.6804 0.001 (S) [Transferrin] (mg/dL) 8.338 0.007 0.9113 0.343(NS) Transferrin Saturation (%) 0.756 0.391 7.5972 0.007 (S) ln [Ferritin] (ng/µl) 1.986 0.169 1.1152 0.294(NS) [Ceruloplasmin] (mg/dL) 0.367 0.549 0.7230 0.398(NS)
Ceruloplasmin oxidase activity (U/L) 2.631 0.115 0.0564 0.813(NS) Legend:. ln[Ferritin] - Ferritin concentration values were logaritmized before the test. S – significant; NS –
non-significant.
As shown in Table IV, the overall MANOVA is not significant for males, indicating that the individual significant result for Tf (p-value 0.007) is not valid (it is a Type I error – rejects the null hypothesis of no significant differences between the two groups when it is true). On the other hand, for females the overall MANOVA has a significant p-value (0.018). This significance is mostly due to the difference between mean levels of serum Fe concentration measured in the two groups. Furthermore, it seems that this significant difference in Fe levels must be forcing the appearance of a significant Tf saturation (because it is calculated from Fe and Tf concentrations, see Materials and Methods). Noteworthy, the differences in Fe levels measured in serum from males, although not significantly different in AD cases and controls, followed the same trend (Table I and Fig. 2A).
The described statistical analyses enable us to discriminate which parameters are significantly different between the two groups under study. However, to further evaluate the contribution of these parameters for the distinction between the group of AD patients and the group of controls, we performed a logistic regression analysis by the method of stepwise backward. Two models were built (one for females and another for males), starting with all the six biochemical/immunological variables and age (age is a risk factor for AD (Lindsay et
al, 2002) and, since it is not balanced in our sample, it should be taken into account).
The software used (PASW Statistics 18.0 – SPSS Inc.) evaluated the adjusment of the model for the data, removing the less significant variables in a hierarchically way and evaluating the fitting of the model in each removal step. The simplest and best fitted models for each gender are presented in Table V (men) and VI (women).
Legend – B – coefficient for each variable in the model. S.E. – standard error for B coefficient. df – degrees of
freedom. Wald – Wald statistic for testing whether the B coefficient is significantly different from zero. Sig. – p-value for the Wald statistic.. Exp(B) – change in odds caused by the variation of 1 unit of the predictive variable. 95% C.I. for EXP(B) – 95% confidence interval for Exp(B). R2 - Nagelkerke’s R2 (model adjustment to data)
Final model: log [p/(1-p)]= 5.370 – 0.025x[Tf] [Equation 3.1]
p/(1-p) = Odds Ratio (OR) for AD
As seen in Table V, the obtained model for men shows that the only variable that has some predictive value of the difference observed between male AD patients and controls is serum Tf concentration. According to this model, the odds of being a male AD patient increases as serum Tf concentration decreases (because it has a negative B coefficient and
Table V - Final logistic regression model for men.
Step Variable B S.E. Wald df Sig. Exp(B) 95% C.I.for EXP(B) R2
Lower Upper
Step 7 (final) [Tf] -0.025 0.010 5.823 1 0.016 0.976 0.956 0.995 0.258 Constant 5.370 2.428 4.891 1 0.027 214.809
Exp(B)<1). However, we have seen that the MANOVA analysis (Table IV) did not consider the difference between serum Tf concentrations of AD patients and controls as significant (if we take into account that the overall MANOVA was non-significant for men). The Nagelkerke’s R2, which is calculated from the log-likelihood value of the model and can vary from 0-1, evaluates the adjustment of the model to the data; as seen, this model has a poor adjustment (R2 = 0.258). In fact, as mentioned above, the number of males in this sample is so small that makes the analysis very difficult and decreases the reliability of the results.
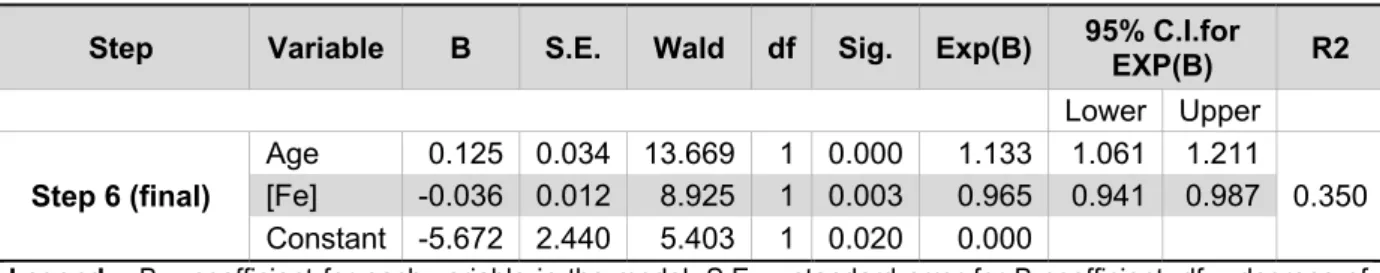
Table VI - Final logistic regression model for women.
Step Variable B S.E. Wald df Sig. Exp(B) 95% C.I.for EXP(B) R2
Lower Upper Step 6 (final) Age 0.125 0.034 13.669 1 0.000 1.133 1.061 1.211 0.350 [Fe] -0.036 0.012 8.925 1 0.003 0.965 0.941 0.987 Constant -5.672 2.440 5.403 1 0.020 0.000
Legend – B – coefficient for each variable in the model. S.E. – standard error for B coefficient. df – degrees of
freedom. Wald – Wald statistic for testing whether the B coefficient is significantly different from zero. Sig. – p-value for the Wald statistic. Exp(B) – change in odds caused by the variation of 1 unit of the predictive variable. 95% C.I. for EXP(B) – 95% confidence interval for Exp(B). R2 - Nagelkerke’s R2 (model adjustment to data)
Final model: log [p/(1-p)] = - 8.648 + 0.143xAge – 0.036x[Fe] [Equation 3.2] Age and serum Fe concentration are the only variables with some predictive value of the difference between female AD patients and controls in our sample. Since age is not balanced in our sample, it is plausible that this factor is contributing to differentiate the two groups. Nevertheless, the difference between serum Fe concentrations in the two groups is important enough to figure in the model. Furthermore, it strengthens MANOVA (Table IV) results. Although serum Tf saturation appeared as significant in the MANOVA results, here it does not integrate the model. It is reasonable to assume that this variable will not increase the model’s goodness of fit due to its direct correlation with Fe. The Nagelkerke’s R2, although still low (R2 = 0.350), shows a better adjustment of this model to the corresponding experimental data than the men’s model. As for Tf concentration in women we can see that the same trend of lower values obtained in AD men patients is followed but it is non-significant both in MANOVA and in the logistic regression. In summary, the model obtained shows that the odds of being a female AD patient increases as age increases and serum Fe concentration decreases.
3.2. GENOTYPING RESULTS
Our sample of 73 AD patients and 60 controls was genotyped for the 108 selected SNPs. After excluding the SNPs with call rates (percentage of individuals genotyped) inferior to 80% (8 SNPs, see Attachment I: Table A.I), the average call rate was 97.5% (range 90.6% to 100%). SNPs with minor allele frequencies (MAF) less than 0.1 were excluded from analysis (see Attachment I: Table A.I). Genotyping errors were checked using the Hardy-Weinberg equilibrium (HWE) test in the controls sample, identifying 3 SNPs that were not in HWE (see Attachment I: Table A.I).
From the two SNPs that distinguish the 3 alleles of APOE, rs7412 (distinguishes
APOEε2 and APOEε3) and rs429358 (APOEε4) (Ballerini et al, 2002, www.alzgene.org), the
first one could not be genotyped (call rate = 0%) and the second one had a call rate of 60.2%. Fortunately, rs429358 is enough to distinguish APOEε4 from the other two alleles (but not APOEε2 from APOEε3) and was used in the analysis.
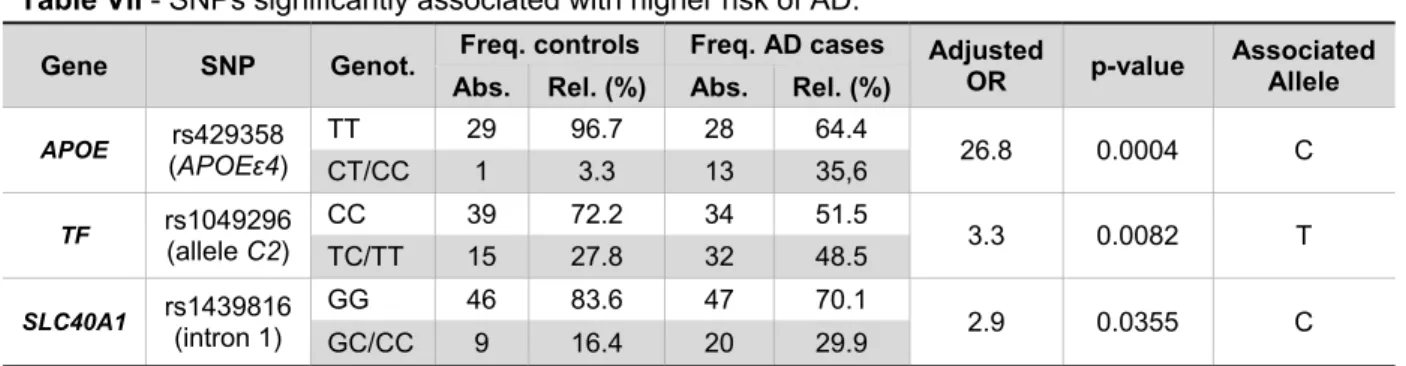
In the end, a total of 76 SNPs were included in the analysis (see Attachment I: Table A.I). Each SNP was submitted to a logistic regression analysis adjusted for age and gender using the package SNPassoc® from R 2.8.1 ® (1999-2006 R Development Core Team). Three genetic models were tested in respect to the probably associated allele: co-dominant (each of the three genotypes - homozygous for one allele, homozygous for the other allele and heterozygous - may have a different effect phenotype with respect to the disease state), dominant (the allele associated with the disease is the dominant one) and recessive (the allele associated with the disease is the recessive one). Table VII presents the SNPs that were found to be significantly associated to AD (the likelihood ratio test for the model containing each of these SNPs considered it significantly different from the null model).
Table VII - SNPs significantly associated with higher risk of AD.
Gene SNP Genot. Freq. controls Freq. AD cases Adjusted OR p-value Associated Allele Abs. Rel. (%) Abs. Rel. (%)
APOE rs429358 (APOEε4) TT 29 96.7 28 64.4 26.8 0.0004 C CT/CC 1 3.3 13 35,6 TF rs1049296 (allele C2) CC 39 72.2 34 51.5 3.3 0.0082 T TC/TT 15 27.8 32 48.5 SLC40A1 rs1439816 (intron 1) GG 46 83.6 47 70.1 2.9 0.0355 C GC/CC 9 16.4 20 29.9
Legend: SNPs significantly associated with higher risk of AD. SLC40A1 – gene for ferroportin; TF – gene for
transferrin; APOE – gene for apolipoprotein E; Genot. – genotype; Freq. – frequency; Abs. – absolute; Rel. – relative; OR – odds ratio.