Supervisor: Dr. Nuno Moreno, Instituto Gulbenkian Ciência
Co-Supervisor: Dr. Rui Igreja, Assistant Professor, Faculdade de Ciências e Tecnologia, Universidade Nova de Lisboa
Luís Manuel Farinha Bernardino de Oliveira
[Nome completo do autor]
[Nome completo do autor]
[Nome completo do autor]
[Nome completo do autor]
[Nome completo do autor]
[Nome completo do autor]
[Nome completo do autor]
Bachelor degree in Science of Micro and Nanotechnologies Engineering
[Habilitações Académicas] [Habilitações Académicas] [Habilitações Académicas] [Habilitações Académicas] [Habilitações Académicas] [Habilitações Académicas] [Habilitações Académicas]
Quantitative nanoscopy of endosomal F-actin:
Impact of an Alzheimer’s risk factor
[Título da Tese]
Orientador: [Nome do orientador], [Cargo], [Instituição] Co-orientadores: [Nome do co-orientador 1], [Cargo], [Instituição]
[Nome do co-orientador 2], [Cargo], [Instituição]
[Título da Tese]
[Título da Tese]
Dissertation submitted
for the attainment of the Master degree
in
Micro and Nanotechnologies Engineering
Dissertação para obtenção do Grau de Mestre em [Engenharia Informática]
Dissertação para obtenção do Grau de Mestre em [Engenharia Informática]
Dissertação para obtenção do Grau de Mestre em [Engenharia Informática]
Examination Committee
President: Dr. Rodrigo Ferrão de Paiva Martins, Full Professor, Materials Science Department, FCT-UNL
Examiner: Dr. José Ricardo Ramos Franco Tavares, Assistant Professor, Department of Chemistry, FCT-UNL
Supervisor: Dr. Nuno Moreno, Instituto Gulbenkian Ciência
Quantitative nanoscopy of endosomal F-actin: Impact of an Alzheimer’s risk factor
Copyright © Luís Manuel Farinha Bernardino de Oliveira, Faculty of Sciences and Tehnology, NOVA University of Lisbon.
The Faculty of Sciences and Technology and the NOVA University of Lisbon have the right, perpetual and without geographical boundaries, to file and publish this dissertation through printed copies reproduced on paper or on digital form, or by any other means known or that may be invented, and to disseminate through scientific repositories and admit its copying and distribution for non-commercial, educational or research purposes, as long as credit is given to the author and editor.
“If we knew what it was we were doing, it would not be called research, would it?” Albert Einstein
vii
Acknowledgements
É com enorme orgulho que finalmente, depois de tudo o resto, começo a escrever esta secção. A conclusão da minha tese de mestrado simboliza não só o final de uma etapa académica que culmina na obtenção do grau de mestre em Engenharia de Micro e Nanotecnologias mas também o final de uma etapa pessoal que me ajudou a crescer. Durante este percurso que se estendeu durante praticamente um ano existem inúmeras pessoas sem as quais esta etapa não teria sido tão marcante como foi.
Quero começar por agradecer ao professor Rodrigo Martins e à professora Elvira Fortunato pela criação e desenvolvimento constante do curso de Engenharia de Micro e Nanotecnologias que me proporcionou 5 anos de desafios aos quais respondi com o melhor que consegui. Tive contacto com tecnologia, equipamentos e profissionais state of the art que estimularam o meu interesse pela ciência e me motivaram a querer sempre alcançar mais.
Ao professor Rui Igreja por ter sido um importante elo de ligação entre o Instituto Gulbenkian Ciência (IGC) e a FCT e ter tornado possível a existência desta tese.
Em seguida quero agradecer ao meu orientador, Doutor Nuno Moreno. Enfim, para o Nuno eu sei que bastaria um obrigado e um bom passou bem porque provavelmente tem imensa coisa para fazer e todo o tempo é pouco. No entanto, não posso deixar de expor a importância que o Nuno Moreno teve durante este percurso e para a realização deste trabalho. Sem o Nuno eu não teria tido a oportunidade de ingressar IGC onde realizei grande parte do meu trabalho e onde todos os recursos foram postos à minha disposição. Para além disso foi a postura do Nuno como orientador que me fez perguntar, pesquisar e pensar sobre o meu trabalho e responder às perguntas que tive. Não só pelos brainstorms sobre os mais diversos temas mas também pelo profissional que é o Nuno e pela energia e genica que emana. Por isso Nuno um muito muito obrigado. Quero também agradecer ao Gabriel por me ter deixado fazer parte e ter sentido tão à vontade na Unidade de Imagiologia e Citometria do IGC durante todo o tempo em que estive a desenvolver este trabalho.
Da mesma maneira quero agradecer à minha co-orientadora, Doutora Cláudia Almeida, que me abriu as portas do seu laboratório, Neuronal Trafficking in Ageing, no CEDOC (Centro de Estudos de Doenças Crónicas) onde realizei tanto trabalho como no IGC. Sem a disposição da Cláudia para me receber nada disto teria sido possível. Mas ainda mais que isso foi o tempo e a grande paciência que teve comigo a explicar-me ou a pôr-me no caminho certo nas minhas grandes divagações e o acompanhamento de perto do meu trabalho que sei que não foi fácil por causa das inúmeras tarefas, compromissos e prazos que tens todos os dias. Para além disso, foi no mínimo estimulante todas as conversas que tivemos acerca das possibilidades e de tudo aquilo que podemos fazer neste laboratório. Quero-te agradecer por tudo isto e por todos os recursos que puseste à minha disposição que tornaram tudo isto possível.
Sinto-me no mínimo privilegiado por ter tido a oportunidade de trabalhar nestas duas instituições. Em ambas aprendi tanta coisa e conheci tantas pessoas que são ao mesmo tempo grandes profissionais mas também grandes companheiros. Não posso deixar de agradecer ao Nuno Pimpão pela enorme ajuda que me deu no IGC nas mais diversas ocasiões (enumerá-las ocuparia espaço que não que não tenho aqui), pelas conversas e esclarecimentos que tivemos naqueles finais de dia. À Tatiana pela enorme e incrível ajuda que me deu durante este tempo todo e sem a qual este trabalho simplesmente não tinha
viii
acontecido, pelas boas conversas, pela paciência gigante e por todos os bons momentos durante esta etapa stressante. Ao Hugo Pereira que é um excelente companheiro de sala com quem tive muitas risadas mas também feedback. To Swadhin that allowed me to participate in his project in which I felt honored to be for a few months for the challenges it imposes to everyone involved. À Ana Vinagre que esteve comigo nas sessões de dSTORM mais engraçadas e que me mostrou o que é trabalhar bem, com ritmo e a superar desafios à partida impossíveis (selar coverslips pequenas e ainda conseguir levar ao dSTORM WHAT?!). A lista contínua e inclui o Tiago Vale, Inês Vale, o Pedro Alves, a Inês Cabral, a Marta Monteiro, a Mariana Fernandes, a Catarina Perdigão, a Farzaneh Mirfakhar, o Luís Marcelo. Todos estiveram presentes de diversas formas ao longo deste percurso.
Aos meus grandes amigos e companheiros de curso Viorel, Alexandre, Tiago, Coroa, Crespo, Inês, Ana Beaumont, Daniela, David, Marco, João Luís, Shiv, Alexandra, Emma, Cátia, Vasco com os quais passei experiências para a vida e que me acompanharam ao longo destes 5 anos na FCT.
A todos os meus amigos para além da faculdade que me ajudaram a espairecer e a esquecer a tese durante tantos e diversos programas. Sem isso seria muito difícil manter a motivação e a energia para continuar este projecto.
Por fim, uma grande palavra de carinho aos meus pais e ao meu irmão que durante este tempo sempre se mostraram interessados naquilo que estava a fazer, me viram a stressar bastante, me acalmaram mas também por me darem aquele impulso final quando diziam “Já não devias ter acabado isso?”.
A vida é feita pelos nossos alcances mas também pelas pessoas que nos rodeiam.
ix
Abstract
dSTORM is a super resolution technique capable of breaking the diffraction limit present in conventional light microscopy. As a molecular imaging technique it gives access to a new kind of data that other super resolution techniques cannot. Some relevant findings were a) identification of nuclear pore proteins symmetry, b) protein distribution inside clusters at the plasma membrane c) organization between proteins in axons. Alzheimer’s disease is the most frequent dementia and one of the biggest problems in our aged society. Genomic studies identified variants in the gene CD2AP associated with the disease. Recent studies showed that CD2AP silencing traps the amyloid precursor protein in early endosomes, increasing the production of beta-amyloid: the Alzheimer’s disease hallmark toxic protein. It is unclear, however, the link of CD2AP as actin cytoskeleton regulator and therefore the link of F-actin on the CD2AP dependent beta-amyloid production. Preliminary results using conventional light microscopy showed less perinuclear F-actin puncta upon CD2AP silencing. We aimed to merge cell biology and super-resolution microscopy to study F-actin patterns with nanometric precision in the perinuclear region and their relationship with endosomes. By accessing individual molecules, their location and by implementing quantification analysis we found F-actin more proximal to early endosomes than late endosomes, suggesting an early role for F-F-actin during endosomal sorting and maturation. Importantly, CD2AP silencing and overexpression of wild-type and of an Alzheimer’s mutant form, altered the quantity of F-actin in the perinuclear region, its clustering ability and association with early endosomes. Our results indicate that F-actin regulation has a role in the CD2AP-dependent mechanism of beta-amyloid production in early endosomes, thus contributing to the development of Alzheimer’s disease.
xi
Resumo
dSTORM é uma técnica de super resolução que permite ultrapassar o limite imposto pela difração da luz presente em microscopia óptica convencional. Como técnica de microscopia molecular fornece novos tipos de informação que outras técnicas da super resolução não fornecem. Entre algumas descobertas relevantes tem-se: a) identificação de simetrias em proteínas do poro nuclear, b) distribuição de proteínas em aglomerados na membrana celular, c) organização entre proteínas em axónios. Alzheimer é o caso de demência mais frequente e um dos maiores problemas da nossa sociedade envelhecida. Estudos genómicos identificaram variantes no gene CD2AP associadas com a doença. Estudos recentes mostraram que ao remover CD2AP, um conhecido regulador de actina, a proteína percursora de amiloide beta é retida na membrana de endossomas precoces, aumentando a produção de beta amiloide, a proteína distinta da doença de Alzheimer. No entanto é pouco claro se a actina tem um papel na produção de beta-amiloide dependente de CD2AP. Resultados preliminares baseados em microscopia óptica convencional mostram menos quantidades de actina filamentosa na zona adjacente ao núcleo, na ausência de CD2AP. O nosso objectivo foi juntar a biologia celular com microscopia de super resolução para estudar os padrões de actina na região adjacente ao núcleo com precisão nanométrica e a sua relação com os endossomas. Acedendo a cada molécula, à sua localização e implementando análises de quantificação, acabámos por observar que a actina filamentosa presente nesta região tem uma maior proximidade com os endossomas precoces comparando com endossomas tardios, sugerindo um papel primário durante a maturação e distribuição da carga dos endossomas. Ao remover e ao sobre expressar uma forma normal e uma forma mutante de CD2AP também foi observada uma alteração na quantidade de actina filamentosa nesta região, bem como na sua capacidade de agregação e na relação com os endossomas precoces. Em suma, os nossos resultados indicam que a regulação de actina está implicada nos mecanismos de produção de beta amiloide nos endossomas precoces, que podem contribuir para o desenvolvimento de Alzheimer.
xiii
Table of Contents
Acknowledgements _________________________________________________________ vii
Abstract ___________________________________________________________________ ix
Resumo ___________________________________________________________________ xi
List of Figures ______________________________________________________________ xv
List of Tables _____________________________________________________________ xvii
Abbreviations and Symbols _________________________________________________ xix
1.
Introduction ____________________________________________________________ 1
Contextualization and Pathophysiology of Alzheimer’s Disease _________________________ 1 CD2AP and Intracellular Trafficking _______________________________________________ 1 F-Actin and Intracellular Trafficking _______________________________________________ 2 F-Actin, CD2AP and Aβ ________________________________________________________ 3 Super Resolution Microscopy and dSTORM ________________________________________ 4
Materials and Methods ____________________________________________________ 7
Cell Culture __________________________________________________________________ 7 DNA Transfection _____________________________________________________________ 7 siRNA Transfection ____________________________________________________________ 7 Immunofluorescence ___________________________________________________________ 7 Imaging Medium Preparation ____________________________________________________ 8 Image Acquisition and Analysis __________________________________________________ 8
Results and Discussion ___________________________________________________ 9
dSTORM vs Conventional Fluorescence Microscopy _________________________________ 9 dSTORM, Single Molecule Detection and Quantitative SMLM _________________________ 11
3.2.1 Detection Protocol ________________________________________________________________ 12 3.2.2 Population optimization ____________________________________________________________ 13 3.2.3 dSTORM Phalloidin Labeling ________________________________________________________ 16
F-Actin Correlation with Early/Late Endosomes _____________________________________ 16 F-Actin Patterns and CD2AP ___________________________________________________ 20 F-Actin and CD2AP Mutant _____________________________________________________ 25
Conclusion and Future Trends _____________________________________________ 31
Bibliography _______________________________________________________________ 31
Appendix A:
Reagents, Antibodies and Solutions ______________________________ 37
PFA/PEM solution _________________________________________________________________ 37 Imaging Buffer intermediate solutions __________________________________________________ 37
xiv
Endosomal and Actin ROIs __________________________________________________________ 39 Endosomes ______________________________________________________________________ 39
Appendix C:
DBSCAN Working Principle and Parameter Determination ____________ 43
Appendix D:
Source Code __________________________________________________ 45
F-Actin Pattern Analysis _____________________________________________________________ 45
Data Introduction _________________________________________________________________________ 46 Pattern Analysis __________________________________________________________________________ 47
Number of Detections ___________________________________________________________________ 47 Nearest Neighbor (NN) __________________________________________________________________ 47 Endosomal F-actin ______________________________________________________________________ 47 Measuring Cluster Parameters ____________________________________________________________ 49 Cluster Colocalization with Endosomes ______________________________________________________ 49
xv
List of Figures
Figure 1.1 - Schematic of CD2AP protein. _________________________________________________ 1 Figure 1.2 - Actin treadmilling scheme and associated Actin Binding Proteins (ABPs) _______________ 2 Figure 1.3 - Model for the role of CD2AP in Aβ endocytic generation in neuronal cells _______________ 4 Figure 1.4 - Conventional resolution limits and SMLM dSTORM protocol _________________________ 4 Figure 3.1 - Comparison between conventional epifluorescence microscopy and dSTORM ___________ 9 Figure 3.2 - dSTORM enables sub diffraction limit imaging and higher resolution __________________ 11 Figure 3.3 - Detection protocol in dSTORM experiments _____________________________________ 12 Figure 3.4 - Population culling based on the standard deviations (σ) of the fitted PSF model _________ 14 Figure 3.5 - Localization uncertainty and merging same molecules appearing on consecutive frames __ 15 Figure 3.6 - Early endosomes are more present in the perinuclear region than late endosomes ______ 17 Figure 3.7 - Distance between F-actin detections and endosomes _____________________________ 18 Figure 3.8 – Quantification of F-actin detections per endosome________________________________ 19 Figure 3.9 – F-actin clusters exhibit more colocalization with early endosomes than with late endosomes
______________________________________________________________________________ 20 Figure 3.10 - CD2AP influences F-actin quantities and organization in the perinuclear region ________ 21 Figure 3.11 - Absence of CD2AP reduces endosomal F-Actin _________________________________ 22 Figure 3.12 - Effect of the absence of CD2AP in absolute counts of F-actin detections per endosome _ 23 Figure 3.13 - dSTORM super resolution images reveal organization of diffraction limited F-actin puncta 23 Figure 3.14 – Cluster Analysis in CD2AP KD cells __________________________________________ 24 Figure 3.15 - F-Actin exhibits limited clustering assembly and a decrease in cluster colocalization with
early endosomes without CD2AP ___________________________________________________ 25 Figure 3.16 - Perinuclear F-Actin is altered in when overexpressing Wild Type and Mutant CD2AP ___ 26 Figure 3.17 - Endosomal F-Actin is similar when comparing overexpression of Wild Type and Mutant
CD2AP ________________________________________________________________________ 27 Figure 3.18 - Cluster analysis overexpressing Wild Type and Mutant CD2AP _____________________ 28 Figure 3.19 - Wild Type and Mutant CD2AP overexpression affect cluster assembly and its colocalization
with early endosomes ____________________________________________________________ 29 Figure B.1 - Endosomal segmentation protocol ____________________________________________ 39 Figure C.1 - K parameter determination __________________________________________________ 43 Figure C.2 - DBSCAN input parameters determination protocol ________________________________ 44 Figure D.1 - Data Introduction __________________________________________________________ 46 Figure D.2 – Number of Detections ______________________________________________________ 47 Figure D.3 - Nearest Neighbor _________________________________________________________ 47 Figure D.4 - Endosome identification ____________________________________________________ 48 Figure D.5 - Endosomal F-actin ________________________________________________________ 48 Figure D.6 - Cluster Parameters ________________________________________________________ 49 Figure D.7 - Colocalization with Early Endosomes __________________________________________ 50
xvii
List of Tables
Table A.1 - Imaging Medium Reagents. __________________________________________________ 37 Table A.2 - Antibodies and probes. ______________________________________________________ 38 Table E.1 - Summary of the results for CD2AP KD cells (Section 3.4) ___________________________ 51 Table E.2 - Summary of the results for Wild Type and Mutant CD2AP (Section 3.5) ________________ 51
xix
Abbreviations and Symbols
βCTF β Carboxyl Terminal Fragments
Da Dalton
µm micrometer
µl microliter
mM mili-Molar
nm Nanometer
Aβ Amyloid Beta
ABP Actin Binding Protein AD Alzheimer’s disease ADP Adenosine Diphosphate APOE Apolipoprotein E
Arp 2/3 Actin-related proteins 2/3 APP Amyloid Precursor Protein ATP Adenosine Triphosphate
BACE1 Beta-site APP Cleavage Enzyme 1 CD2AP CD2-associated protein
CHO Chinese Hamster Ovary
CP Capping Protein
DBSCAN Density-Based Spatial Clustering of Applications with Noise DNA Deoxyribonucleic acid
dSTORM direct-Stochastic Optical Reconstruction Microscopy EEA1 Early Endosome Antigen 1
EGF Epidermal Growth Factor
EMCCD Electron Multiplying Charge-Coupled Device EOAD Early-onset Alzheimer’s disease
ER Endoplasmatic Reticulum
ESCRT Endosomal Sorting Complexes Required for Transport F-actin Filamentous-actin
FOV Field of View G-actin Globular Actin
GFP Green Fluorescent Protein GWAS Genome Wide Association Study
Hrs Hepatocyte growth factor-regulated tyrosine kinase substrate ILV Intra luminal Vesicles
LAMP1 Lysosomal-associated membrane protein 1 LOAD Late-onset Alzheimer’s disease
MVB Multi-Vesicular Bodies NFT Neurofibrillary tangles
xx NPF Nucleation Promotion Factor
N-WASP Neural Wiskott - Aldrich syndrome Protein PDGF Platelet Derived Growth Factor
PM Plasma Membrane
PSEN1 Presenilin 1 PSEN2 Presenilin 2
PSF Point Spread Function ROI Region of Interest
sAPPα Amyloid Precursor Protein (soluble α-cleaved fragment) sCMOS Scientific Complementary Metal Oxide Semiconductor SH3 Src Homology 3 domain
SMLM Single Molecule Localization Microscopy SNP Single Nucleotide Polymorphism
SNR Signal to Noise Ratio
Quantitative nanoscopy of endosomal F-actin: Impact of an Alzheimer’s risk factor
1
1. Introduction
Contextualization and Pathophysiology of Alzheimer’s Disease
Alzheimer’s disease (AD) is one of the most common neurodegenerative disorders responsible for 60 % to 80 % of dementia cases. The hallmarks of the disease are the accumulation of amyloid-β (Aβ) plaques, originating from the Amyloid precursor protein (APP), outside the neurons and of hyperphosphorylated tau neurofibrillary tangles (NFT’s) inside neurons both ending in damage and eventual death of neurons 1,2. There are two forms of the disease: Early-Onset Alzheimer’s Disease (EOAD) and
Late-Onset Alzheimer’s Disease (LOAD). EOAD happens in people under 65 years-old and is only responsible for 1 % to 6 % of the cases and it is potentiated by mutations in three genes involved in the generation of Aβ: APP, Presenilin 1 (PSEN1) and Presenilin 2 (PSEN2). LOAD, the most common, happens after 65 years old. Here the major risk factors are: environmental, ageing and the inheritance of the E4 polymorphism in APOE gene 1,3,4. The APOE-E4 is the most significant genetic risk factor and was replicated
in multiple DNA sequences from across the human genome to identify common gene alterations in AD (Genome Wide-Association Study - GWAS) 5–7. Meta-analysis of several GWAS ranked these genes and
CD2AP is among the top ten risk factors for AD, a gene involved in endocytosis and regulation of the actin cytoskeleton, both critical for the normal processing cascade of APP 8–10.
CD2AP and Intracellular Trafficking
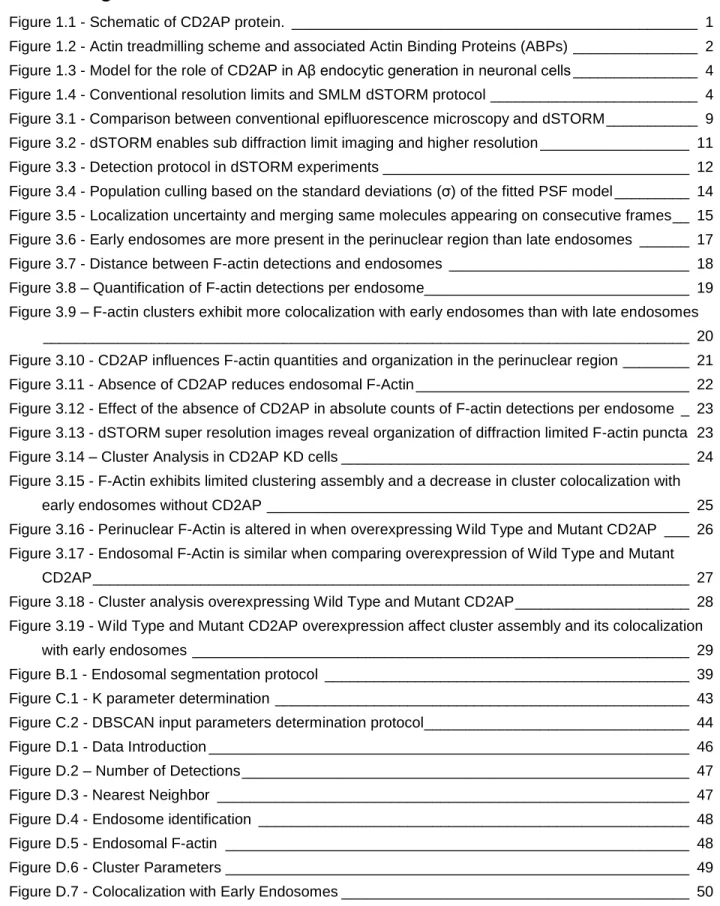
CD2AP is a multifunctional adapter type molecule localized in the cytoplasm, membrane ruffles and leading edges of cells. It has a molecular weight of approximately 70 kDa, three SH3 domains in the N terminus, a proline-rich region containing and a coiled-coil domain at the C terminus of the protein. SH3 domains are found in molecules related to signaling and cytoskeleton 11 (Figure 1.1).
Figure 1.1 - Schematic of CD2AP protein. Numbers indicate the limits of each domain. Orange indicates SH3 domains: Src homology 3 domain where the second one links to the c-Cbl protooncogene 12. Blue indicates the proline
rich domain that interacts with the Sh3 domain of cortactin 13,14. Green is the coiled coil domain with an F-actin binding
site15. Between proline rich and coiled coil domain there is capping protein binding site 14,16. Adapted from 12.
The name CD2AP (CD2 – associated protein) comes from being first identified as a scaffold protein necessary for clustering CD2 and polarizing the actin cytoskeleton at the immunological synapse, that is, the interface between a T lymphocyte and an antigen-presenting cell 11. In other studies, CD2AP colocalized
with cortactin, a protein involved in polymerization of F-actin, through interaction with the Arp2/3 complex. Direct interaction between the two molecules has been mapped to the proline rich region of CD2AP 13,14.
Quantitative nanoscopy of endosomal F-actin: Impact of an Alzheimer’s risk factor
2 assembly. This strong connection with molecules related with actin could link CD2AP and actin in several mechanisms of vesicular trafficking. In addition, actin and CD2AP, were shown to colocalize when associated to MVBs (Multi-Vesicular Bodies) belonging to late endosomal compartments 17 and to control
dynamic F-actin structures in early endosomes necessary to transfer VacA to late endosomes 18. These
findings indicate that CD2AP could be necessary to sort protein into the degradative pathway (like APP) and this is corroborated by the fact that the formation of MVBs is required to downregulating activated signaling receptors and that CD2AP has been involved in EGF receptor trafficking13, PDGF receptor 12 and
in VEGF receptor degradation19.
F-Actin and Intracellular Trafficking
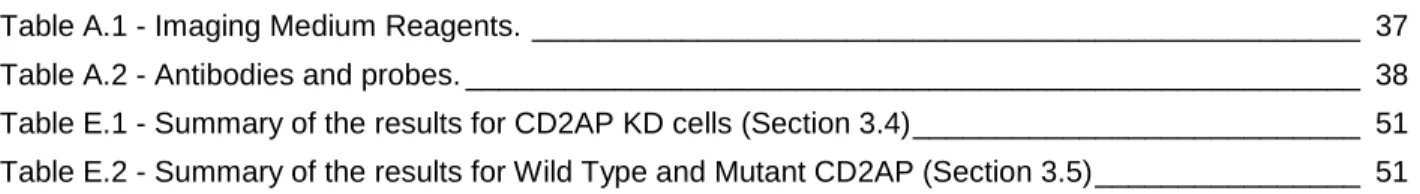
Actin is the most abundant protein in most eukaryotic cells, it participates in more protein to protein interactions than any other protein and it is an essential component of the cytoskeleton. The actin cytoskeleton functions in the generation and maintenance of cell morphology and polarity, endocytosis and intracellular trafficking and in motor functions like contraction, cell division and motility. The monomeric form, G-Actin interacts with other actin monomers, transforming the monomeric form in a polymerized or filamentous form called F-actin 20,21.
Figure 1.2 - Actin treadmilling scheme and associated Actin Binding Proteins (ABPs). The barbed end (+) is the polymerization site where new monomers are added and the minus end (-) is the depolymerization site 22. The Arp 2/3
complex promotes nucleation and branching activity 21,23,24. Cortactin stimulates a new conformation of the “mother”
branch by interacting with F-actin and mediates Arp 2/3 and WASP/WASH recruitment 25–27. Capping protein binds to the barbed-end (+) blocking the addition or loss of actin subunits 14,16,28. Adapted from 24.
The resultant filaments are polarized (plus and minus end). The addition of monomers is made on both ends but the plus end grows faster than the minus end. Monomers to be added carry ATP which can be hydrolyzed and converted to ADP (more instable), making easier to dissociate at the minus end, in a mechanism known as actin filament treadmilling 20–22,29. This is a dynamic process mediated by a large pool
of proteins called Actin Binding Proteins (ABPs) (Figure 1.2).
Endocytosis is required to recycle plasma membrane lipids, traffic proteins and for uptake or downregulation of cell surface receptors or proteins. Actin is present in the formation of clathrin coated endocytic vesicles, the most common endocytosis mechanism, in a polymerization process dependent of others ABPs like Arp2/3 complex, N-WASP and cortactin 30–32. Here actin is thought to provide the pressure
Quantitative nanoscopy of endosomal F-actin: Impact of an Alzheimer’s risk factor
3 formation and its separation from the plasma membrane 31,33. A similar mechanism might happen after
vesicle fusion with early endosomes where the transported cargo can be sorted into tubular extensions, being recycled to the plasma membrane, or incorporated in endosomal intraluminal vesicles (ILVs) and follow to the degradative pathway 36,37. The recycling route is Arp2/3 and WASH dependent. These two
proteins both stimulate the development of F-actin networks at the tubular extensions to help separating them from endosomes 38. Upon WASH knockdown, endosomes were reported to form exaggerated tubules
or no tubules at all, indicating that the branched F-actin networks are crucial for cargo exiting 38,39.
Cargo for degradation depends on sorting signals. Ubiquitin is one of the responsible signals working through covalent attachment to cellular proteins. It changes the stability, localization, or activity of the target protein 40. Recognition of ubiquitinated proteins is made by the hepatocyte growth factor-regulated
tyrosine kinase substrate (Hrs) 41. Hrs also binds to clathrin, present in early endosomes exclusively involved
in sorting cargo to the degradative pathway. The binding of Hrs to ubiquitin and clathrin leads to the formation of sorting microdomains that take the cargo into ILVs, separating the two types of cargo: recycled and for degradation 41,42. Endosomal clathrin was reported to stimulate polymerization of F-actin at the
immunological synapse 43 and a similar mechanism could evolve actin polymerization in ILV formation.
F-Actin, CD2AP and Aβ
APP is a transmembrane protein with large extracellular domains. Its precise function remains unknown but several studies have shown that APP is necessary for the normal cell growth, motility, neurite outgrowth and survivability 44. The protein has several processing pathways and some lead to the generation
of Aβ. After being synthesized in the endoplasmatic reticulum (ER) APP is carried to the TGN following the secretory pathway to the plasma membrane 45–47. At the plasma membrane, APP is either cleaved by α-secretase to produce a soluble domain of APP called sAPPα (soluble APP) which is neuroprotective, or it is endocytosed 48,49. Upon entering endosomes, cleavage by β-secretase can occur, being the most
important one BACE 1, crucial for cleavage of APP at the N-terminal β controlling the rate of generation of Aβ 50,51. After this, the resultant domain of APP (known as β Carboxyl Terminal Fragments – βCTF) is
cleaved by γ-secretase, producing p83 and two main forms (depending on the cleavage site) of Aβ: Aβ 40 and Aβ 42, being the last the most neurotoxic 52. Both BACE 1 and γ-secretase are found in endosomes. In
normal cells the Aβ generation is kept to a minimum 53–57 since BACE 1 recycled back to the plasma membrane (through fission processes and recycling endosomes) 55,58 and APP is marked for degradation
and incorporated in ILVs of the endosome and to follow the degradative pathway until the lysosomes (Figure 1.3 a)58,59.
Quantitative nanoscopy of endosomal F-actin: Impact of an Alzheimer’s risk factor
4
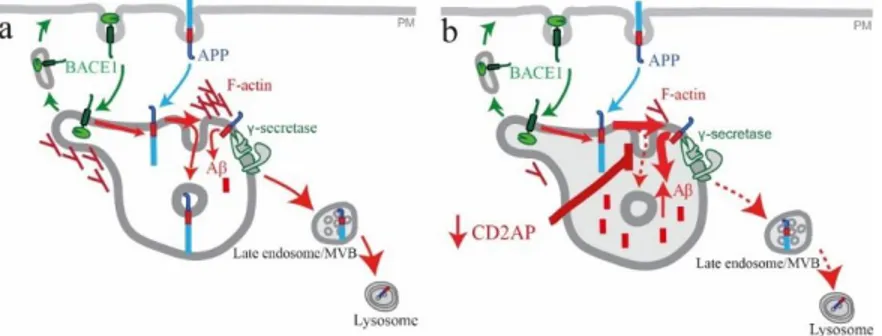
Figure 1.3 - Model for the role of CD2AP in Aβ endocytic generation in neuronal cells. a) Normal early/sorting endosome. In the presence of CD2AP endosomal F-actin is present at normal levels and regulates sorting mechanisms. APP is normally processed and Aβ levels are kept to a minimum. Some APP is cleaved by BACE1 and y-secretase. The major part is sorted for degradation through the degradation pathway. b) Alzheimer’s early/sorting endosome. Absence of CD2AP keeps unusual quantities of APP at the membrane where it is cleaved and increasing endosomal Aβ levels. Sorting for degradation is affected since most of APP was already cleaved, originating Aβ. F-actin levels also decrease and this could be in the origin of deficient sorting mechanisms for degradation. Adapted from 60.
In a recent study, Ubelmann et al 60 showed that CD2AP knock down increased Aβ levels through
trapping of APP at the early endosome membrane and thus increasing meeting chances between APP and BACE1. It was also observed, in results yet to be published, that in the in the absence of CD2AP that bright puncta of F-actin visualized through conventional fluorescence microscopy in the perinuclear region suffer a great decrease in its intensity (Figure 1.3 b). These data suggest a potential role for F-actin dynamics in the CD2AP-dependent sorting of APP for degradation. CD2AP could be controlling actin polymerization and thus control APP sorting or the membrane invagination process required for ILV formation.
Super Resolution Microscopy and dSTORM
For many years the most used technique to understand biological processes was fluorescence light microscopy 61. However, the resolution was diffraction limited due to the wave nature of the light when
passing through the objective of a microscope. Both Ernst Abbe and Rayleigh described it, differing only in the criteria of when two objects are distinguishable from each other 62 (Figure 1.4 a).
Figure 1.4 - Conventional resolution limits and SMLM dSTORM protocol. a) Different resolution criteria. Both assuming 510 nm emission wavelength and a 1.4 objective numerical aperture. On top the individual emitter intensity profiles of the PSF’s (Point Spread Function). On bottom the profile of merged PSF’s. b) Raw image of a PSF. c) Fitting a Gaussian model to b). The black dot indicates the calculated center of the emitter. d) SMLM dSTORM localization protocol. From top to bottom: Top) An array of diffraction limit and indistinguishable PSF’s. Middle) After inducing the initial dark state, the stochastic nature of dSTORM stochastically activates fluorophores in a transient process. Bottom) The set of PSF’s is well resolved through determination of each center by the procedures of b) and c), resulting in higher resolution. Adapted from 63,64.
Quantitative nanoscopy of endosomal F-actin: Impact of an Alzheimer’s risk factor
5 In order to watch biological processes at protein levels led to the creation of super resolution techniques. One of these techniques is dSTORM and it belongs to the group known as Single Molecule Localization Microscopy (SMLM) 65 because it detects the emitter center individually.
The response of a microscope to a point of light is described by a model known as the Point Spread Function (PSF) that reflects the intensity distribution of the light coming from the emitting source 62,65–68.
Illuminating a labeled structure results in an array of several PSFs making impossible to distinguish individual point sources within the same diffraction limited area due to the merging of their PSFs 67, Figure
1.4 d-Top. dSTORM enables the presence of only one emitter present at this area at a time by using a combination of reversibly switchable probes like Alexa-647 and specific imaging mediums to induce fluorophore switching between a bright (ON) and dark (OFF) state, Figure 1.4 d-Middle, and fulfilling the requirements necessary to achieve the higher precision possible 69. These requirements are: a) Emitting a
high number of photons and b) Low ONstate/OFFstate ratio (Duty Cycle). High photon count per molecule
improves the Signal to Noise Ratio (SNR) and it’s a prime parameter to calculate with accuracy the position of the molecule (equation 1.1), Figure 1.4 d-Bottom. A low duty cycle lowers the probability of having more than one molecule in the ON state in a diffraction limited area 70.
𝑑 ≈ 𝜎𝑥
√𝑁 (1.1)
The stochastic switching behavior is a consequence of: oxidation and reduction reactions happening between the fluorophore and the imaging medium, stimulated by illumination with laser powers high enough to trigger the transition of the molecule from singlet state to triplet state. Triplet state is an intermediate state where the electron is still in a high energy level, without recovering to ground state and therefore not emitting a photon. After being able to have one emitter at a time in a diffraction limited area, the individual emitter positions can be extracted by fitting the emitter signal, by an appropriate PSF model function (Figure 1.4 c) which is an estimate between molecular position and its intensity, before they bleach (enter in a permanent dark state). A two dimensional Gaussian for example, described in the next equation 67,
ℎ𝐺(𝑥, 𝑦 |𝜃) = 𝜃𝑁 2𝜋𝜎2 × 𝑒 (−(𝑥−𝜃𝑥) 2−(𝑦− 𝜃 𝑦)2 2𝜎2 ) + 𝜃0 (1.2)
ℎ𝐺(𝑥, 𝑦 |𝜃) represent the photon count at position (x, y), knowing the parameters 𝜃 =
{𝜃𝑥, 𝜃𝑦, 𝜃𝑁, 𝜃0} .Here, 𝜃𝑥, 𝜃𝑦 are coordinates of the emitter center, 𝜃𝑁is the total number of photons, 𝜃0 is the
background offset (signal coming from the background that is neither from camera baseline nor from the molecule itself) and 𝜎 is the width of the fitted Gaussian in the respective direction (x or y in 2D) 63.
The fitted signal comes from raw images, as represented in Figure 1.4 b. Hence, it is critical that the acquisition is performed by cameras with high quantum efficiency and pixel size matching Nyquist criteria. Normally, EMCCD (Electron Multiplying Charge-Coupled Device) or sCMOS (Scientific Complementary Metal Oxide Semiconductor) devices are used for this ending. EMCCD have a higher quantum efficiency, lower read noise but suffer from excess noise per pixel (consequence of the probabilistic nature of the electron multiplying gain). sCMOS have a smaller quantum efficiency and higher read noise but they don’t suffer from excessive noise per pixel and can enable much faster acquisitions. Besides, when the number of collected photons is high enough, sCMOS can perform better than EMCCD cameras 71,72.
Quantitative nanoscopy of endosomal F-actin: Impact of an Alzheimer’s risk factor
7
Materials and Methods
Cell Culture
Neuroblastoma Neuro2a (N2a) cells (ATCC CCL-131) are a mouse neuroblastoma cell line. These cells are like neuronal precursors that can differentiate into neurons, and are able of unlimited proliferation in vitro. N2a cells were grown in Dulbecco’s Modified Eagle Medium (DMEM) (DMEM + GlutaMAX supplement, Gibco, Life Technologies) supplemented with 10 % fetal bovine serum (FBS) (Sigma-Aldrich) in a humidified incubator at 37 °C with 5 % CO2. After reaching 80-90% confluence they were washed once
with phosphate buffered saline (PBS, pH 7.4) (Gibco, Life Technologies) and trypsin (Life Technologies) was added to dissociate adherent cells from the dish. After trypsin addition, cells were incubated 5 minutes at 37 °C with 5 % CO2. Trypsin activity was stopped by adding complete medium (DMEM + GlutaMAX
supplement + 10% FBS). To maintain cell culture, the resulting cell suspension was split in a dilution of 1:10 to a dish. Cells were counted using a Neubauer Chamber and platted in different amounts to perform different experiments. 150 000 cells per mL were plated to evaluate the effect of CD2AP wild type and mutant form on early endosomes. To assess the effect of CD2AP downregulation (siRNA for CD2AP) on F-actin patterns and their relation with early endosomes, 50 000 cells per mL were plated to reach the best confluence after 72h of incubation.
DNA Transfection
N2a cells were plated in glass coverslips inside a 6-well plate and cultured in complete medium in 5% CO2 at 37 °C. After 24h of culture, the confluence was about 80%–90% and cells were transiently transfected with 0.5µg of cDNA with Lipofectamine 2000 (Life Technologies). Cells were analyzed after 24h of treatment. We used the following DNA plasmids encoding: CD2-associated protein in expression vector pEGFP, hereafter referred as wild type, and gently ceded by M. Cormont (University of Nice); CD2-associated protein with a gene variation on the 633 position (K633R) in expression vector pEGFP, hereafter referred as the mutant form; the empty vector pCS2 with GFP; and also, Rab5 in expression vector pEGFP, a gift from M. Arpin (Institut Curie).
siRNA Transfection
For small interfering RNA (siRNA) treatment, N2a cells were transiently transfected with 10 nM specific siRNA with Lipofectamine RNAiMax (Life Technologies). The amounts and volumes are given on a per well basis. The following siRNA oligonucleotides were used: as siControl a non-targeting control siRNA (10uM) (UUC UCC GAA CGU GUC ACG UTT ACG UGA CAC GUU CGG AGA ATT) (Life Technologies) and for knockdown of CD2AP, siCD2AP (10uM) (Santa Cruz). Cells were analyzed after 72 h of treatment. When indicated, cDNA was transfected after 48 h of siRNA treatment and cells were analyzed after 24 h (when transfecting with Rab5).
Immunofluorescence
Cells were washed 2 times with PBS 1X to remove the reminiscent culture medium. They were then fixed with PFA/PEM solution (Appendix A) in order to preserve the actin cytoskeleton the best way possible
Quantitative nanoscopy of endosomal F-actin: Impact of an Alzheimer’s risk factor
8
73 for 10 min, after which were washed four times with PBS 1X. After this, cells were permeabilized using a
solution of 0.1 % (w/v) of saponin (Sigma Aldrich) in PBS 1X for 30 minutes. Then, cells were washed with PBS 1X four times and blocked using a solution of 2 % (w/v) BSA (Sigma-Aldrich) in PBS 1X for 30 minutes, washed again with PBS 1X four times. After this cells were incubated at 4 ºC overnight with primary antibodies (Appendix A). Cells were then washed four times with PBS 1X to remove the excess of primary antibody. Appropriate secondary antibodies or probe (Appendix A) diluted in blocking solution were used for 1 hour at room temperature. After washing four times with PBS 1X, cells were fixed again in PFA/PEM solution for 5 minutes and washed four times with PBS 1X.
Imaging Medium Preparation
Before dSTORM acquisitions, samples were mounted in concave slides (VWR) using a modified version of the imaging buffer previously reported in several studies 70,74. All the intermediate solutions are
described in the Appendix A. It is composed by 140 µL PBS 1X (74.6 %), 20 µL MEA (10.6 %), 20 µL Glucose 40 % (10.6 %), 4 µL cyclooctatetraene (2.1 %) and 4 µL oxygen scavenger (2.1 %). Slides were then sealed with twinsil (Picodent). Percentages indicate solution volume fraction.
Image Acquisition and Analysis
Images were acquired on a custom made system based on a Nikon Ti microscope body, equipped with a sCMOS camera, Hamamatsu Flash ORCA 4.0, using the a Nikon 100X 1.45 NA Oil immersion objetive. A 642 nm Vortran Stradus was used to excite Alexa-647 at 350 W/cm2. For maximum specificity a
Chroma 640LP filter for 642 excitation were used. Images were acquired with MicroManager microscope control software 75. Each acquisition was composed by 20000 frames with an exposure time of 10 ms.
Reconstructed images using ThunderSTORM 76 were rendered to a pixel size 10 times smaller than the
camera pixel size, yielding to a pixel size in dSTORM images of 14.1 nm x 14.1 nm. The output of ThunderSTORM is in the form of pointillist x-y coordinates of the localized fluorophores that can have up to millions of entries. All measurements are performed in RStudio 77, a free and open-source integrated
development environment (IDE) for R, a programming language for statistical computing and graphics. Before feeding the coordinates of the localized emitters to Rstudio every list passes through an optimization protocol that includes choice of ROI (Appendix B), population culling and a merging algorithm (explained and discussed section 3.2.2). F-actin pattern study and measurements are described in Appendix D. All the data is presented as mean ± SEM (Standard Error of the Mean).
Quantitative nanoscopy of endosomal F-actin: Impact of an Alzheimer’s risk factor
9
Results and Discussion
dSTORM vs Conventional Fluorescence Microscopy
In this section we discuss the improvement in resolution offered by dSTORM when compared with conventional epifluorescence imaging but also the main challenges arising when using dSTORM. For that we used F-actin super resolved images acquired in our setup (described in section 2.6).
Colocalization of signal is a strong indicative of protein interaction in biology. However, the resolution in conventional epifluorescence imaging is limited and so is the certainty of this colocalization. Super resolution like dSTORM enables to see under the PSF and detect colocalization with more accuracy.
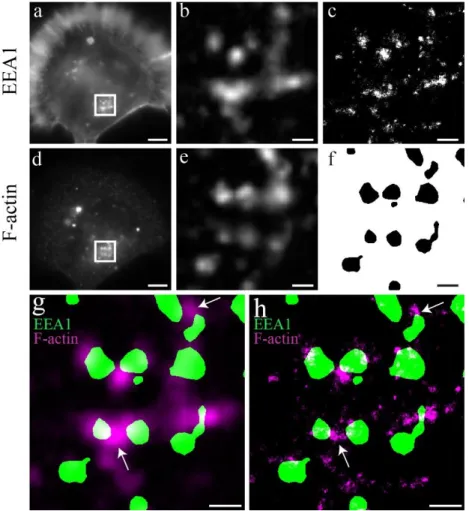
Figure 3.1 - Comparison between conventional epifluorescence microscopy and dSTORM. a), d) Epifluorescence images of N2a cells stained with phalloidin and EEA1 antibody, respectively. b), c) White boxes magnification a) and d) respectively. Background was subtracted to visualization purposes. c) dSTORM reconstruction of b). f) Endosome segmentation of e). g) Merging of b) and f). Some Endosomes colocalize with F-actin epifluorescence signal. h) Merging of c) and f). White Arrows indicate areas with clear differences of colocalization with conventional epifluorescence microscopy vs colocalization with super resolution. Scale bars: a, d 5 µm. b, c, e, f, g, h 1 µm
As observed in Figure 3.1 the epifluorescence signal is broader than the signal in dSTORM images. The points of highest intensity match both in epifluorescence and dSTORM, indicating that a higher intensity in an epifluorescence image corresponds to a higher presence of the labelled protein. The blob like signal
Quantitative nanoscopy of endosomal F-actin: Impact of an Alzheimer’s risk factor
10 is much smaller in dSTORM images because it is no longer limited in resolution. This difference leads to an apparent colocalization of signal in epifluorescence images that in the end is just a superimposition of the molecule PSF’s, as exemplified in section 1, Figure 1.4 d. This can lead to erroneous conclusions of protein-protein interaction. For example, in Figure 3.1 g the top white arrow indicates an area where the F-actin seems to colocalize with both endosomes. In Figure 3.1 h we see that in the same area there is only colocalization between the F-actin agglomerate and one of the endosomes. Besides improving colocalization analysis, dSTORM also enables the visualization of structures unresolvable by epifluorescence microscopy. In this case it is very important to note that although this is a technique that enables resolutions of a few tens of nanometers, it also requires a great deal of optimization, especially in terms of labeling (further discussed in section 3.2.3), and could introduce different kinds of artifacts. One also will never have 100 % certain of every detail presented in a super resolution image because there are many sources of possible errors 78. Figures 3.2 b) and e) represent epifluorescence and dSTORM
reconstruction of the same area, respectively. One can clearly see that there is a huge improvement in the detail between both images. The resolution improvement is due to the sub pixel localization and because of it, one can transform each pixel in image b) in 10 pixels in image e) (reconstruction input of our implementation), and map detections with sub pixel accuracy. This procedure is explained in detail in section 3.2.1.
To answer the question “Is the structure, approximately, real?” there are two common methods. The first one is to screen a lot of samples, increasing the comparison population of the structures in study, to establish common characteristics or to average the resultant images to have a better approximation of the real structure 79. The other one is to image known and well characterized structures like microtubules, the
Nuclear Pore Complex (NPC), the space between the pre and postsynaptic cell, among others. They have an expected output and could also serve has a calibration method or a setup optimization tool to other error sources like setup temperature, exciting wavelength and intensity, coverslip thickness, refractive index mismatch between the lens immersion media and the specimen and imaging medium composition 80.
Having said this, Figure 3.2 e) is only a possible structure of its corresponding epifluorescence image. Resolution wise, Figures 3.2 c) and f) also translate the improvement given by this technique.
The resolution measurement given by the Full Width at Half Maxima (FWHM) in Figure 3.2 g), a common method to measure resolution, is only an approximation because the place of choice for the measurement has associated errors like labeling density variability, local SNR or changes in the structure itself 81. Again, multiple measurements are necessary in order to achieve an average with high enough
Quantitative nanoscopy of endosomal F-actin: Impact of an Alzheimer’s risk factor
11
Figure 3.2 - dSTORM enables sub diffraction limit imaging and higher resolution. a) Representative N2a cell labeled for F-Actin. d) dSTORM image of a). b) and c) Epifluorescence magnifications of white boxes in a). Both images were background subtracted for enhanced contrast. e) and f) Magnifications of white boxes in d). No longer being diffraction limited, the images enable to b) with higher detail. g) Transversal measurement of the branch represented in f) (red line) shows a branch width of 73 nm. Super resolution measurements are performed by fitting the intensity profile along a line and fitting it to a Gaussian curve. The Full Width at Half Maxima (FWHM) indicates an approximate value for the distance measurement and it is defined as 𝐹𝑊𝐻𝑀 = 2.35 × 𝜎𝑥 , where 𝜎𝑥 is the standard deviation of the
Gaussian fit of the intensity profile. Scale bars a, d 5 µm. b, e 200 nm. c, f 500 nm.
Compared with conventional epifluorescence, dSTORM offers an important improvement in resolution but also increased error sources that must be dealt with optimization and with a considerable sample size to reduce possible artifacts coming from those error sources.
dSTORM, Single Molecule Detection and Quantitative SMLM
Another important feature discussed in this section about dSTORM is the possibility of having access to individual locations of the detected molecules and being able to quantify them. This enables new kind of analysis but also to the necessity of implementing certain protocols to prevent errors caused by fluorophore behavior or by poor detections 82–87.
Quantitative nanoscopy of endosomal F-actin: Impact of an Alzheimer’s risk factor
12
3.2.1 Detection Protocol
Figure 3.3 a shows an epifluorescence image where all fluorophores are emitting at the same time. After illuminating the sample with a laser matching the absorption spectrum of the fluorophore and with enough power, the sample starts to show a switching behavior, illustrated in Figure 3.3 b. The fluorophore changes between bright and dark are transient and stochastic and each frame shows a stochastic subset of molecules in the ON state (activated). After having acquired enough frames similar to Figure 3.3 b, ThunderSTORM sweeps to every frame and starts by identifying single emitters by filtering the raw acquisition frames (Figure 3.3 c) and applying a threshold to the pixel intensity values obtained in the filter output image. Our filter settings were chosen according to Ovesny, 2016 63 and our threshold was set to 2.2
times the frame pixel intensity values standard deviation. With lower threshold values, it was visually inspected that a lot of detections were coming from background fluctuations and not only from those bright spots observed in Figure 3.3 b. These background fluctuations are unwanted and could arise from emitters out of the Field of View (FOV). After this step, the filter output images are analyzed and the pixels with the highest intensity in an 8-connected neighborhood (a 3 × 3 matrix around central pixel) are set to be a putative emitting fluorophore. If these pixels have a higher value than the defined threshold they are considered an emitting fluorophore and the approximated location of the molecule is set to that pixel (Figure 3.3 d red dots and Figure 3.3 e red square).
Figure 3.3 - Detection protocol in dSTORM experiments. a) Epifluorescence image of N2a cell with labeled F.actin.
b) Representative frame of dSTORM acquisition. The small light dots represent labeled F-actin molecules stochastically
activated. c) Filtered frame of b). d) After identifying local maxima in c) that fulfill threshold requirements a set of approximated locations of molecules is determined (red dots in d). e) Sub image around identified emitter in d (white box) Red square is the pixel with highest intensity and the approximated location of the emitter. f) PSF Gaussian fit of e) and sub pixel emitter localization by least square fitting (black dot). Scale bars a-d 5 µm. Scale bars e, f 280 nm.
Quantitative nanoscopy of endosomal F-actin: Impact of an Alzheimer’s risk factor
13 In every dSTORM experiment there is a time interval where the fluorophores are being induced to the metastable dark state, characterized for a high density of emitting fluorophores. Therefore we only included in our analysis the molecules detected after 10000 frames, allowing for the fluorophores to enter the metastable dark state and giving a margin to reach an equilibrium state where they switch between the on and off states as much separated from each other as possible. This leads to a compromise between erroneous detections undetected emitters because they could bleach completely before detection, also considered as an artifact 78. A sparse activation of the emitters is vital when using an algorithm for sub pixel
localization that assumes to be only a single activated emitter present in the sub-image where the localization is performed 63,78,80. With our settings, a sub-image corresponds to an area of 7 × 7 pixels
centered on the pixels of the molecules approximated locations (Figure 3.3 e). If we take our system pixel value (141 nm x 141 nm) this results in a square of 987 nm × 987 nm. The choice of this area is based on the PSF geometry of the fluorophore in question. That could be determined or approximated with a high confidence if we run the algorithm in a few frames, in the same conditions of our experiments 88. We
observed that the standard deviation of the fitted Gaussian (σ) profiles had a mean value around 180 nm (that is equivalent to 1.3 in pixel units). According to ThunderSTORM creators guidelines the fitting radius should be an integer close to the value 3 × σ 88. The reason is because the fitting is going to assume a
Gaussian profile of the PSF. Values of 3 × σ in this profile means that there is a 99.73 % of probability of the real emitter center to be within this area. By choosing a fitting radius of 3 pixels we are using a value of 2.3 × σ which means that we are between the known percentiles of 2 × σ (95.44 %) and 3 × σ (99.73 %). The other alternatives were a fitting radius of 2 pixels or 4 pixels that would lead to an area of 564 nm × 564 nm and 1128 nm × 1128 nm, respectively. Even though 4 pixels would lead to an area broad enough to ensure a probability > 99.73 %, the sub image area would be 1.3 times bigger than the one with 3 pixels, increasing the probability of finding another molecule in the same area. On the other hand, with a fitting radius of 2 pixels we would be only between 1 × σ (68.26 %) and 2 × σ (95.44 %), losing too much localization precision. Solutions based on Multi Emitter Fitting algorithms 89 enable more than one emitter
per sub image but the image processing is very time consuming so we choose speed at the cost of some inaccurate detections. After having the sub image the raw image is approximated by a PSF function following a Gaussian model (Figure 3.3 f) (equation 1.2), where the difference between the intensity observed in the raw image (Figure 3.3 e) and the value returned by equation 1.2 is minimized by the least squares fitting method. The position where that happens is the subpixel location (Figure 3.3 f, black dot).
3.2.2 Population optimization
After having sub pixel localizations of emitters, we still needed to optimize our population. First of all, fluorophore behavior is very dependent of the nano environment that influences its photophysical properties 63,78,80. It was also already reported that standard deviations of the fitted Gaussians (𝜎) are
normally distributed around expected values (fluorophore characteristic) 86 and in our experiments they were
indeed approximately described by this distribution. To further guarantee that the sub-pixel localization was correctly done, we excluded detected emitters based on (𝜎) and intensity values. To know the acceptable interval we needed a population on which we could make decisions based on the distributions (𝜎). So, we first restricted the analysis to the ROI, removed the localization performed in the first 10000 frames, limited
Quantitative nanoscopy of endosomal F-actin: Impact of an Alzheimer’s risk factor
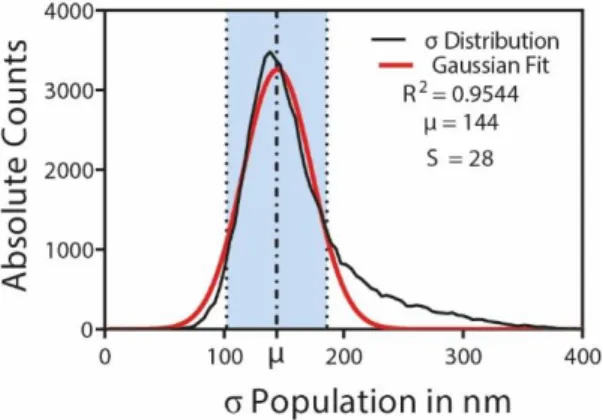
14 the intensity per detection to 10000 photons and also removed emitters with a standard Gaussian deviation bigger than 400 nm (false detections). Having our population we limited the acceptable 𝜎 interval to 𝜇 ± 1.5 × 𝑆 86, represented in Figure 3.4,
Figure 3.4 - Population culling based on the standard deviations (σ) of the fitted PSF model. The resultant distribution after restricting to the ROI, removing the first 10000 frames as well as emitters exhibiting a photon count superior to 10000 and a sigma superior to 400 nm is given by the black curve. A Gaussian fit is performed and the interval of σ is calculated based on the standard deviation of this fit (S). The interval (light blue) is defined as µ ± 1.5 × S, where µ is the mean of the fitted Gaussian.
This procedure removes detections originating from multiple emitters in the same sub image that are the most likable reason for the distribution to stretch towards the right because multiple emitters increase the size of the PSF. The smaller values being filtered could represent detections originating from background fluctuations.
The last step was to apply a merging algorithm 86,87,90,91 that is of the most importance since we are
studying the F-actin patterns distribution, counts and clustering. Not applying it has been reported as one of the most frequent artifacts in quantitative SMLM 78,80,84. In Figure 3.3 b is represented a single frame
exhibiting some of the fluorophores in the ON state. The rate at which these fluorophores go back to ground state is also stochastic, which means that some could be ON through 5 frames while others could be through 10 or 15 frames. ThunderSTORM performs emitter detection frame by frame and the detection protocol that we already discussed in section 3.2.1 is repeated every frame. This means that if an emitter stays in the ON state longer than one frame it will be erroneously considered as a different molecule in the next frame and localized at approximately the same position (approximately because there could be slight variations in the emission profile that lead to slightly different sub pixel localization). So, in order to correct this undesirable situation when doing cluster analysis and studying patterns we had to know until what distance emitters appearing in consecutive frames are still considered the same one and merging all consecutive detections of that same emitter into a single detection. The distance threshold criteria we used to merge was a function of localization uncertainty without any temporal capping (for how long this consecutive blinking lasts), Figure 3.5. Similarly, to the 𝜎 parameter, we could also have a distribution of localization uncertainty with a Gaussian shaped error. In practice, an emitter is localized but its exact position has always an error associated with the system acquisition instrumentation, nano environment conditions, and
Quantitative nanoscopy of endosomal F-actin: Impact of an Alzheimer’s risk factor
15 fluctuations in the emitter photon emission among others. In our implementation, the approximate value for uncertainty is mathematically given by,
(∆𝜃̂𝑥𝑦)2|𝐿𝑆𝑄= 𝑔𝜃̂𝜎2+ 𝑎2 12 𝜃̂𝑁 (16 9 + 4𝜏) (3.1) 𝜏 = 2𝜋(𝑏̂ 2+ 𝑟)(𝜃̂ 𝜎2+𝑎 2 12) 𝑎2𝜃̂ 𝑁 (3.2)
Where (∆𝜃̂𝑥𝑦)2|𝐿𝑆𝑄 is the uncertainty of the emitter localization by least-squares method (our choice), 𝜃̂𝜎2 is
the standard deviation of the fitted Gaussian PSF in nm, 𝑎 is the pixel size in nm, 𝜃̂𝑁 the estimate of the
number of photons to a given emitter, 𝑏 the background signal (standard deviation of the residuals between raw data and the fitted PSF model and 𝑔 and 𝑟 correction factors dependent of the type of camera used (in our case sCMOS being both equal to 2) 63. Since the average localization precision of single emitters in our
dSTORM experiments can be determined by fitting a normal distribution to our population uncertainty values, the 2-dimensional Gaussian PSF error profile would have a maximum of 3 times the acquisition average uncertainty value. An emitter has 99.7% probability of being within an area with radius equivalent to 3 times of the PSF 90. Having performed this merging step we reduced putative clusters originating from
a single fluorophore emitting through several consecutive frames and an over counting of emitters since many localization were merged into a single localization. This procedure is very important when performing quantitative kind of analysis in dSTORM experiments 87
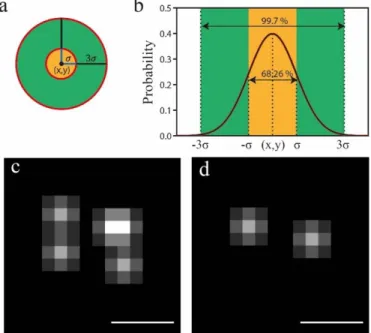
Figure 3.5 - Localization uncertainty and merging same molecules appearing on consecutive frames. a) Top view representation of the sub-pixel localization of a molecule. Its center (x, y) is determined with an associated uncertainty. Using a Gaussian error model the uncertainty values correspond to the standard deviation of the Gaussian curve for molecular position (σ) and we can determine the known quantile 3σ. b) Transversal view of a).The percentages indicates the probability of having the molecule in a circle with radius corresponding to σ (yellow) and 3σ (green). c) Detected molecules in 15 consecutive frames without applying the merging algorithm. d) c) after applying merging algorithm. Scale bars 70 nm.
Quantitative nanoscopy of endosomal F-actin: Impact of an Alzheimer’s risk factor
16
3.2.3 dSTORM Phalloidin Labeling
Another important aspect when using dSTORM is the labeling itself. This is a technique that uses a lot of computational processing power to complete all the calculations necessary to obtain the super resolution image. But even with the perfect processing steps, meaning without input errors and an ideal acquisition system, the final image could not be corresponding with the real structure. This is due to the fact that the labeling of a structure “increases” the size of the structure that is now composed by the protein plus the probe with the fluorophore. Besides that, when dealing with known and unknown structures, it is important to perform labeling density studies to ensure the desired local density because of the random nature of probe binding. Furthermore, it was demonstrated by Nyquist and Shannon and Legant et al, 2016
81 that the desired resolution is only obtained if there is a labeling density high enough to ensure the
presence of two fluorophores separated by a distance that must be half of the desired resolution. For example, if the primary/secondary antibody increases the effective size of the protein by 20 nm, the resolution is already limited to 40 nm. Although we didn’t study the labeling density in this work, we still optimized the process by staining the actin filaments with phalloidin probes instead of primary and secondary antibody typical staining. When comparing with primary/secondary antibody complex with phaloidin staining the possible obtainable resolution goes from 40 nm to 5 nm. Phalloidin is a toxin that binds with high affinity to F-actin and has the size in the order of the 10 Å to 20 Å, and thus compatible with dSTORM 92,93 .
F-Actin Correlation with Early/Late Endosomes
To study the F-actin patterns in N2a cells and to determine if the perinuclear F-actin is more associated with early or late endosomes we resort to the mapping capabilities of dSTORM. After culturing and fixing N2a cells, the protein of interest, F-actin, was stained with the conjugate Alexa647-phalloidin. Since EEA1 and LAMP1 are proteins characteristic of the early and late endosomes, respectively we co-stained cells with primary antibody against EEA1 or with primary antibody against LAMP1. We repeated this experiment twice but there were some technical difficulties with the image acquisition in one experiment and thus the results are not included in the thesis. In the excluded experiment was obtained a very different number of F-actin particles detected between cells stained against EEA1 and cells stained against LAMP1. In fact, if we consider the mean number of F-actin particles detected per cell there is a variation of almost 100 % between the two staining conditions. This can be explained by a deficient staining or by an insufficient imaging medium penetration into the cells.
Differential and uneven staining is avoided as much as possible by staining both conditions at the same time, with the same preparations of phalloidin. On the other hand, the preparation of the imaging medium is done individually for each sample. If the buffer fails to reach the cells effectively, all the dynamic changes between triplet and singlet state are altered. Moreover, the blinking behavior is known to be linked to an environment without oxygen, being the oxygen scavenger present in the buffer critical to this end 70. If
the blinking behavior is not efficient it will influence the detection of fluorophores. Having into account this big variation of F-actin particles, and since we are studying spatial patterns and their distributions, we decided not to include those results. In the second experiment, the mean variation of F-actin detections between conditions was 14 %. It is hard to say if this is acceptable or not, however it is perfectly normal to
Quantitative nanoscopy of endosomal F-actin: Impact of an Alzheimer’s risk factor
17 have a variation in the number of particles as there are a lot variation sources, for example: metabolic or cell cycle status of the cell, or heterogeneous labeling density. All the measurements should be interpreted as relative variations, tendencies or averages instead of absolute counts.
Before looking into the F-actin patterns we measured the presence of both types of endosomes in the perinuclear area because this is also an indicative of the putative relation between actin and both types of endosomes (Figures 3.6 a-f).
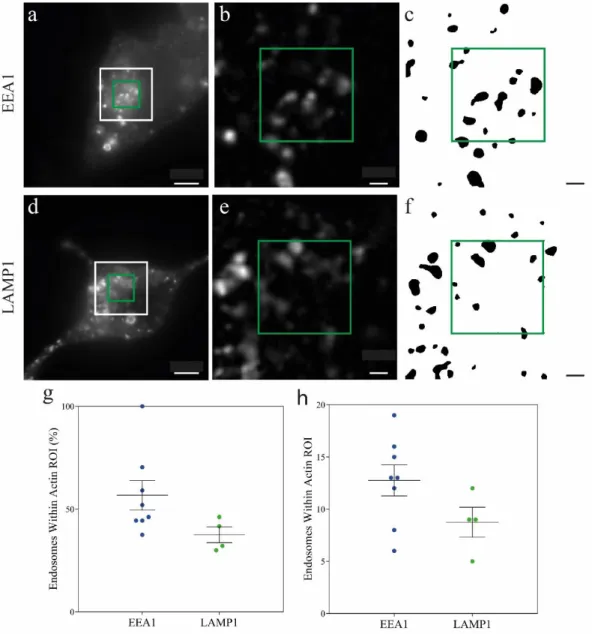
Figure 3.6 - Early endosomes are more present in the perinuclear region than late endosomes. a), d) Representative epifluorescence images of N2a cells with labeled early endosomes and late endosomes. The white frame indicates endosomal ROI and green frame indicates Actin ROI. b), e) White frame magnification of a) and d) respectively and background subtraction for visualization purposes. c), f) Endosome segmentation (See Appendix B).
g), h) Early and late endosome quantification within Actin ROI (green square) in percentage and absolute counts,