SORGHUM GENOTYPES EVALUATION UNDER SALINITY LEVELS AND GAMMA RAY DOSES
JOSÉ N. TABOSA1, WALDECIRO COLAÇO2, ODEMAR V. DOS REIS1, JOSIMAR B. SIMPLÍCIO1 ,
HÉLIO W. L. DE CARVALHO3 and FLAVIO M. DIAS1
1 Researchers of Agricultural Research Corporation of the State of Pernambuco – IPA (Empresa Pernambucana de
Pesquisa Agropecuária) – Av. General San Martin, 1371, Bonji, Recife, PE – Brazil, CEP: 50761-000, E-mail: tabosa@ipa.br
2 Researcher of Federal University of the State of Pernambuco – UFPE / Nuclear Energy Department – DEN
(Univer-sidade Federal de Pernambuco / Departamento de Energia Nuclear) – Av. Prof. Luiz Freire, 1000 – Cidade Universi-tária, Recife, PE – Brazil, CEP: 50740-540, E-mail: wcolaco@ufpe.br
3Researcher of Embrapa Tabuleiros Costeiros Research Center, Av. Beira Mar, 3250, 49025-040, Aracaju – SE,Brazil,
E-mail: helio@cpatc.embrapa.br
ABSTRACT - Experiments were carried out during the year of 2004 with the collaboration of
the Nuclear Energy Department (DEN), the Federal University of the State of Pernambuco (UFPE), and the Agricultural Research Corporation of the State of Pernambuco (IPA). The main objective was to identify, evaluate and select high salinity resistance sorghum plants (from varieties V1- IPA 467-4-2, V2- IPA- 02-03-01 and V3- IPA- Sudan 4202) under ionizing radiation effects and electrical conductivity of the soil saturation extract – EC levels. The doses (applied to the seeds) of gamma rays from 60Co were 0, 450, 500 and 600 Gy and the salinity levels used were 0, 15 and 30 dS.m–1 of electrical conductivity – CE. The main results were: a) electrical conductivity levels between 15 and 30 dS.m-1 and gamma ray doses of 450 Gy allowed for the selection of sorghum genotypes that are resistant to salinity; b) molecular markers of the microsatelites type SSR - simple sequences repeated, revealed genetic changes in appearance of irradiated and non irradiated sorghum genotypes.
Key words: electrical conductivity; salinization; forage sorghum; radiosensitivity
AVALIAÇÃO DE GENÓTIPOS DE SORGO SOB NÍVEIS DE SALINIDADE E DOSES DE RADIAÇÃO GAMA
RESUMO – O trabalho conduzido durante o ano de 2004, com a colaboração do
Departa-mento de Energia Nuclear da UFPE e com o suporte do IPA – PE. O objetivo foi identificar, avaliar e selecionar materiais de sorgo das variedades V1 –IPA- 467-4-2, V2- IPA- 02-03-01 e V3 – IPA- Sudan 4202, visando resistência a níveis elevados de salinidade. O experi-mento foi conduzido em casa de vegetação, onde foram avaliados os efeitos de doses eleva-das de radiação gama (0, 450, 500 e 600 Gy) aplicada nas sementes dos materiais de sorgo, em presença dos níveis de salinidade de 0, 15 e 30 dSm-1. Os principais resultados obtidos foram: a) níveis de condutividade elétrica entre 15 e 30 dSm-1, juntamente com a dose de radiação gama de 450 Gy, permitiram selecionar genótipos de sorgo resistentes à salinidade; b) as análises decorrentes do uso de marcadores moleculares do tipo microsatélites SSR – Seqüências Simples Repetidas caracterizaram a ocorrência de alterações genéticas configura-das pelas diferenças de respostas observaconfigura-das entre os materiais irradiados e o material sem irradiação.
Palavras-chave: condutividade elétrica; salinização; sorgo forrageiro; radiosensitividade.
Soil salinity is one of the main problems for world agriculture (Ahloowalia et al., 2004). It is defined as a situation of excessive soluble salts in the soil or roots region (Trindade et al., 2006). The soluble salts are formed by cations Na+, Ca++ and anions Cl- and SO
4
- -. The excess salt lowers the osmotic potential of the soil solution and increases its electrical conductivity (EC), (Richards, 1974). In the arid and semi-arid regions the salinity inhibition of plant growth is the result of osmotic and ionic effects and of the different mechanisms to cope with these effects (Munns et al., 2002). The process occurs because of incomplete lixiviation and intensive soil evaporation. This process is characterized as the main factor of world soil degradation (Heinze, 2002), which affects around 60 to 80 millions of hectares (Munns et al., 2002; FAO, 2004).
The irrigated agricultural area of the northeast region of Brazil is around 500 thousand hectares, where 25 to 30% is in the process of salinization (Heinze, 2002). The agricultural potentiality in the salinized areas is directly associated to available salt resistant cultivars. The intensive crop yield in these salinized areas helps to resolve a great livestock regional problem of shortage of forage crops, mainly during dry period of the year. The Sorghum plant is a tropical grass that offers an alternative of genetic viability to adverse abiotic factors (Tabosa et al., 2002; Krishnamurthy et al., 2007).
Sorghum is the fifth mostimportant cereal in the world after maize, wheat, rice and barley. According to the Association Pró-Sorgo/ APPS (2005, 2007), in 2004, 2005 and 2006, the Brazilian sorghum area was 1,269,000 , 1,152,120 and 1,184,482 ha, respectively. In the Pernambuco State semi-arid region, the grain sorghum area in 2006 was 37,700 ha.
New materials can be obtained with favorable characteristics in view of great energy transparence to plant tissue (IAEA, 1977). According to Ahlowalia et al. (2004) there were 2,250 new registered mutants from 163 botanical species, from 62 countries. For sorghum plants submitted to gamma rays, a dry resistant mutant was obtained (Bretaudeau & Traore, 1990). Moreover, the confirmation of genetic changes by gamma ray use is possible with RAPD (Randon Amplified Polymorphism DNA) and microsatelite techniques (Ferreira & Gratapagllia, 1998. A new genetic material is obtained when a change in basic genotype occurs (IAEA, 1977).
Bretaudeau & Traore (1990) declared that mutation induction by gamma rays doses of 200 to 300 Gy presented environmental stress viability tolerance. According to Krishnamurthy et al. (2007), sorghum varieties has been considered relatively more salt tolerant than maize and has the potential as forage plant for salinity areas. According to Zhu (2001) and Geressu & Gezaghene (2008), the plant performance on salinity conditions is related to the expression of several genes and each botanic species presents different tolerance degrees to NaCl which depends on the quality and dissolved salt concentration, climatic factors, water absorption and vegetal nutrition. Promising results were obtained for salinity tolerance in sunflower, banana and rice from gamma rays (Omar et al., 1993).
It is important to define which gamma ray dose is to be utilized to promote favorable changes or mutations. The gamma ray is used in DNA recombinant, clonage, genetic maps, and transgenic research (Irfaq & Nawab, 2003). In this work sorghum plants were evaluated for high salinity tolerance through electrical conductivity levels and gamma ray doses.
Material and Methods
An experiment was carried out at the nuclear energy department of the Federal University of the State of Pernambuco jointly with IPA (Agricultural Research Corporation of the State of Pernambuco) support. The research actions were developed during the year of 2004 under greenhouse conditions (at a temperature of 29 – 35 °C, minimum-maximum and a relative humidity of 80 – 89%, minimum-maximum) during 40 days. The sorghum varieties (V) utilized was: V1-IPA 467-4-2 (variety of sweet stalk, height more than three meters); V2 –IPA 02-03-01 (variety of dry stalk, height more than three meters) and V3 IPA Sudan 4202 (herbaceous variety, early maturation, dry stalk and height of 170 cm). V1 and V2 varieties are the Sorghum bicolor species. V3 is the Sorghum sudanense species.
The seeds were submitted to doses of gamma rays from 60Co source (Cobalt Irradiator, Radionics Laboratory, Scott Plains, New Jersey, USA, dose of 13 Gy.h-1). The gamma radiation doses utilized were: 0 (zero); 450; 500 and 600 Gy. Each experimental unit was a pot with volume capacity of three liters of soil. The physical aspects of the substrate were characterized and analyses were done in the IPA Laboratory unit, according to 1002/ 2002 N Analyses bulletin. The requirement of fertilization and lime application were addressed according to laboratory analyses bulletin recommendation. Available soil water content was maintained to addressing the plants’ demands during the experimental period.
The salinity levels were preliminarily adjusted and defined by incubation test, carried out before beginning this activity. The salinity levels were: 0 (zero); 15 and 30 dSm-1.
Eight seeds were sown in each pot. Ten days after emergence, seedlings were thinned to the four
most vigorous plants. The NaCl addition was performed 15 days after sowing.
A randomized complete block design was used, with three replications. The treatments were arranged in a 3 x 3 x 4 factorial: three sorghum varieties (V1, V2 and V3) x three salinity levels (0, 15 and 30 dSm-1) x four gamma radiation doses (0, 450, 500 and 600 Gy).
The variables observed in the sorghum variety evaluations were: a) Final count – surviving plant numbers on harvest point. The final count was performed at 40 days after seedlings emergence; b) Score of damage caused in the plants – the grading scale used was of 1 to 5, according toTabosa (1982). Score 1 - damage absent; Score 2 – plant with until 25% of the foliage affected; Score 3 - burnt on top with 26-50% of the foliage affected (Chorosis and/ or necrosis of the leaf tissue); Score 4 – plant with 51 – 75% of the leaf tissue; Score 5 – plant with 76% or more of foliage affected (burn, chlorosis and/ or necrosis of burnt leaf tissue, stalk lodging with wilt presence or absence, progressive damage until death plant stage); c) Electrical conductivity of the soil saturated extract (EC) – obtained from levels preliminarily adjusted of 0, 15 and 30 dSm-1, soil samples being collected in each pot after harvesting plants. The utilized methodology was described by Richards (1974); d) Genetic change identification in the sorghum varieties evaluated (control variety and irradiated varieties) - at these stage molecular markers type microsatellite SSR (simple sequences repeated) were used. These results were obtained by comparing genomic DNA from sorghum cultivars according to the following points: plants obtained from no irradiated seeds and plants obtained from 450Gy dose on 30 dSm-1. The methodology utilized in these determinations is according to Ferreira & Grattapaglia (1998). For DNA extraction the CTAB (cetyltrimethylammonium bromide) was used. After
DNA quantification, PCR (Polimerase Chain Reaction) was used with microsatellite primer. e) Plant survival (Surviving plants) selection and evaluation – after the experimental period the occurrence of remaining plants was observed (from submitted CE of 30 dSm-1 and gamma radiation dose of 450 Gy). These plants were transplanted to a definitive local (nursery bed for plants) to future genetic seed yield. The variance and regression analyses were carried out. The regression analysis was carried out when detected significant interaction between sorghum variety, salinity levels or gamma rays dose.
Results and Discussion
The variance analysis overall results with mean square values and variation coefficient are shown in Table 1.
TABLE 1. Variance analysis results – mean square values to final stand1, score for plant damage 2 and dry
matter ash.
Final stand count - The number of living plants is show 40 days after emergence for V1, V2 and V3 varieties in presence of gamma radiation,
independently of salinity levels (Table 2). The variance analysis detected that gamma rays doses and sorghum varieties interaction was significant. The salinity levels and sorghum varieties interaction was not significant (P<0.001, F- test).
In radiation absence, plants of V1 and V2 varieties presented complete stand, above four plants per pot. These values above four plants (5.2 and 4.4) correspond to new tiller appearing, that happened during plant development. With an equivalent dose of 450 Gy, the varieties V1, V2 and V3 plants presented survival. However, the V1 variety showed more plants per pot number (3.8 plants/pot) when compared to V2 and V3 varieties. In addition, considering a 0-450Gy dose interval, a stand reduction of V1 of around 27% was observed. The stand reductions were 14, 12 and 15%, respectively.
In this aspect it is important to point out variety. The plant radiosensitivity also varies between botanic species and varieties. In addition, Table 2 shows that
Mean square Variation source Freedom
degree Final stand Score Dry matter ash
Sorghum varieties (SV) 2 7.96** 2.6** 30.87**
Salinity levels (SN) 2 0.02NS 1.7* 220.95**
Gamma rays dose (GR) 3 4.20** 23.5** 2.13ns
SV x SN 4 0.25NS 2.03** 10.65** SV x GR 6 0.67** 0.85NS 1.41ns SN x GR 6 0.08NS 0.75NS 2.56ns SV x SL x GR 12 0.06NS 2.12** 6.45ns Blocks 12 0.08NS 2.06** 29.23** Residue 70 0.13 0.41 3.19 Total 107 - - -Variation coefficient (%) - 23.9 15.3 17.9
NS – Non significant; * Significant (p<0,05); ** Significant (p<0,01); 1 final stand – surviving number of plant per pot
[transformed (X + 1) ½ for variance analysis]; 2 note – score to salinity and radiosensitivity symptom (note 1- damage
for V1, V2 and V3 plant varieties, when submitted to 500 and 600Gy radiation dose, the development was interrupted and they died despite inicial survival. Considering 0-600 Gy interval, it was observed that V2 and V3 plant varieties presented more reduction than V1 variety. The interaction between final stand (plant number/pot) and gamma rays dose was observed, independently for salinity levels. The 450 Gy gamma radiation dose was characterized as a dose limit for radiosensitivity, considering V1, V2 and V3 varieties. Irfack & Nawab (2003) report on wheat varieties, at dose limit of up to 400 Gy, where 20% surviving was obtained.
TABLE 2 . Average result of final stand (surviving number of plants per pot) of sorghum varieties submitted
to gamma radiation doses.
Score of damage caused in the plants by salinity by scale of 1 to 5 - The variance analysis detected a significant interaction in presence of salinity levels and gamma radiation doses (P<0.001, F- test) for V2 and V3 variety. This interaction was not significant (salinity levels and gamma radiation) to this variable in the V1 variety. The only significant variation source for V1 variety was gamma rays doses (Table 3). When the damage levels occurred by plant exposition to salinity and radiosensitivity the plants presented a notable average of more than 4.5, pointing out the following points: the plants presented
severe and irreversible damage. There was a damage evolution tendency in plants until death; in this phase the plant damage reached more than 75% in the aerial part.
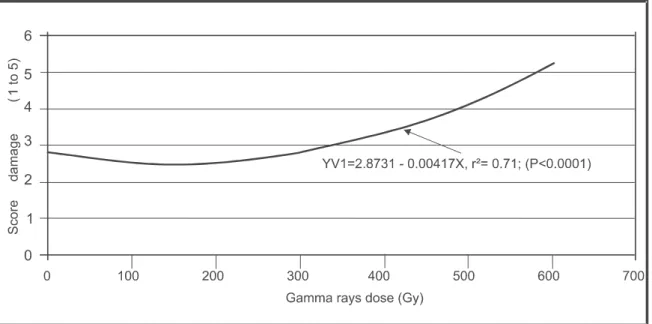
The average score performance of V1 plant variety to damage is shown by gamma radiation doses, not considering the salinity levels (Figure 1). Plant survival separation by salinity levels and gamma radiation doses were indicated. Score > 4.5 indicate plant death. For gamma radiation irrespective of salinity level, surviving plants were detected, but 500 and 600 Gy point out that all plants died. It is important to say that the radiosensitivity aspects occurred in different forms between botanic species
and varieties, cultivars, etc. These results indicate that the dose limit could have been exceeded, causing plant death. The gamma radiation doses were more than those used (300 Gy) by Bretadeau & Traore (1990). Thus, Khan et al. (2003) reported that 300Gy dose gamma radiation to promote inhibitory effects is well characterized in the barley varieties in initial phase of development. Thus, the optimal gamma radiation dose is the one that promotes effects on yield components. In this context, according to IAEA (1999), the maximum variation of quantitative characters can show the mutation stability in
Gamma Radiation (Gy) Sorghum Variety
0 450 500 600 Function
V1(467-4-2) 5.2a 3.8a 3.1a 1.1a 2nd degree(1)
V2(02-03-01) 4.4a 0.6b 0.2b 0.0b Lineal(2)
V3(Sudan 4202) 0.9b 0.2b 0.0b 0.0b Lineal(3)
Average in column followed by same letter do not differ significantly among themselves by Tukey test (p<0.05); data transformed in (x+1)1/2 to statistic analysis; (1) Y = 2.491128 + 0.0028016X – 0.00000755X2 ; dy/dx = 185; y= 2.75; r2 = 0.99; (2) Y = 2.326919 – 0.0023336 X; r2 = 0.99 (p< 0.000001); (3) Y = 1.389065 – 0.0006912 X; r2 = 0.97 (p< 0.01)
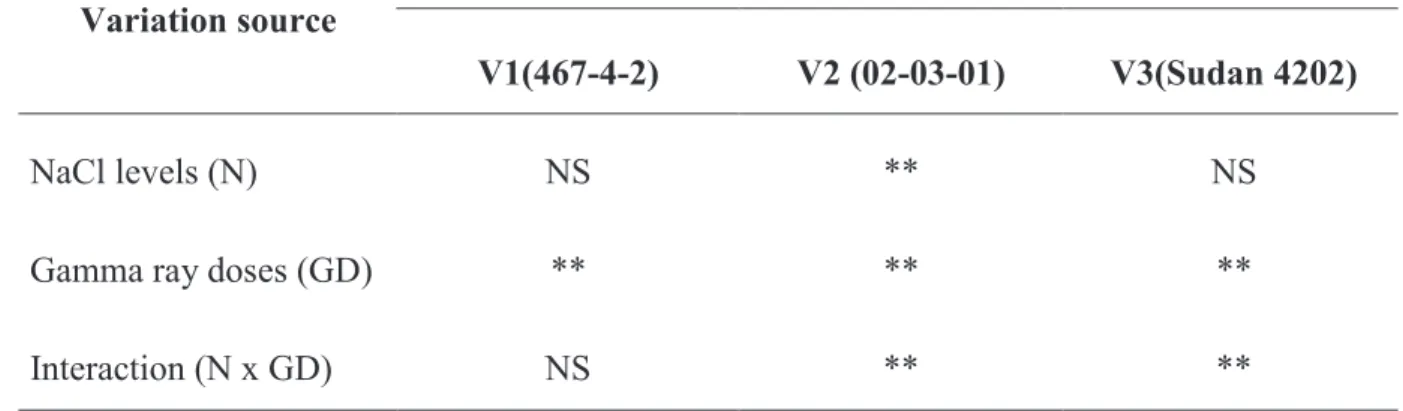
TABLE 3. Statistical significance by “F” test to variation source of the final score to salinity and
radiosensitivity symptom – V1, V2 and V3 sorghum varieties. subsequent generations. The V1 variety average score
of damage by gamma rays dose presented quadratic performance. According to 2nd degree equation, 450 Gy dose is the limit for radiosensitivity and salinity resistance of genotypes selection. From the point of minimum (defined by dose of dy/dx = 152 Gy and score damage – 2.5) to dose limit (450 Gy and score 3.1), there was an enhancement of 0.2 for each 100 units of gamma radiation. In addition, from the dose of 450 Gy to 500 Gy (defined by note 5.0 as lethal dose for plants) the enhancement was of 3.8 for each 100 units of gamma radiation.
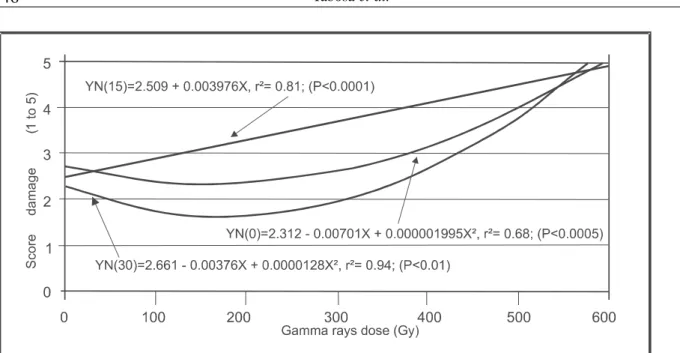
Results from the V2 sorghum variety plants submitted to gamma radiation in presence of salinity levels are observed in the Figure 2.
In absence of radiation, plants with normal survival (scores of 2.3 to 2.6), independent of salinity level utilized, were observed.
When the plants were submitted to gamma radiation of 500 and 600 Gy, they presented severe damage and death. In this gamma radiation dose damage score to all plants was 5, except to plants at salinity level of 30 dSm-1 and gamma radiation of 500 Gy (score of 4.3). However, these plants only survived for a short period of time. Independently of
salinity level, gamma radiation dose of 450 Gy was characterized as surviving plant limit. At this dose there was no plant death. The rates were 3.6 and 3.3 in presence of salinity levels of 15 and 30 dSm-1, respectively. The V2 plant variety score damage by gamma rays dose of 450 Gy and salinity level of 30 dSm-1 was of 3.3. This performance was described by 2nd degree equation. Performance V
2 variety when submitted at salinity level of 30 dS.m-1 was shown by equation that the minimum point was dy/ dx = 143Gy. In this gamma rays dose, the damage score was 2.7. In addition, with gamma radiation dose of 450 Gy, the score was of 3.3. This score
presented an enhancement of 22% when compared with 2.7, obtained on 0.0 dS.m-1 salinity level.
The results obtained for V 3
plant varieties are shown in Figure 3. In the absence of radiation, low damage (up to score 3) was detected. This damage did not present interference on plant survival, mainly at salinity levels. Regression study revealed that salinity absence occurred at an effective level of 0-600 Gy interval. It was observed that some plants survived simultaneous exposure to gamma radiation NS – non significant; ** (P< 0.01)
“F” test for final to damage score/sorghum varieties Variation source
V1(467-4-2) V2 (02-03-01) V3(Sudan 4202)
NaCl levels (N) NS ** NS
Gamma ray doses (GD) ** ** **
doses of 450 Gy and 15 and 30 dSm-1 salinity levels. Plant selection was performed using gamma radiation (450 Gy) and salinity level (30 dSm-1) interaction. No live plants were observed when they were submitted to gamma radiation of 500 and 600Gy. These doses of above 450 Gy are beyond radiosensitivity ability to variety V3 plants. With salinity level of 15 dS.m-1 was presented quadratic performance. The inflexion point was obtained with dy/dx = 142 Gy. In this point the score for plant damage obtained with 450 Gy gamma radiation dose was of 3.0. This score presented an enhancement of 30% when compared with 2.3(note equivalent to minimum point).
Electrical conductivity of soil saturation extracts (EC) - The results of the EC variable observed (in each soil pot by sampling each one of the 108 experimental units) were obtained in laboratory analysis. The EC average obtained and estimated data from regression equation are shown
in Table 4, when compares with defined level of 0, 15 and 30 dSm-1.
The EC level average obtained by laboratory analysis and estimated data from regression equation are shown in Table 4, when compared with defined level of 0, 15 and 30 dS.m-1. These results were obtained from previously defined levels of soil incubation test (0, 15 and 30 dSm-1). Thus, for EC defined as 0 (zero) dS.m-1, there is an equivalent value that was measured as 1.58 dS.m-1. This value is probably due to natural salt quantity previously present in the substrate. These determinations were performed according to the Richards (1974) methodology. For the equivalent values of 14.56 and 26.34, there probably occurred additional NaCl quantitative adjustment to pot, even considering instrumental and experimental error. The regression equation probably uniformed the data, from EC defined/ EC measured relation.
FIGURE 1. Average score damage (1 – damage absence and 5 – plant with more than 75% damage) to
FIGURE 3. Average score damage (1 – damage absence and 5 – plant with more than 75% damage) to
V3 (sudan 4202) plant variety by salinity levels (N) 0,15 and 30 ds/m and gamma radiation dose.
FIGURE 2. Average score damage (1 – damage absence and 5 – plant with more than 75% damage) to
Evaluation and selection of plants to salinity resistance at EC = 30 dSm-1 level and 450 Gy gamma radiation dose - Consolidated data of plant evaluation and selection are shown in Table 5. In this evaluation only the surviving and remaining plants that were submitted to 15 and 30 dSm-1 salinity level and gamma radiation dose of 450 Gy were considered. With the above combination it was possible to perform the selection of remaining plants. It is important to point out that these plants, selected after experimental period, recovered normal development. The damage observed in these plant selections were 3.1 (|Figure 1) to V1, independently of salinity level; 3.6 and 3.3 to 15 and 30 dSm-1 salinity level, respectively to V2 variety (Figure 2) and 3.0 and 4.3 to 15 and 30 dSm-1 salinity level, respectively to V3 variety (Figure 3).
TABLE 4. Salinity level (dS.m-1), obtained in and estimated by equation.
EC Level Defined
(dS.m-1) EC Level Measured(dS.m-1) EC level estimated
(1) (dS.m-1) 0 1.58 1.78 15 14.56 14.16 30 26.34 26.54 (1)Y = 1.786111 + 0.8251852 X ; r2 = 0.99; (P<0.00001)
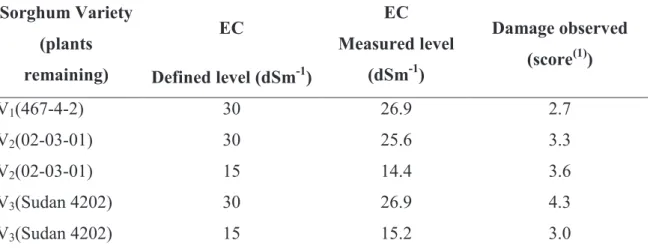
TABLE 5. Consolidated evaluation of surviving plants from sorghum varieties from 15 and 30 dS.m-1 salinity level and 450Gy gamma radiation dose.
The plant selection that presented less damage, when compared with other varieties of plants, was from V1 with score of 2.7. The greatest damages observed were in the variety V3 plants, when submitted to 30 EC dS.m-1 salinity level. In these plants, the score damage was 4.3 that continued until 75% of the plant aerial part of was affected. In this condition, the few surviving plants recovered normal development. In addition, according to Amzallag et al. (2005), the adaptation of sorghum to high salinity result from a modulation of genome expression occurring during exposure to non-lethal NaCl concentrations. These results agree with Trindade et al., (2006) where they relate that genetic variability is also expressed by different degrees of salinity tolerance among botanical species. It is important to say that sorghum species are considered
Sorghum Variety (plants remaining) EC Defined level (dSm-1) EC Measured level (dSm-1) Damage observed (score(1)) V1(467-4-2) 30 26.9 2.7 V2(02-03-01) 30 25.6 3.3 V2(02-03-01) 15 14.4 3.6 V3(Sudan 4202) 30 26.9 4.3 V3(Sudan 4202) 15 15.2 3.0
moderately salinity tolerant and that their tolerance characteristics are related to morphologic and physiological differences presented by plants under abiotic stress (salinity or water stress). Others considerations about these surviving plants were reported by Trindade et al. (2006), where the exclusion or retention of ions observed in stressed plants of sorghum (CSF 18 IPA variety) produced leaf dehidratation. This fact is more efficient mechanism of stress acclimation than the excessive accumulation of ions in leaf tissue .
It is important to point out that these remaining and survivining plants after experimental period were transplanted to definitive nursery bed plant locals. The plants in place were developed until seeds
reached viable production stage.
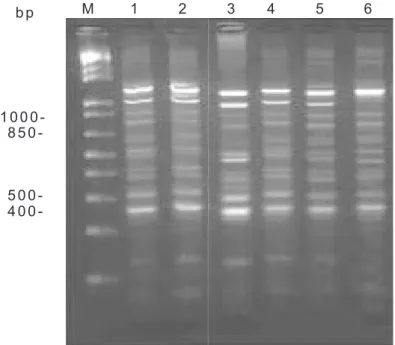
Genetic change identification in the sorghum varieties - The identification of possible genetic changing was performed in the remaining sorghum plants from three varieties. The evaluation was done by comparing the plants in presence and absence of gamma radiation dose of 450 Gy, after surviving salinity level of 30 dSm-1.The genetic marker utilized was microsatelite type SSR (Simple Sequence Repeated). Thus, considering observation mode of the molecular polymorphism, the genetic analysis studies a specific region of amplification that contains a repeated sequence (Ferreira & Grattapaglia, 1998), where the main ones were “primer” 5L and 6R (Figure 4).
FIGURE 4. Standard band amplification products with microsatellite SSR markers in different sorghum
varieties plants submitted to gamma radiation dose of 450 Gy. M – Marker of molecular weight (1 kb plus DNA Ladder); 1-6: amplification product with “primer” 5L 6 R in the different standard band: 1- V1 467-4-2 (zero Gy); 2 - V1 467-4-2 (450 Gy); 3- 02-03-01 (zero Gy); 4 - V2 03-03-01 (450 Gy); 5 - V3 Sudan 4202 (zero Gy); 6 - V3 Sudan 4202 (450Gy).
M 1 2 3 4 5 6 b p 1 0 0 0 8 5 0 5 0 0 4 0 0
-Considering that gamma radiation present interference directly on DNA, the followings points are important: there is difference between genetic material control ( without radiation) and irradiated with 450 Gy of 60Co; V
1 and V2 varieties that were submitted to 450 Gy gamma radiation presented less variation (its amplification profile) in relation to their respective controls than V3 plants under same conditions; this kind of change detected in these varieties can promote the appearing new forms of genes that can probably be responsible for genetic variability. In addition, the plant performance on saline conditions was also reported by Zhu (2001), who point out that the expression of different genes shows different tolerance to NaCl.
Conclusions
1. Electrical conductivity levels of the soil saturated extract of 14 to 26 dS.m-1 can be used to select sorghum genotypes resistant to salinity;
2. Plant count reduction due to higher salinity damage rate allows to distinguish sorghum genotypes that are sensitive from those that are resistant to soil salinity;
3. Gamma radiation dose of 450 Gy promote genetic change in sorghum variety plants V1 – 467-4-2, V2 – 02-03-01 and V3 – Sudan 4202; 4. These genetic changes between irradiated plants with 450 Gy of gamma radiation and non irradiation plants are characterized by SSR microsatellite type molecular markers;
5. More genetic change in plant variety V3 – Sudan 4202 were detected by molecular markers than in plant varieties V1 – 467-4-2 and V2 – 02-03-01, from DNA profile amplificance.
References
AHLOOWALIA, B. S.; MELUZYNSKI, M.; NICHTERLEIN, K. Global impact of mutation-derived varieties. Euphytica, Wageningen, v. 135, p. 187-204, 2004.
AMZALLAG, G. N.; LERNER, H. R.; POLJAKOFF-MAYBER, A. Induction of Increase Salt Tolerance in sorghum bicolor by NaCl pretreatment. Journal of Experimental Botany, London, v. 41, n. 1, p. 29-34, 2005.
ASSOCIAÇÃO PAULISTA DOS PRODUTORES DE SEMENTES E MUDAS. Grupo Pró-Sorgo. Sorgo: área plantada – safra 2004/2005. Campinas, 2005. Disponível em: http:// www.apps.agr.br/files/D_Estat. Acesso em: 8 jul. 2005.
ASSOCIAÇÃO PAULISTA DOS PRODUTORES DE SEMENTES E MUDAS. Grupo Pró-Sorgo Evolução da área e produção
do sorgo no Brasil – Atualização em 15/06/2007.
Campinas, 2007. Disponível em: (http:// www.apps.agr.br/ dado-estatísticos/). Acesso em: 12 abr. 2007.
BRETAUDEAU, A.; TRAORE, B. M. Use of mutations breeding in West African Sorghum (Sorghum bicolor (L.) Moench.) improvement. In: INTERNATIONAL SYMPOSIUM ON THE CONTRIBUTION OF PLANT MUTATION BREEDING TO CROP IMPROVEMENT, 1990. Vienna. Symposium… Vienna: IAEA-SM, 1990. v.1. p. 463-467.
FERREIRA, M. E.; GRATTAPAGLIA, D.
Introdução ao uso de marcadores moleculares em análise genética. 3. ed. Brasília:
EMBRAPA-CENARGEN, 1998. 220 p. (EMBRAPA – CERNAGEM. Documento, 20).
GERESSU, K.; GEZAGHEGNE, M. Response of some lowland growing sorghum (Sorghum bicolor L. Moench) accession to salt stress during germination and seedling growth. African Journal
of Agricultural Research, Nairobi, v. 3, n. 1, p.
44-48, 2008.
HEINZE, B. C. L. B. A importância da agricultura
irrigada para o desenvolvimento da região nordeste do Brasil. 2002. 70 f. Monografia (MBA
em Gestão Sustentável da Agricultura Irrigada) – Ecobusiness Scholl, Fundacao Getúlio Vargas, Brasília, DF. Disponível em: http://www.iica.org.br/ D o c s / P u b l i c a c o e s / P u b l i c a c o e s I I C A / BraulioHeinze.pdf Acesso em: 6 jul. 2005.
INTERNATIONAL ATOMIC ENERGY AGENCY. Manual on mutation breeding. 2nd.ed. Vienna: IAEA/FAO, 1977. 228 p. (IAEA. Technical Report Series, 119)
IRFAQ, M.; NAWAB, K. A. Study to determine the proper dose of gamma radiation for underling beneficial genetic variability in bread wheat (Triticum aestivum L.). Asian Journal of Plant Science, Faisaladad, v. 2, n. 13, p. 999-1003, 2003.
KHAN, K.; IQBAL, M.; AZIM, A.; AHMAD, B.; KARIN, F.; SHER, H. Effect of Gamma Irradiation on Barley (Hordeum vulgare L.). Pakistan Journal
of Biological, Prisabak, v. 6, n. 19, p. 1695-1697,
2003.
KRISHNAMURTHY, L.; SERRAJ, R..; HASH, C.T.; DAKHEEL, A.J.; REDDY, B.V.S. Screening sorghum genotypes for salinity biomass production.
Euphytica, Wageningen, v. 156, p. 15-24. 2007.
MUNNS, R.; HUSSAIN, S.; RIVELLI, A.R.; JAMES, R. A.; CONDON, A. G.; LINDSAY, M. P.; LANGUDAH, E. S.; SCHACHTMAN, D. P.; HARE, R. A. Avenues for increasing salt tolerance of crops, and the role of physiologically bored selection traits. Plant and Soil, The Hague, v. 247, p. 93-105, 2002.
OMAR, M. S.; YOUSIF, D. P.; AL-JIBOURI, A. J. M.; AL-KAWI, M. S.; HAMEED, M. K. Effects of gamma rays and sodium chloride and cellular constituents of sunflower (Helianthus annuus L.) callus culture. Journal of Islamic Academy of
Science, Baghdad, v. 6, n. 1, p. 69-72, 1993. Np.
Disponível em: < http://www.medicaljournal-ias.org/ 6_1/Omar.pdf>. Acesso em: 14 abr. 2005.
RICHARDS, L. A. Diagnostico e rehabilitación
de suelos salinos e sodios. Washington: Limura,
1974. 172 p.
TABOSA, J. N. Teste de tolerância à salinidade
em gramíneas forrageiras tropicais. 1982. 135
f. Dissertação (Mestrado) – Universidade Federal Rural de Pernambuco, Recife.
TRINDADE, A.R.; LACERDA, C. F. de; GOMES FILHO, E.; PRISCO, J. T.; BEZERRA, M. A. Influência do acúmulo e distribuição de íons sobre aclimatação de plantas de sorgo e feijão-de-corda, ao estresse salino. Revista brasileira de
Engenharia Agrícola e Ambiental, Campina
Grande, v. 10, n. 4, p.804-810, 2006.
ZHU, J. K. Plant Salt Tolerance. Trends in Plant