Online Exclusive
Distribution Centre:
impact on a Portuguese
retailer
Tiago Trovão
Dissertation written under the supervision of Professor Laura
Wagner
Dissertation submitted in partial fulfilment of requirements for the MSc in
Business, at the Universidade Católica Portuguesa, 2019
i
Abstract
:English Version
Title
Author – Tiago Miguel Martins Trovão
Keywords – Retail, online orders, logistics, distribution centres, distribution strategy
Objectives – To perform a comparative statistical analysis between two logistic methods to
fulfil online orders (exclusive distribution centre and store) and compare performance indicators.
Method – Analysis of an extensive dataset, composed by orders placed during a one-year
period, with the purpose of finding significant differences between methods.
Findings – This study found that (1) fulfilling online orders through an exclusive distribution
centre is associated with a superior success rate; (2) customers served by the exclusive distribution centre order more often; (3) customers served by the exclusive distribution centre order more products on next orders than customers served by the store.
Conclusions - Investing in an exclusive distribution centre to fulfil online orders would result
in higher success rates and in a positive evolution of orders per customer, and products per order.
Portuguese Version
Tema
Autor – Tiago Miguel Martins Trovão
Palavras-chave – Retalho, compras online; logística; centros de distribuição, estratégias de
distribuição
Objetivos - Realizar uma análise estatística comparativa entre dois métodos logísticos para
satisfazer encomendas online (centro de distribuição exclusivo e loja) e comparar indicadores de desempenho.
Metodologia – Análise de uma extensa base de dados, composta por encomendas efetuadas
durante o período de um ano, com o propósito de encontrar diferenças significativas entre métodos.
Resultados – Este estudo concluiu que (1) satisfazer encomendas online através de um centro
de distribuição exclusivo leva a uma taxa de sucesso superior; (2) clientes servidos pelo centro de distribuição exclusivo encomendam com mais frequência: (3) clientes servidos pelo centro de distribuição exclusivo compram mais produtos em encomendas seguintes que clientes servidos por loja.
Conclusões – Investir num centro de distribuição para satisfazer encomendas online resultaria
em taxas de sucesso mais elevadas e numa evolução positiva do número de encomendas por cliente e produtos por encomenda.
ii
Table of contents
Abstract ... i
Table of contents ...ii
Table of figures ... iii
1. Introduction ... 1
2. Theoretical Framework ... 3
2.1. Background ... 3
2.2. E-commerce... 4
2.3. Online shopping behaviour ... 4
2.4. Logistics of online retailers ... 5
2.5. Logistics comparison ... 6
2.6. Success in e-commerce ... 8
2.7. Order Fulfilment ... 9
2.8. Online exclusive distribution centres ... 10
3. Problem Statement ... 12
3.1. Institutional Setup ... 12
3.2. Hypothesis development ... 14
3.2.1. Order fulfilment ... 14
3.2.2. Repurchasing ... 15
3.2.3. Revenue – Basket size and value ... 16
4. Methodology ... 18
4.1. File Description ... 18
4.2. Data cleaning stage ... 18
4.3. Manipulating the data ... 19
4.4. Descriptive analysis ... 20
4.4.1. Allocation of orders ... 22
iii 4.4.3. Order composition ... 23 4.4.4. Basket Size ... 25 4.4.5. Basket value ... 25 4.5. Model development ... 27 5. Results ... 30 5.1. Picking Success ... 30 5.2. Repurchase ... 31 5.3. Basket Size ... 32 5.4. Basket Value ... 33 6. Analysis ... 34 7. Conclusion ... 36 7.1. Managerial relevance ... 36 7.2. Academic Relevance ... 36 7.3. Limitations ... 37 7.3.1. Randomised experiment ... 37 7.4. Future research ... 38 8. Appendices ... 39
8.1. Appendix 1 – FCT_OrderProducts representation – original file ... 39
8.2. Appendix 2 – FCT_Orders representation – original file ... 39
8.3. Appendix 3 – WFO file representation ... 39
8.4. Appendix 4 – Customers file representation ... 40
9. Bibliography ... 41
Table of figures
Figure 1: Traditional brick-and-mortar structures serve online orders ... 5Figure 2: Online distribution centre (DC) for online orders ... 6
iv
Figure 4: Summary of possible logistic configurations. ... 7
Figure 5: Order fulfilment and Consumer behaviour ... 9
Figure 6: In store order arrangement ... 12
Figure 7: Order arranged at the Dark Store ... 13
Figure 8: Untreated files information ... 20
Figure 9: Descriptive statistics of variables metrics, per customer. ... 21
Figure 10: Descriptive statistics of variable metrics, per order. ... 21
Figure 11: Proportion of orders picked in one or more stores, by Store ID. ... 22
Figure 12: Orders, by Store ID. ... 23
Figure 13: Order composition by Store ID. ... 23
Figure 14: t-test results for the categories that compose orders from the Dark Store (either picked exclusively in it or in more than one store). ... 24
Figure 15: Basket size by Store ID. Before (left) and after (right) orders picked in more than one store have been removed. ... 25
Figure 16: Basket Value by Store ID. Before (left) and after (right) orders picked in more than one store have been removed. ... 26
Figure 17: Multiple linear regression with picking success as the dependent variable. ... 30
Figure 18: Linear regression with orders per customer as the dependent variable. ... 31
Figure 20: Linear regression with basket size as the dependent variable. ... 32
Figure 19: Linear regression with basket value as the dependent variable. ... 33
1
1. Introduction
Online shopping is becoming every year more popular, not only for tech products or apparel but for groceries as well. Being able to receive at home what would typically require a trip to the supermarket, extensive product searching and queuing for the checkout is appealing for many people.
When we, as customers, place our order online at a brick-and-click retailer’s website one of two things can happen:
• Our order could be picked1 and arranged for delivery at a regular store, the same store
where we could pick the products out of their shelves ourselves.
• Or, that same order, could be picked1 and arranged at a specialised facility that exists
with the sole purpose of serving online customers.
Does the distribution strategy chosen by the company have an impact on consumers ordering behaviour?
To answer this question, this study partnered with a Portuguese retailer who follows the two different strategies. While most orders are picked1 in regular stores, a considerable investment
was made to create an online exclusive distribution centre (DC), and this DC serves some orders. Therefore, the primary goal of this study is to investigate the impact of order arrangement logistics on performance by comparing the two distributions strategies abovementioned.
There are many published papers and studies regarding logistics for online retailers. Accordingly to the literature, and following the simple rationale that specialisation increases efficiency and yield better results this study aims to find if customers are positively impacted when their order is picked1 in the online exclusive DC.
To perform this study data from a one-year period was analysed. This data corresponds to close to 500.000 orders placed by 71.000 different customers, in total more than 14.000.000 products were sold.
After a thoughtful data cleaning and manipulation, the first step taken was to understand the impact that arranging orders in the online exclusive DC has on order fulfilment, measured
2 through the variable picking success. Picking success is a metric used to evaluate the success of the arrangement of the order, if every product ordered is present in the correct quantity and brand, then 100% success was achieved. Secondly, this study ought to find how customers respond to being served by this online exclusive DC: Does the frequency of purchase increase? Do customers buy more items in the following purchases? Does the basket value increase? In general, the way a company implements its distribution strategy has a notable impact on consumer retention. This study was able to prove that when orders are arranged at the online exclusive DC, order fulfilment is improved (picking success rates present better results), customers order more often and order more products in their following orders. No significant results were obtained regarding the evolution of basket value.
This master thesis aims at drawing insights and extracting conclusions from an E-commerce data-set from one of the biggest e-retailers in Portugal. The information obtained from the study of such datasets can be a crucial input in the decision-making process of retail firms. The results here obtained giving rise to critical managerial insights that could help to improve customer experience.
3
2. Theoretical Framework
2.1. Background
In 2017, an estimate of 1,66 billion people purchased online and B2C (Business-to-Customer) e-commerce amounted close to 2 trillion euros2. This figure is expected to rise to 3,8 trillion
euros by 2021 (Statistia, 2017).
In a global perspective, there are a lot of factors that enable us to, with some degree of certainty, assume that the near future is a promising time for e-commerce.
Demographic indicators show that during the past years, although at a decreasing rate, the world population has continued to increase. In mid-2017 world’s population numbered close to 7,6 billion, 10% located in Europe. Global GDP (growth domestic product) continues to increase, Europe alone corresponds to 21,8% of total world GDP and E-commerce represents 4,91% of total European GDP. While unemployment in Europe decreases, the internet penetration rate steadily increases (Eurostat, 2018; Lone, 2018; Momboisse & Ham, 2017; United Nations, 2017).
In the case of Portugal (in 2017) e-commerce amounts roughly to 5 billion euros1 which
represents around 2,57% of GDP. Portugal has a 73,2% internet penetration rate with 36% of the population buying online. From 2016 to 2017 e-commerce in Portugal presented a growth rate of 23,32%, corresponding to the second highest rate in all of Europe (INE, 2017; Lone, 2018).
Many indicators allow understanding that Portugal is fertile ground for the e-commerce sector and that investing in online platforms is an important form of expansion for Portuguese firms (Abraham, Lone, & Couenberg, 2017; INE, 2018; Statista, 2018).
4
2.2. E-commerce
E-commerce can be defined as a business model that can be used in every major market segment: business-to-consumer, consumer, business-to-business, or consumer-to-business. Regardless of the market segment it serves, E-commerce always uses an electronic network, normally the internet (Frankenfield, 2017).
There are firms that use E-commerce to enhance their physical market position, by associating their pre-existing brick-and-mortar stores with an online presence (brick-and-click); on the other hand there are firms whose business model is primarily intended to be exclusively online and these rarely transpose into physical businesses (Burt & Sparks, 2003; Rao, Goldsby, & Iyengar, 2009).
Some authors argue that brick-and-click retailers enjoy the advantage of already having in place logistic systems and considerable experience that allows them to exploit synergies between online and traditional operations (Maltz, Rabinovich, & Sinha, 2004; Porter, 2001). However other authors have shown that pure online retailers demonstrate superior performance, enjoying largely recognised success; companies such as Amazon are a clear example of this (Rabinovich & Bailey, 2004).
2.3. Online shopping behaviour
In published literature, two main approaches to analysing online consumer decisions can be found. The first is associated with the rationality and states that consumers want to maximise the satisfaction of their utility function (in economic terms), they look for logical arguments to justify their choices. The second is quite the opposite, being associated with the irrationality of people’s decisions, where factors such as impulse buying, risk or access to information limit the most optimal purchase decision (Hanus, 2016).
Studies show that consumers tend to be more rational towards goods of highest interest and irrational, impulsive and emotional when purchasing fast-moving consumer goods as these have shorter life-cycles and impose less of a commitment (Karpińska-Krakowiak, 2014). Shopping in brick-and-mortar stores satisfies need beyond the need to buy provisions while ordering groceries and other fast-moving consumer goods online does not satisfy as many needs. Physical activity and social interaction needs are not satisfied. And there is a lower
5 probability of purchasing new products (groceries and household items) because there is no chance to taste or smell the product (Karpińska-Krakowiak, 2014).
Another interesting fact is that online baskets tend to be larger than the baskets customers buy in the store, researchers think that this fact is an indication that expectations are essentially different between the two channels (Saskia, Mareï, & Blanquart, 2016)
Studies have attempted to characterise an e-shopper profile. As innovators, internet consumers are highly educated and have higher incomes, are less risk averse and are more impulsive than non-internet consumers (Ramus & Nielsen, 2005)
The profile of the online retail consumer is difficult to define, however, the value proposition and marketing messages should emphasise convenience, quality, assortment and price as these are attributes highly valued by consumers (Galante, López, & Monroe, 2013)
2.4. Logistics of online retailers
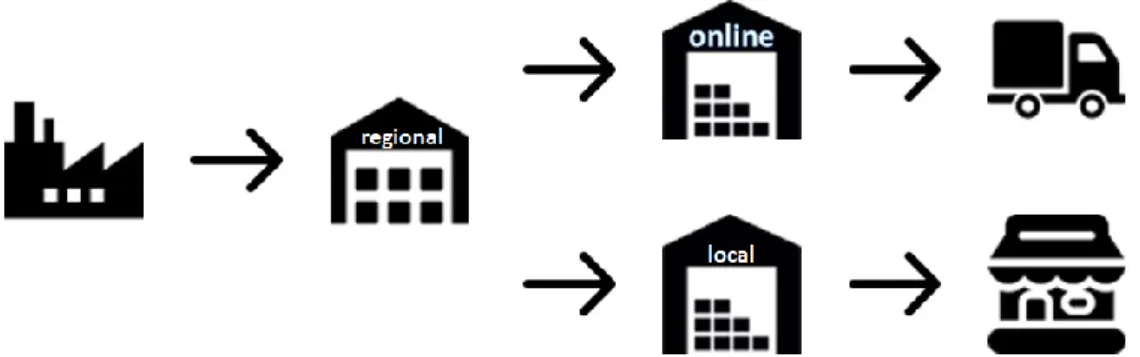
The way the supply chain is constructed has a profound impact on the overall quality of the service. When every intervenient in the chain is properly coordinated, the end result is positive. Wollenburg et Al. (2018) produced important material to understand better the possible ways of how logistics network for brick-and-click retailers could be arranged.
There are three major possible configurations:
Figure 1: Traditional brick-and-mortar structures serve online orders
Case packs are broken into units as late as possible in the supply chain, and online orders are collected in store. Products flow from distributions centres to physical stores and from there to customer’s homes. The products that compose online orders are collected out of the shelves and arranged to be home delivered or picked up in a pick-up location.
6
Figure 2: Online distribution centre (DC) for online orders
Case packs are broken into units earlier in the supply chain, and online orders are picked in the online DC. The regional DC serves both the online exclusive DC and local DC’s. The online DC is solely used to serve online customers, the local DC supplies physical stores.
Figure 3: Integrated distribution centre
Case packs are broken into customer units even earlier in the supply chain and items are stored in units. Local DC’s serve both stores and online orders. This is only feasible for small stores formats (icons made by Freepick from www.flaticon.com).
2.5. Logistics comparison
The two most common configurations are the ones this study will be comparing, the traditional brick-and-mortar structure to serve online orders and online DC for online orders.
In one hand, by using the traditional structure to serve online orders no significant investment has to be made, and as retailer firms that adopt this model are already present in many locations with their brick-and-mortar stores, there is a short delivery distance because customers’ orders are allocated to specific stores accordingly to the customers’ ZIP code. However, the assortment of products available online is limited by the shelf space at physical stores, and there is no room for virtual shelf extension. Also, as will be discussed further ahead, it is difficult to maintain accurate inventory information as there is constant competition between online and offline
7 customers. This can affect service quality and order fulfilment. With such distribution strategy, it is impossible to present stock information to customers before order placement. Finally, upscaling is compromised by the physical constraints of brick-and-mortar stores that ultimately limit the ability to fulfil increasing online orders (Nguyen, de Leeuw, & Dullaert, 2018; Wollenburg, Hübner, Kuhn, & Trautrims, 2018)
On the other hand, having an online exclusive distribution centre is only possible if an elevated investment in such structure is made. This DC should serve a large geographical area with longer distances to customers’ houses, which also translate into greater delivery costs. However, this strategy also yields some benefits. By serving a larger area, risk pooling effect is possible (reducing demand variability by aggregating demand across various locations), virtual shelf extension is also possible (offering a greater assortment of products online), shelf space is less expensive as these DCs can be located in the outskirts of cities, opposite to brick-and-mortar stores. Serving online orders becomes a specialised task with greater inventory control, allowing stock information to be presented before the order is placed and increasing order fulfilment and overall quality (Agatz, Fleischmann, & Nunen, 2006; Koster, 2003; Wollenburg et al., 2018)
Figure 4: Summary of possible logistic configurations.
Advantages Disadvantages
1 – Traditional brick-and-mortar structures serve online orders
No investment costs
Short distance delivery (store-home)
No virtual shelf extension Inventory inaccuracy
Upscaling compromised with increase in online volume
2 – Online distribution centre for online orders
Specialised picking of online orders Virtual shelf extension
Risk Pooling
Longer best-before dates Greater inventory control Less expensive shelf space
Bundling effects across orders for delivery
Longer distance delivery (DC – home)
Cost of the online exclusive DC
3 – Integrated distribution centre
Centralised inventory with increased accuracy
Virtual shelf extension
Specialised picking of online orders Joint transportation of order to stores or home deliveries
Feasible only for small stores Higher costs of storage
8 The present study uses data from a retailer that fits the B2C (business-to-customer) market segment. The retailer here studied adopts a mixed presence with the same brand both online and in brick-and-mortar stores. Most of its online orders are picked in store (1); however, this retailer has invested in an experimental online exclusive DC (2) with a minor difference from the model here portraited: some specific product categories of online orders are always picked in store. Orders are then combined and home delivered or picked up in store.
2.6. Success in e-commerce
There is extensive research aiming at understanding the success factors (SF) for business-to-consumer e-commerce.
Sung (2006) made an extensive summary of available literature identifying and reviewing critical SF for e-commerce. Based on this analysis, customers orientation, ease of use and variety of goods and services are evaluated as the most critical SF, other SF such as security, privacy and amount of information are also considered critical by western consumers.
Satisfaction is a consumer perception that results from an analysis of all the factors that affect the experience and is also considered a critical SF. The expectation disconfirmation theory states that there is a gap (disconfirmation) between expectation and perceived performance and that the intensity and direction of that gap determine satisfaction (Flavián, Guinalíu, & Gurrea, 2006; Khalifa & Liu, 2002).
Expectation forms the baseline that customers use to evaluate the performance of the online retailer. For positive gaps (confirmation) the higher the expectation, the higher the satisfaction, whereas low expectations are associated with reduced satisfaction (Kim et al., 2009).
Although being moderated by factors on both sides (from customers and businesses) satisfaction ultimately impacts customer loyalty and repurchase (Anderson & Srinivasan, 2003).
Different authors appoint different factors as being the most relevant inputs to satisfaction and repurchase: financial security, convenience and website design (Szymanski DM & RT., 2000), ease of use and usefulness (Devaraj, Fan, & Kohli, 2002), level of interactivity and amount of information provided (Ballantine, 2005), membership perks, membership service quality and page-loading speed (Khalifa & Liu, 2002), flexibility, technological proficiency, security,
9 customization or reversibility (Chen & Wells, 2001) or order fulfilment (Cheung, Chan, & Limayem, 2005; Koster, 2003).
DeLone and McLean (2004) updated an information systems success model previously created by the same authors where information quality, system quality and service quality input on intention to use and user satisfaction.
Kim, Ferrin and Raghav (2009) appoint trust and satisfaction as the “two Stepping Stones” of success in e-commerce. Satisfaction was found to be significantly related to e-loyalty. Trust can be defined as “a group of beliefs held by a person derived from his/her perceptions about certain attributes” (Flavián, Guinalíu & Gurrea, 2006). To guarantee that customers are satisfied, online retailers should attempt to build a positive gap between customers’ expectations and product and service performance (Khalifa & Liu, 2002)
2.7. Order Fulfilment
Order fulfilment is a construct that has to do with every activity since consumers make an online purchase until the moment the product is delivered (Pyke, Johnson, & Desmond, 2001)
It is also called e-fulfilment and is considered an essential factor that inputs on satisfaction and a critical part of consumer behaviour and therefore of online sales. (Cheung et al., 2005; Hoffman, Novak, & Peralta, 1999; Koster, 2003).
Nguyen et al. (2018) studied order fulfilment and its relationship with consumer behaviour. Behaviour was summarised as Purchase, Repurchase and Product Return whilst Inventory Management, Last-mile Delivery and Returns Management compose Order Fulfilment.
10 In the last-mentioned study, Inventory Management encompasses the stock of physical products (product availability) as well as the assortment of products and the condition of the products delivered. Most studies in this field focus on the effect of inventory management on repurchase. Returns management involves return procedure, preparation, options handling and refund. In this field authors such as Bonifield, Cole and Schultz (2010) developed a vast amount of scientific knowledge.
Last-mile delivery widely considered one of the most relevant weaknesses of online retailing. This is especially true for attended home deliveries, and this has been the cause of many delivery cost related failures. (Agatz, Campbell, Fleischmann, & Savelsbergh, 2011). Last-mile delivery comprises delivery options, handling charges, the delivery itself and order tracking. In this context, the author focuses mainly on the effect of handling charges and delivery on purchase and repurchase.
This study will focus mainly on what is part of Inventory Management.
2.8. Online exclusive distribution centres
Online exclusive DC’s are specialised and centralised units that serve online orders exclusively. They are also frequently referred to as Dark Stores, as they are similar to a regular store without the presence of customers.
Bendoly, Blocher, Bretthauer and Venkataramanan (2007) found that complete centralisation (online orders picked in online exclusive DC) or complete decentralisation (orders picked in store) is always preferable to minimise total costs. There is a threshold of online demand, as a percentage of total demand, above which centralisation is always preferable. This threshold varies accordingly to numerous factors such as total costs or number of stores. For a large number of stores, an online exclusive DC is favoured.
In the case of USA, online retailers (specifically e-grocery firms) adopt either a store-based model (1) where stores fulfil online orders or an online exclusive DC model (2) (Murphy, 2003). The same author also states that when the second option is adopted the volume of online orders is not limited as virtually no space constraints are imposed.
Koster, (2003) states that the best, most efficient solution to serve online orders is to have a dedicated warehouse (designed with these tasks in mind) as economies of scale can be achieved, there are fewer interferences with other products and larger areas can be served.
11 Online exclusive DC allow for specialised picking, reduced shelf space costs and bundling effects across orders as was discussed before. It also prevents interactions between customers and pickers which facilitates maintaining reliable inventory information, promoting accurate demand forecast hence reducing stock-outs. (Wollenburg et al., 2018).
Accurate inventory information allows for online retailers to present product availability indicators and out-of-stock information prior to order placement. Whereas if online retailers adopt non-visible policies regarding stock-outs, meaning if customers are only informed of stock-outs after the order is placed, the probability of repurchase is reduced (Nguyen et al., 2018). Accurate inventory information raises the possibility of presenting scarcity signals which are an effective tool to improve sales and profit (Wagner, Calvo, & Cui, 2018).
Furthermore, the implementations of this DC allows for automatization which increases efficiency as it reduces order preparation time and number of employees needed to prepare an order (Williams, 2018). Internal travel times can also be reduced by the implementation of systems such as pick-to-light, case-flow racks, carousels and suitable information systems (Koster, 2003).
Risk pooling is another advantage of a centralised inventory policy, by managing online orders in a specialised DC, demand variability can be reduced as that DC aggregates demand across a larger area (Agatz et al., 2006).
12
3. Problem Statement
3.1. Institutional Setup
This study could not be produced without the contribute of one of the largest retail firms in Portugal, mainly known through its Brick-and-Mortar stores but also widely recognised by its online presence. This retailer’s website offers a wide variety of products from distinct categories such as fresh products, apparel, hygiene and cosmetic, pet supplies, office material, housekeeping products amongst others.
Customers can either shop by going to the brick-and-mortar store or shop online. When customers place an order online the products that compose that order will be picked in store accordingly to the delivery ZIP code given by the customer. Orders can either be picked up in store by customers or home delivered in a scheduled period at a cost.
This retailer has 11 stores able to respond to online orders those stores are identified by the numbers: Store 3, 4, 6, 7, 8, 13, 212, 333, 460, 462 and 2594.
One of the characteristics of this platform is that it does not possess information about inventory. Customers are never given information about inventory or product unavailability; hence customers might not receive what they ordered.
After choosing the products to include in the basket, customers then place the order and determine the delivery method. After this, two things can happen depending on the ZIP code of the customer.
Either that order is picked in one of the ten stores prepared for this task, arranged and delivered.
Figure 6: In store order arrangement
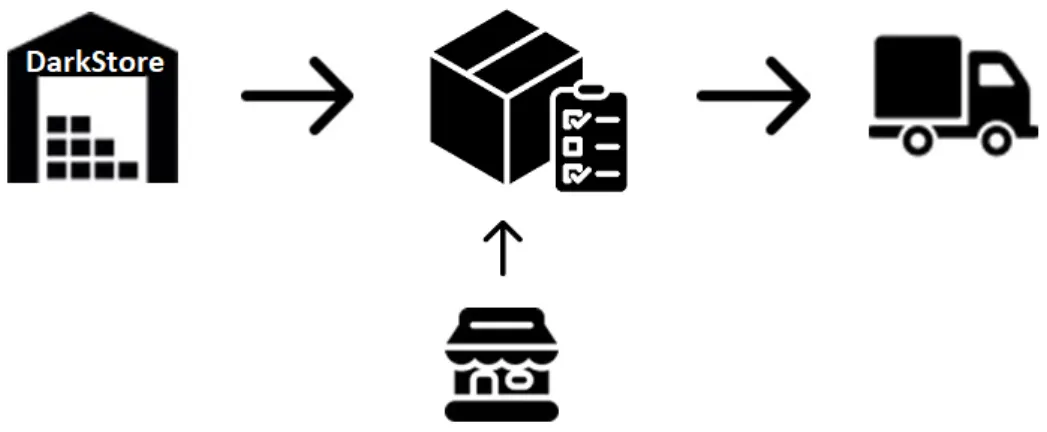
Or the order is picked in an online exclusive DC known as the “Dark Store” (Store ID 2594), a warehouse that only serves online customers but doesn’t keep such a variety of products in stock as some stores. When an order is allocated to the Dark Store and contains a specific
13 product that is not kept in stock there, then a close by brick-and-mortar store is used to supply those specific products; hence an order from the Dark Store can be composed of products with different origins.
Figure 7: Order arranged at the Dark Store
The process of preparing the order involves an employee physically picking the products ordered and arranging them to be delivered. Several things can happen to the products ordered:
• Success – the product was correctly delivered, correct brand, size, quantity. • Partial Success – product was delivered but not in the correct quantity.
• Substitution – product ordered was not delivered; it was substituted by a house brand. • Stock Rupture – due to a stockout that product was not delivered.
This process raises the possibility of a customer receiving an order different from what was ordered.
14
3.2. Hypothesis development
This study focuses on finding the key differences in performance indicators between using regular stores to fulfil online orders and fulfilling online orders with the online exclusive DC (also referred to as Dark Store). Furthermore, these differences in performance should impact repurchases and revenue. Therefore, the purpose of this study is to compare these different modalities and understand which is better.
3.2.1. Order fulfilment
As explained before, order fulfilment includes a variety of tasks needed to deliver what customers order. Failure to accomplish order fulfilment promises can be crucial to an online retailer; thus implementing effective and reliable distribution strategies, and inventory management becomes of critical importance (Rao, Griffis, & Goldsby, 2011)
Order fulfilment is considered a crucial part of online retail as it is one of the main inputs in customer satisfaction and customer satisfaction translates into repurchases (Koster, 2003; Nguyen et al., 2018; Zhang et al., 2011).
Store fulfilment (picking in store) to fulfil online orders is only appropriate for small sales volumes (up to 5%) (Govindarajan, Sinha, & Uichanco, 2018; Wollenburg et al., 2018). The hypothesis here presented is that for a determined amount of online sales (larger than 5%), picking online orders in the Dark Store leads to higher order fulfilment performance.
Customers expect that they will receive what they ordered online. The expectation disconfirmation theory states the gap between perceived performance and expectation determines satisfaction (Flavián et al., 2006; Khalifa & Liu, 2002). If consumers receive a bundle different from what their original order was, the negative gap between expectation and performance increases and the customer is unsatisfied.
The picking process in a store is associated with low service levels as it causes competition between online and in store orders leading to product substitutions and incomplete picking. Contrariwise picking orders in exclusive online centres is a specialised task that eliminates interactions between pickers and customers, increasing service levels and increasing the accuracy; therefore a higher picking efficacy is expected, leading to total order fulfilment (Wollenburg et al., 2018).
15 Accordingly to Koster (2003), the floor design and product location of stores are not compatible with picking to fulfil online orders. In the stores, the location of products is designed to maximise the sojourn time for customers, locating fast moving consumer goods far from each other in aisles that don’t allow shortcuts. Furthermore, within product families, products are stored accordingly to product margin rather than unit turn-over (highest margins at eye level) (Heizer & Render, 2001). All of these constraints affect the picking process which reflects on the accuracy of order fulfilment.
Koster (2003) then concludes that picking online orders in dedicated DC’s avoids interferences with other processes as the layout and design of these DC’s fit small-order picking which improves overall quality and in turn customer satisfaction.
In the case at hand, it is expected that specialised order arrangement in the Dark Store yields better results. Order fulfilment is measured through the picking rate, a variable that conveys how much of each order (in percentage) meets what the customer intended.
• Hypothesis one: arranging orders in an online exclusive distribution centre is associated with a higher total picking rate than store fulfilment.
3.2.2. Repurchasing
With the first hypothesis, this study ought to find a relationship between the Dark Store and performance of order fulfilment which impacts satisfaction positively. This satisfaction should then translate into repurchase.
Satisfaction occurs when expectations are exceeded or at least met. Order fulfilment, last mile delivery and returns management are some of the constructs that the customers create expectations about, thus a good performance on those increases chances of repurchase (Flavián et al., 2006; Khalifa & Liu, 2002; Nguyen et al., 2018).
Success in for an e-commerce retailer is fundamentally linked to consumers’ loyalty. The literature identifies many dimensions of consumer loyalty, but repurchase behaviour has the most pressing effect on a retailer’s profits (Zhang et al., 2011).
Being part of what affects the success of order fulfilment, stock-outs present a strong and negative correlation with consumer loyalty, meaning that it affects repurchase intentions (Rao et al., 2011). Specialised online DC’s reduce the incidence of stockouts and improve overall
16 order fulfilment inputting positively in the satisfaction customers experience (Nguyen et al., 2018).
Customers’ perceptions on order fulfilment have a critical role in achieving competitive advantage by building satisfaction and consequently trust and loyalty (Davis-Sramek, Mentzer, & Stank, 2008; Qureshi et al., 2009)
Researchers such as Collier and Bienstock (2006) or Parasuraman, Zeithaml and Malhotra (2005) indicate, amongst other factors of e-service quality, fulfilment as a significant and positive input in loyalty. Assuring a pleasant order experience gives to the e-retailer the possibility of building a loyal customer base and increase margins (Cao, Gruca, & Klemz, 2003).
Customers served by the Dark Store should be more satisfied due to better performance and that satisfaction should translate into repurchase. Repurchase was assessed by evaluating the number of orders placed by customers served either by the Dark Store or a regular store. Accordingly to this, the following hypothesis was constructed:
• Hypothesis two: arranging orders in an online exclusive distribution centre is associated with more repurchases than store fulfilment.
3.2.3. Revenue – Basket size and value
After analysing order fulfilment and repurchase the next step is to investigate basket size and basket value as satisfied customers should be more prone to ordering more goods per basket and spending more per basket.
Researchers agree that retaining customers is less expensive than acquiring new ones. To reduce customer defection, online retailers should focus on improving customer experience by, among other areas of action, improving order fulfilment rates (Reichheld & Schefter, 2000). Research shows that if a retailer can decrease customer defections by 5%, it can increase profitability from 25 to 85% (DeSouza, 1992).
Literature focuses mainly on the effect of satisfaction and in particular the satisfaction yield by successful order fulfilment in either purchase or repurchase (Nguyen et al., 2018), however literature focusing on the effect of order fulfilment satisfaction on basket expansion (both in the number of items and value of items) is rather short.
17 In parallel with what was mentioned for the second hypothesis, an online exclusive DC raises the possibility of keeping far more accurate inventory information reducing stockouts which are negatively correlated with revenue (Rao et al., 2011). Stock-outs have an intangible cost that has to do with future purchases that may not happen or the negative influence that comments may have on other consumers. Moreover, studies show that when the percentage of stockout decreases, the CLV (customer lifetime value) increases (Jing & Lewis, 2011; Zinn & Liu, 2001).
Nisar and Prabhakar (2017) elaborated a study that concludes that customer satisfaction is positively correlated with spending. Their results show that there is a direct relationship among e-service quality, satisfaction and e-loyalty.
Fisher, Gallino and Xu (2015), demonstrated how the implementation of an online exclusive DC impacted the delivery speed which in turn caused an increase of 4% in revenue.
The literature above builds on the construct that a facility such as the Dark Store positively impacts on revenue.
Customers experience satisfaction when the order placed meets what was intended. If customers served by the Dark Store experience higher picking success rates this should have a positive impact on next orders, both in terms of total basket value and size, yielding more revenue:
• Hypothesis three: arranging orders in an online exclusive distribution centre is associated with a higher increase in basket volume than store fulfilment.
• Hypothesis four: arranging orders in an online exclusive distribution centre is associated with a higher increase in revenue than store fulfilment.
18
4. Methodology
4.1. File Description
The data available was dispersed over more than 20 different files, most of them of reduced importance. These files gather information for one year, from 01-10-2016 to 29-09-2017 and this retailer had available online a set of 17.009 different SKU’s (Stock Keeping Units). More information on this can be found in the appendix section. Appendix 1 and 2.
There are two variables of extreme importance to understand the entire analysis.
StoreID – a variable that conveys to which store the order was allocated. Translates into “from which store the order came”;
PickingStore – a variable that gives information relative to which store each product was picked. As one order can have products picked in more than one store.
One order can be allocated to one store (through StoreID) and yet have in its composition products picked in, up to, four different stores.
4.2. Data cleaning stage
All data went through the removal of NA values. Also, columns that were not of interest for the analysis were discarded. Furthermore, different files were to create two “workable” files. In respect to the Total value per order (basket value), abnormally large values that were removed, in a total of 3 orders. This was done by setting the threshold at 10.000 and excluding orders above this. The largest one of those had a Total close to 100.000€ which seems unrealistic for a retailer whose average Basket Value (before data cleaning) was 141,68€. Also, orders with Total value of 0€ were removed as obviously an order totalling to 0€ must be a misrepresentation of data.
Another threshold created regards the number of orders per Customer ID. In total, three customers (2.558 orders) were removed by setting the threshold to 365 thus excluding every customer with more than one order per day (average).
19
4.3. Manipulating the data
As was mentioned before two files were created with the relevant information present and unnecessary information removed. New variables had to be created mainly by grouping and mutating other variables. This was of extreme importance as it changes the appearance of the data and allowed for hidden information to surface. More information can be found in the appendix section. Appendix 3 and 4.
20
4.4. Descriptive analysis
To truly understand the analysis developed in this study, a good comprehension of the data is needed. This next chapter ought to present the data in all of its complexity.
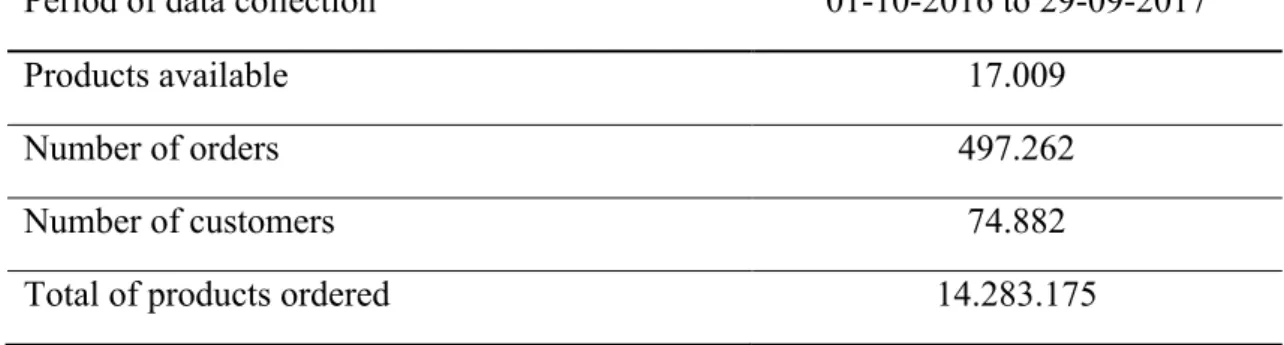
The initial, raw, files presented:
Figure 8: Untreated files information
Period of data collection 01-10-2016 to 29-09-2017
Products available 17.009
Number of orders 497.262
Number of customers 74.882
Total of products ordered 14.283.175
After the cleaning and manipulating stage the number of customers and orders was reduced to 463.185 different orders and 70.973 different customers. These orders can be arranged in 11 different stores. As mentioned, one order can contain products coming from more than one store. The following example might shed some light on this matter:
Order X includes, among other products ordered, a “grey chair”. Order X is allocated to store 10; however, store 10 does not have “grey chairs” in stock. The rest of the products present in order X will be picked in store 10 and, if feasible, the grey chair will be picked in some other store and transported to store 10 to compose the order.
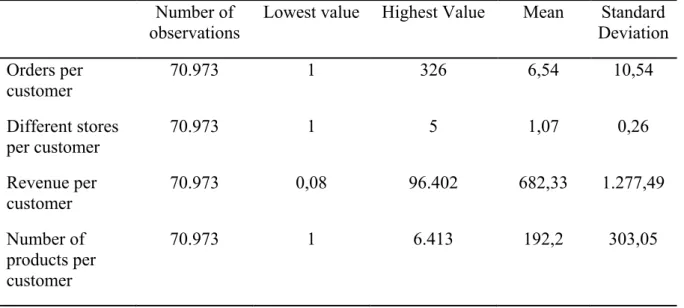
In this case, the Store ID would be store 10, but the picking store would vary across products. Figure 9 and 10 represent a descriptive statistical analysis the data by customer and by order, respectively; ahead some of the variables will be discussed in greater detail.
21
Figure 9: Descriptive statistics of variables metrics, per customer.
Number of
observations Lowest value Highest Value Mean Deviation Standard Orders per customer 70.973 1 326 6,54 10,54 Different stores per customer 70.973 1 5 1,07 0,26 Revenue per customer 70.973 0,08 96.402 682,33 1.277,49 Number of products per customer 70.973 1 6.413 192,2 303,05
Figure 10: Descriptive statistics of variable metrics, per order.
Number of observations
Lowest value Highest Value Mean Standard Deviation Number of products 463.185 1 300 29,45 19,19 Revenue per order 463.185 0,01 7.869,35 104,55 90,29 Average per product 463.185 0,01 820,71 4,79 9,25
There are some systematic differences between the Dark Store (Store 2594) and the rest of the stores. These differences present crucial implications on how the data should be interpreted. As was mentioned some orders contain products picked in more than one store, the reason why this happens was previously discussed already. If an order attributed to the Dark Store, include products picked in another store, and the variable “picking success corrected” for those products is significantly different from the products actually picked in the Dark Store; then it is plausible that products picked elsewhere could cause a misinterpretation of the true picking success of the Dark Store, lowering it and even affecting customer’s perception of its actual efficacy.
22 To perform the necessary analysis, all orders picked in more than one store had to be removed as they disfigure the real picking success of the stores. Hence only orders exclusively picked in one store were taken into consideration as for those the picking success is of their exclusive responsibility. This manipulation has a great impact on the data as will be shown next.
4.4.1. Allocation of orders
Out of the 11 available stores, orders are allocated to each one accordingly to the customers’ ZIP code. As mentioned, orders can either be picked exclusively in one store or picked in more stores (up to four). The Dark Store (Store 2594) is the store most affected by this situation
Figure 11: Proportion of orders picked in one or more stores, by Store ID.
For most stores, 98% of orders are composed of products exclusively picked in them, whereas for the Dark Store only 6,08% of orders are exclusively picked in it. As said before, the Dark Store is most affected by this situation. This happens due to the peculiarities of this exclusive online DC, as not all types of products are kept in stock.
4.4.2. Orders by Store
The Dark Store has 260.422 allocated to it. 15.631 of those are exclusively picked in the Dark Store, and 244.791 are picked in, at least, two different stores. This contrasts with the 400 orders picked in more than one store that every other store present together, totalling 202.763 orders. It becomes clear that the Dark Store has more orders allocated to it than all the other stores combined; however, once orders picked in more than one store are filtered out this figure is significantly reduced. The following graph depicts the number of orders per store for orders exclusively picked in one store.
23
Figure 12: Orders, by Store ID.
4.4.3. Order composition
Orders composition are categorised in ten different clusters, “Administrativo”, “Alimentar”, “Bazar”, “Casa”, “Fardamento”, “Electronics”, “FoodandBakery”, “Frescos”, “Têxtil”, “Wells”. However, “Fardamento” is a cluster that is not present in any order. The composition of the orders in terms of category of products varies accordingly to which store was the picking store as the next graph intends to show.
Figure 13: Order composition by Store ID.
Independently of the picking store, baskets are mainly composed of two categories, “Alimentar” and “Frescos” yielding, on average, for 90,31% of the items per basket (Alimentar = 70,38%; Frescos = 19,93%), other categories are less represented following the decreasing order: “Bazar”, “FoodandBakery”, “Casa”, “Administrativo”, “Wells”, “Textil”, “Electronics”, “Fardamento” (3,99%; 2,33%; 1,93%; 0,86%; 0,35%; 0,16%; 0,06%; 0%; respectively).
24 To better understand the method that determines if one order is picked exclusively in one store or more, an analysis of the content of orders allocated to the Dark Store was performed using an independent 2 sample t-test analysis.
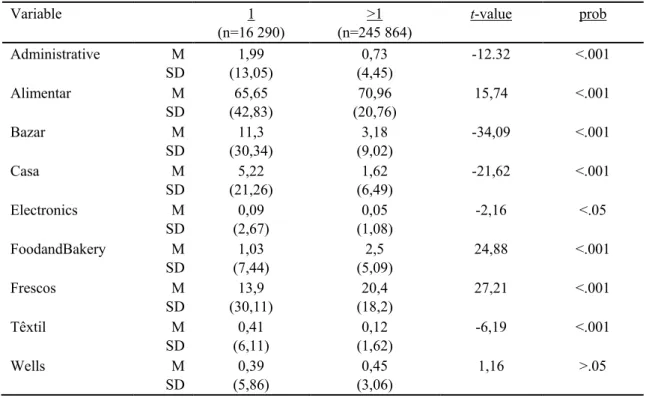
Figure 14: t-test results for the categories that compose orders from the Dark Store (either picked exclusively in it or in more than one store).
Variable 1 (n=16 290) >1 (n=245 864) t-value prob Administrative M SD 1,99 (13,05) 0,73 (4,45) -12.32 <.001 Alimentar M SD 65,65 (42,83) 70,96 (20,76) 15,74 <.001 Bazar M SD 11,3 (30,34) 3,18 (9,02) -34,09 <.001 Casa M SD 5,22 (21,26) 1,62 (6,49) -21,62 <.001 Electronics M SD 0,09 (2,67) 0,05 (1,08) -2,16 <.05 FoodandBakery M SD 1,03 (7,44) 2,5 (5,09) 24,88 <.001 Frescos M SD 13,9 (30,11) 20,4 (18,2) 27,21 <.001 Têxtil M SD 0,41 (6,11) 0,12 (1,62) -6,19 <.001 Wells M SD 0,39 (5,86) 0,45 (3,06) 1,16 >.05
It becomes clear that almost all categories present significant differences between the two groups, except for the “Wells” category. Orders that need to be picked in more than one store present, on average, a higher proportion of items of the categories “Alimentar”, “FoodandBakery” and “Frescos” when compared to orders picked exclusively in the Dark Store. The increase in the weight of these clusters balances with the decrease in the rest of them. The three last mentioned categories are distinguishable from the rest as they are the only ones in which perishable products could be included. Hence this suggests that the Dark Store might not keep in stock such a variety of perishable products; thus, whenever an order is placed, and it includes such products these have to be picked elsewhere.
Order composition is a crucial difference between groups. Orders exclusively picked in the Dark Store present systematic differences in basket composition when compared to orders picked in other stores.
25
4.4.4. Basket Size
Regarding the average basket size per order, the overall mean is 29,45 (SD=19,19) with 50% of the observations falling between 16 and 39 products per order. However, if an analysis is made excluding orders picked in more than one store, this affects the Dark Store profoundly. The rationale for this effect will be discussed next.
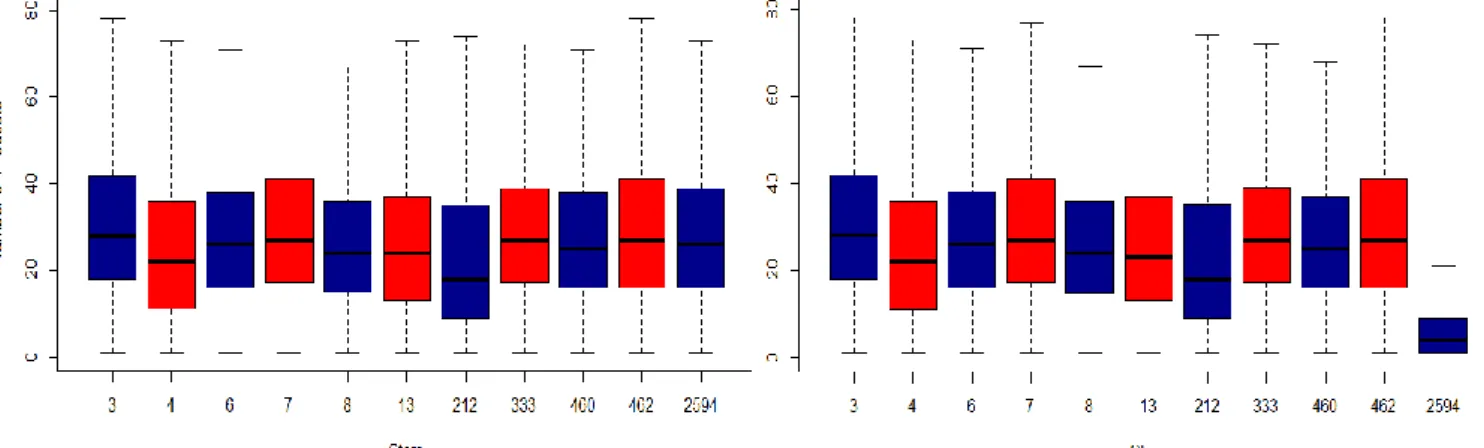
Figure 15: Basket size by Store ID. Before (left) and after (right) orders picked in more than one store have been removed.
Orders with a higher number of products will be more likely to have products that need to be picked in more than one store (such as perishable products). With an increase in the number of products per order comes an increase in the variety of products hence the probability of those orders containing a product not kept in stock in the Dark Store causes the need to do the picking of the products in more than one store.
Therefore, once orders picked in more than one store are removed the average basket size for the Dark Store (Store 2594) is affected with greater impact than other stores.
4.4.5. Basket value
Regarding the basket value, as the following boxplot shows (figure 16), the mean for all orders is 104,55€ (SD = 90,29) per basket and store 3 presents the highest mean (M = 127,18, SD = 106,64) whereas store 212 presents the lowest (M = 85,17, SD = 83,94). Once the orders picked in more than one store are removed, as happened in basket size, the Dark Store (Store 2594) is affected with greater impact than any other store (Figure 16). The rationale behind this effect is the same presented before.
26
Figure 16: Basket Value by Store ID. Before (left) and after (right) orders picked in more than one store have been removed.
Again, concerning the last two points, orders exclusively picked in the Dark Store (Store 2594) are systematically different, not only in terms of composition but also in size and value These five topics, allocation of orders, orders by store, order composition, basket size and basket value depict differences that exist between stores and, most importantly, between orders picked across more than one store and orders picked in only one store. Since these differences could not be eliminated the interpretation of the results must be made while keeping them in mind.
27
4.5. Model development
The models constructed to develop the analysis that this study sought to accomplish are explained in the following section. All of the statistical analysis was performed using R software (R Core Team, 2014).
Hypothesis one: arranging orders in an online exclusive distribution centre is associated with a higher total picking rate than store fulfilment.
In this study, order fulfilment was assessed through the indicator “picking success corrected”. A measure constructed per item, per order, consisting on whether each item was correctly picked, substituted, was out-of-stock or partially picked. The first hypothesis predicts that order fulfilment (through picking success) is higher for orders exclusively arranged in the Dark Store compared to orders picked in other regular stores.
To analyse the first hypothesis, a linear regression model was constructed. This model intended to study the effect that the place where the orders are picked has on their picking success (PickingSucessCorrected variable). To represent the place where orders were picked a dummy variable was created, dummy=”0” indicates that the order was picked in a regular store, whereas dummy=”1” indicates that the order was picked in the Dark Store (represented by DarkStore). The dependent variable for this model is “picking success corrected”. The independent variable is the dummy variable. Additionally, to increase the model trustworthiness and account for other factors that might affect the outcome, other moderator variables were included. (1) total basket value per order: Total; (2) the number of products per order: products.per.order.
𝑃𝑖𝑐𝑘𝑖𝑛𝑔𝑆𝑢𝑐𝑐𝑒𝑠𝑠𝐶𝑜𝑟𝑟𝑒𝑐𝑡𝑒𝑑
= 𝛽0 + 𝛽1 ∗ 𝐷𝑎𝑟𝑘𝑆𝑡𝑜𝑟𝑒 + 𝛽2 ∗ 𝑇𝑜𝑡𝑎𝑙 + 𝛽3 ∗ 𝑝𝑟𝑜𝑑𝑢𝑐𝑡𝑠. 𝑝𝑒𝑟. 𝑜𝑟𝑑𝑒𝑟 Hypothesis two: arranging in an online exclusive distribution centre is associated with more
repurchases than store fulfilment.
Repurchase behaviour was measured through the frequency of order. The dataset concerns a one-year period, from 01-10-2016 to 29-09-2017, totalling 364 days.
To test the second hypothesis, the frequency of purchase of customers solely served by the Dark Store was compared against that of customers never served by it. This required a carefully executed and extensive data treatment.
28 Customers served by more than one store and customers whose orders were picked in more than one store had to be removed from this analysis. This was done due to the following reasons: • Being served by more than one store (not having always orders picked in the same store) could increase the variability of performance and undermine the perception of success by the customer.
• Having orders that are picked in more than one store, as was also argued in the testing of the first hypothesis, could attribute picking failure to one store when in fact the products that caused that failure where picked elsewhere.
As the collection of data here analysed took place during a one-year period only, there could be customers whose frequency of order is inferior to one per year, meaning, customers that have an interval between orders greater than 364 days. These customers were not included when computing the average interval days between orders and could significantly alter the result. The number of distinct customers prior to data treatment was 70.973; of these, only 44.180 made more than one online purchase during the period of data collection. After the removal of customers in any of the situations mentioned above the total of observations left was 20.945. To analyse the second hypothesis, a linear regression model was constructed. This model intended to study the effect that the place where the orders are picked (Dark Store variable corresponds to the variable dummy) had on the frequency of purchase (represented through the variable orders.per.customer). It was not possible to include moderators in this analysis as the possible moderators were too highly correlated with the outcome variable which gives rise to the possibility of erroneous results.
𝑂𝑟𝑑𝑒𝑟𝑠. 𝑝𝑒𝑟. 𝑐𝑢𝑠𝑡𝑜𝑚𝑒𝑟 = 𝛽0 + 𝛽2 ∗ 𝐷𝑎𝑟𝑘𝑆𝑡𝑜𝑟𝑒
Hypothesis three: arranging in an online exclusive distribution centre is associated with a
higher increase in basket volume than store fulfilment.
Hypothesis four: arranging in an online exclusive distribution centre is associated with a
higher increase in revenue than store fulfilment.
For hypothesis three and four the methodology used to test them was similar, as so, both will be presented as one.
To test these hypothesis, this study sought to investigate the evolution of basket volume and revenue per order. Evolution was assessed based on the difference of basket size and value
29 between the first order and the average of the following orders. As the data set is limited to a one-year period and no information regarding previous orders is available an assumption had to be made:
Customers whose first available order was placed after 31/03/2017 are categorised as first-time customers. Customers whose first available order was placed before this threshold are classified as not first-time buyers. Every customer whose first order (registered in this database) occurs before 31/03/2017 has been filtered out. This was done to exclude those who are not ordering for the first time.
Also, for this analysis customers with less than 2 orders were excluded. After this, customer’s orders were separated in “first order” and “following orders”. Finally, were left:
• 3.729 customers and logically 3.729 “first orders” • 10.544 “Following orders”
Two variables were created. Dproducts.per.order and DTotal:
• Dproduct.per.order – a variable created by the difference between the average basket size (number of products) of “following orders” (avg.prod.per.order2) and “first orders” (avg.prod.per.order1) (by Customer ID);
𝐷𝑝𝑟𝑜𝑑𝑢𝑐𝑡. 𝑝𝑒𝑟. 𝑜𝑟𝑑𝑒𝑟 = 𝑎𝑣𝑔. 𝑝𝑟𝑜𝑑. 𝑝𝑒𝑟. 𝑜𝑟𝑑𝑒𝑟2 − 𝑎𝑣𝑔. 𝑝𝑟𝑜𝑑. 𝑝𝑒𝑟. 𝑜𝑟𝑑𝑒𝑟1
• DTotal – a variable created by the difference between the average of basket value of “following orders” (avgTotal2) and the basket value of “first orders” (avgTotal1) (by customer ID);
𝐷𝑇𝑜𝑡𝑎𝑙 = 𝑎𝑣𝑔𝑇𝑜𝑡𝑎𝑙2 − 𝑎𝑣𝑔𝑇𝑜𝑡𝑎𝑙1
𝐷𝑝𝑟𝑜𝑑𝑢𝑐𝑡𝑠. 𝑝𝑒𝑟. 𝑜𝑟𝑑𝑒𝑟 = 𝛽0 + 𝛽4 ∗ 𝐷𝑎𝑟𝑘𝑆𝑡𝑜𝑟𝑒 𝐷𝑇𝑜𝑡𝑎𝑙 = 𝛽0 + 𝛽3 ∗ 𝐷𝑎𝑟𝑘𝑆𝑡𝑜𝑟𝑒
30
5. Results
5.1. Picking Success
A linear regression was carried out to investigate the relationship between PickingSucessCorrected and to be or not the Dark Store.
Figure 17: Multiple linear regression with picking success as the dependent variable.
𝑃𝑖𝑐𝑘𝑖𝑛𝑔𝑆𝑢𝑐𝑐𝑒𝑠𝑠𝐶𝑜𝑟𝑟𝑒𝑐𝑡𝑒𝑑
= 90,66 + 4,43 ∗ 𝐷𝑎𝑟𝑘𝑆𝑡𝑜𝑟𝑒 + 0,04 ∗ 𝑝𝑟𝑜𝑑𝑢𝑐𝑡𝑠. 𝑝𝑒𝑟. 𝑜𝑟𝑑𝑒𝑟 − 0,01 ∗ 𝑇𝑜𝑡𝑎𝑙 Total and products.per.order variables were included to increase the model trustworthiness. Total corresponds to basket value per order and products.per.order correspond to the average number of products per basket.
The linear regression presented a significant relationship between the dummy variable (being the Dark Store) and PickingSucessCorrected. The slope coefficient was 4,43 proving that the PickingSucessCorrected increases by 4,43 percentage points, 95% CI [4,27; 4,59] when the store in which the products are picked is the Dark Store. The R2 value is 0,02 which means that
2% of the variation in PickingSuccessCorrected can be explained by the model.
Dependent variable: PickingSucessCorrected DarkStore 4.430*** (0.079) Total -0.010*** (0.0003) products.per.order 0.041*** (0.001) Constant 90.666*** (0.037) Observations 217,994 R2 0.020 Adjusted R2 0.020 Residual Std. Error 9.118 (df = 217990) F Statistic 1,448.453*** (df = 3; 217990) Note: *p**p***p<0.01
31 As could be expected, accordingly to the linear model, when the revenue per order increases the Picking Success decreases. Larger orders, worth more, are more likely to lead to mistakes and distractions thus reducing the Picking Success. However, the other moderator included in the regression that accounts for the basket size (products.per.order) presents an opposite result as when orders have more products the Picking Success increase. For both predictors, the impact that they have on the Picking Success is considerably small (0,01 and 0,04 percentage points) yet significant (p < 0,01). This indicates that the price of the products has more impact than the number of products in lowering the Picking Success.
The results here obtained are extremely relevant as important managerial insights can be drawn. The linear model presents unequivocal results that when orders are picked in the Dark Store higher Picking Success rates are achieved, this meets the literature abovementioned.
5.2. Repurchase
The linear regression presented a significant relationship between the dummy variable (being the Dark Store) and orders.per.customer.
Figure 18: Linear regression with orders per customer as the dependent variable.
𝑃𝑖𝑐𝑘𝑖𝑛𝑔𝑆𝑢𝑐𝑐𝑒𝑠𝑠𝐶𝑜𝑟𝑟𝑒𝑐𝑡𝑒𝑑 = 9,22 + 5,95 ∗ 𝑑𝑢𝑚𝑚𝑦1+∈
The slope coefficient was 5,95; 95% CI [5,55 ; 6,36]. The R2 value is 0,038 which means that
3,8% of the variation in orders.per.customer can be explained by the model containing only the
Dependent variable: orders.per.customer DarkStore 5.952*** (0.207) Constant 9.223*** (0.104) Observations 20,943 R2 0.038 Adjusted R2 0.038 Residual Std. Error 13.030 (df = 20941) F Statistic 828.982*** (df = 1; 20941) Note: *p**p***p<0.01
32 dummy variable. Again, results are extremely relevant, and managerial conclusions can be extracted, as will be discussed ahead.
5.3. Basket Size
The third hypothesis tested sought to study the impact of the location of the picking in the evolution of the number of products per order. The results obtained via linear regression analysis were significant.
Figure 20: Linear regression with basket size as the dependent variable.
𝐷𝑝𝑟𝑜𝑑𝑢𝑐𝑡𝑠. 𝑝𝑒𝑟. 𝑜𝑟𝑑𝑒𝑟 = −2,136 + 2,314 ∗ 𝑑𝑢𝑚𝑚𝑦
Dproducts.per.order represents the difference in the number of products per basket between “following orders” and the first order.
Regarding products per order, the model shows that when orders are picked in regular stores the following orders present on average less 2,136 products than the first one whereas in the case of orders picked in the Dark Store, basket size actually increases by 0,178 products from the first to the following orders (both being highly significant, p<0,001). The adjusted R2 tells
us that only 0,2% of the variability in the number of products per order is explained by this model. Dependent variable: Dproducts.per.order DarkStore 2.314*** (0.773) Constant -2.136*** (0.294) Observations 3,729 R2 0.002 Adjusted R2 0.002 Residual Std. Error 16.587 (df = 3727) F Statistic 8.958*** (df = 1; 3727) Note: *p**p***p<0.01
33
5.4. Basket Value
Finally, the fourth hypothesis tested in this study aimed at understanding the impact of the location of the picking in the evolution of revenue per order. The linear regression constructed presented the following results:
Figure 19: Linear regression with basket value as the dependent variable.
𝐷𝑇𝑜𝑡𝑎𝑙 = −10,828 + 7,317 ∗ 𝑑𝑢𝑚𝑚𝑦1
DTotal represents the difference in basket volume between “following orders” and the first order.
To simplify, these results mean that when orders are picked in a regular store, there is a decrease of 10,828€ in revenue per basket from the first order to the average of the following orders (highly significant, p<0,001). When the orders are picked in the Dark Store, the model also indicates that there is a decrease in the revenue per basket (of 3,511€ from the first to following orders); however, this result is not significant at acceptable levels (p>0,05).
Dependent variable: DTotal DarkStore 7.317 (6.024) Constant -10.828*** (2.288) Observations 3,729 R2 0.0004 Adjusted R2 0.0001 Residual Std. Error 129.250 (df = 3727) F Statistic 1.476 (df = 1; 3727) Note: *p**p***p<0.01
34
6. Analysis
Hypothesis testing allows conclusions to be drawn. First and most important, the Dark Store is responsible for higher Picking Success than the other stores. On average orders picked in the Dark Store present a Picking Success 4,43 percentage points higher than orders picked elsewhere. This happens because orders picked in the online exclusive DC present more item classified as “successful picking” and fewer “substitution”, “partial success” or “stock rupture”. There are specific characteristics of the distribution centre which allow it to be more successful: the lack of interaction between pickers and customers; the ability to keep stock information of greater detail and accuracy; or the possibility of designing the floor in such a way that benefits efficiency rather than projected to serve marketing purposes, are some examples (Koster, 2003; Nguyen et al., 2018; Wollenburg et al., 2018).
There are many factors affecting customer retention and repurchase intention (Fang et al., 2014; Qureshi et al., 2009; Zhang et al., 2011). Performance inputs on customer satisfaction and perception of quality, hence higher Picking Success should yield more repurchases and more revenue. As proved by the second hypothesis customers served by the Dark Store buy more often. When a customer is solely served by the Dark Store, he/she buys six more times per year than other customers. To simplify, customers whose online orders are managed in “normal” stores buy on average once every 39,5 days (364/9,22) whereas customers whose orders are picked in the Dark Store buy once every 24 days (364/15,18).
It is also curious to notice that, even though customers served by the Dark Store buy more often, they buy (although small) increasing amounts of goods per order as shown by hypothesis 3. However as mentioned in the previous section, regarding basket value the results obtained were not significant, this indicates that the place where orders are picked does not significantly influence the evolution of the value customers spend per order. This does not meet with literature that states that satisfied customers should evolve by purchasing larger baskets (in value). It is possible that by adding moderator variables to this linear model, this relationship could increase in significance.
Even though customers served by the Dark Store buy more frequently, the average number of items per basket increases, however the average basket value does not. This could be explained by customers buying more items with lower individual value. It is possible that by comparing
35 results for individuals (served either by the Dark Store or by a regular store) with similar purchase patterns, in terms of the interval between orders or type of products ordered, results more significant could be achieved; nevertheless, limitations will be discussed in a dedicated section.
To summarise the results obtained for hypothesis 1 and 2 met the expectations of this study. The results for hypothesis 3 and 4 do not since it was expected that hypothesis 3 would present a more substantial difference between groups , and that hypothesis 4 would present significant results.
Retailers that evolve from brick-and-mortar to brick-and-click enjoy the advantage of already having in place logistic systems, considerable experience and the familiarity of customers that increases the apparent trustworthiness of the brand (Gefen, 2000; Maltz et al., 2004; Porter, 2001).
The adoption hybrid retailing, in which the online channels complement the traditional, can reduce inventory costs which are a critical determinant of a retailer’s profit margin. Accounting for the simple fact that shelf space rent in a store is more expensive than shelf space rent in an online exclusive DC, due to its decentralised location, profit margins for orders placed online and picked at online exclusive DC should be higher compared to orders picked in store (Bhatnagar & Syam, 2014).
A study from 2014 concludes that a hybrid model that merges brick-and-mortar with online stores can increase the profitability of the retailer. Item allocation is manipulated so that items with low carrying costs are sold both online and in store, whereas items with elevated carrying cost are only sold online. Retailers can also increase the assortment of products available (virtual shelf extension) by allocating items with low inventory turnover exclusively to online channels (online exclusive DC) (Bhatnagar & Syam, 2014; Gaur, Fisher, & Raman, 2005; Noble, Griffith, & Weinberger, 2005).
Jalilipour Alishah, Moinzadeh and Zhou (2015) propose a plain yet competent and sturdy model: Online orders have their own DC and inventory; offline inventory is used solely as a perfect substitute, at a cost.