1 INTRODUCTION
In developed countries the building sector is re-sponsible for a very significant share of the total en-ergy consumption. On the 27 countries of the Euro-pean Union, buildings (residential and services) consume about 40% of total energy use and in Por-tugal this value is approximately 27% (EUROSTAT 2012). In this context it was published in 2002 the EU Energy Performance of Buildings Directive (EPBD), recently recast in 2010. The main objective of the document is “to promote the improvement of the energy performance of buildings”, establishing very ambitious targets (European Union 2010).
The EPBD recast also includes the definition of a comparative methodology framework for calculating cost-optimal levels of minimum energy performance requirements for buildings and building elements, that specifies how to compare energy efficient measures in relation to their energy performance and the cost attributed to their implementation and how to apply these to selected reference buildings. Coun-tries must define the reference buildings that should represent the typical and average building stock. Distinct reference buildings will be created accord-ing to their category (residential, office buildaccord-ings, other non-residential) and can be established from a statistical analysis of available real examples data. The reference building should include information on the type of use, floor area, compactness of the building expressed as an envelope area/volume fac-tor, building envelope structure with corresponding U-value, technical services systems and energy car-riers together with their share of energy use (Euro-pean Union 2012).
Regarding school buildings there is in Europe a growing concern and awareness of the need to use strategies, measures and sustainable building solu-tions in both new and refurbished buildings. Howev-er, the unfavourable economic climate we live re-quires great prudence when it comes to public investment and therefore should be considered alter-natives to either reduce operating costs of the non-rehabilitated buildings, either economically optimize the process of rehabilitation. Accordingly, preparing a proposal for the rehabilitation of a school building, in order to improve its energy performance, should include data acquisition, both qualitative and quanti-tative, of consumption and consequent operating costs, as well as a constructive description of a sig-nificant building stock, since this information can be used to characterize the buildings performance in service conditions and to identify potential im-provement measures.
The Laboratory of Building Physics of the Facul-ty of Engineering of UniversiFacul-ty of Porto (LFC-FEUP) conducted a survey of the annual consump-tion of energy and water on 23 non-rehabilitated schools. The results show significant variability in the consumptions, suggesting that there may be a possibility for reduction. This paper describes the building stock, presents the data obtained in the sur-vey, including a statistical analysis and the first re-sults in the identification of the variables responsible for the variability, and perspective the future works in this investigation.
Variability of energy and water consumption of school buildings
R.M.S.F. Almeida
Civil Engineering Department, School of Technology & Management, Polytechnic Institute of Viseu, Portugal
N.M.M. Ramos, M.L. Simões & V.P. de Freitas
Building Physics Laboratory, Civil Engineering Department, Faculty of Engineering, University of Porto, Portugal
ABSTRACT: In developed countries, the building sector is responsible for a very significant share of the to-tal energy consumption. School buildings, since they are places where children are educated and learn to be-come active members of the society, must be a good example of efficient use of energy and water. In this study, data of the energy and water consumption of 23 Portuguese schools and their main building character-istics and properties was gathered. This information was normalized in order to homogenize the data set and then analysed using advanced statistical tools. The results show a significant variability in the consumption of different schools, even with similar characteristics, suggesting that there may be space to an improvement in its efficiency.
2 LITERATURE REVIEW
2.1 Previous studies
The variability on the energy consumption and, consequently, on the operational costs of school buildings has been subject of interest from several researchers.
Typically the strategies used to gather infor-mation on the consumption of school buildings is through the direct contact with institutions, or by sending questionnaires or on request from the gov-ernment entity that oversees the sector. The data col-lected is used for the following purposes:
- suggest methodologies for ranking the perfor-mance of buildings based on the definition of en-ergy classes;
- propose benchmarks to be included in the regu-lations or in the energy certification procedure of a particular country;
- define strategies for the identification of effi-cient rehabilitation measures;
- estimate the consumption of buildings with sim-ilar characteristics.
Concerning the methodologies for building rank-ings, based on a scale of consumption or on the defi-nition of performance classes, commonly used strat-egies requires a previous statistical analysis of the data. The definition of performance classes can also be suitable for the quantification of reference values (benchmarks).
The annual energy consumption of electricity and natural gas was measured in 15 Argentinian schools by Filippin (2000) and used to estimate and classify the energy efficiency and emission of greenhouse gases, revealing an inefficient use of energy. Benchmark values were proposed and the results compared with similar studies developed in northern hemisphere countries.
Desideri and Proietti (2002) started a research project with the main purposes of promote a meth-odology for analysis of procedures for a rational use of energy and increment energy saving in Italian school buildings, which included the data collection of energy consumptions to define indicators of con-sumption and apply them to assess the potential for performance improvement. They concluded that the heating energy demand can be reduced by 48% if all buildings of the same type of construction performed as the best in the class. With the same approach electricity consumption could be reduced by 41%.
Hernandez et al. (2008) proposed to develop en-ergy benchmarks and rating systems, applied to the Irish school buildings, computed from the actual consumption and the calculation of the "Energy Per-formance Indicator" and compares the results with computer simulation models. The reference values
used for the classification were the ones proposed in the prEN 15217 (2005).
Corgnati et al. (2008) performed a field survey in order to collect data concerning the actual energy consumption for space heating of a sample of about 140 Italian school buildings. The information was used to establish a “specific energy performance in-dicator related to space heating” that could be ap-plied in the definition of benchmark values.
Dascalaki and Sermpetzoglon (2011) exploit the results of a field energy survey in 135 Greek schools for classifying and defining energy consumption benchmarks and subsequently evaluate the relation-ship between the results and some characteristics of the buildings, such as the geometry and the presence or absence of insulation.
Santamouris et al. (2007) proposes a new energy classification technique, based on intelligent cluster-ing methodologies, supported on the results of a field energy survey in 320 schools in Greece. The cluster analysis allows the identification of perfor-mance classes and, within each class, it was suggest-ed a reference value, definsuggest-ed as the center of each cluster, ie, the point where the sum of distances from all data in that cluster was minimized. The results showed that the reference values achieved with this method differ significantly from those obtained with the traditional statistical models based on cumulative frequency distributions. The cluster analysis tech-nique to define performance classes was also applied by Gaitani et al. (2010) with the purpose of identify-ing the main typical characteristics of the school buildings belonging to each energy class. To this end, a principal components analysis was developed within each class. The ultimate goal was, from these typical characteristics, identify high efficiency pro-posals for the school buildings rehabilitation.
Energy and indoor environmental audits of ener-gy consumption and indoor air quality were taken by Butala and Novak (1999) in 24 old school buildings in Slovenia in order to perform an economic analysis of possible retrofit measures. The conclusions were that the heat losses are 89% higher than the recom-mended values and that it is not possible to improve the energy performance, by a more rational energy use, and guarantee good indoor air quality, with low investment costs.
Dimoudi and Kostarela (2009) utilized the values of energy consumption of 9 schools to characterize their performance and to create and calibrate a com-puter simulation model applied in the identification of potential rehabilitation interventions for reducing consumption.
Information on actual consumption of buildings can also be employed as an instrument of estimating the performance. Stuart et al. (2007) propose a methodology to identify electricity saving opportu-nities in school buildings based on half-hourly elec-tricity consumption data. The method includes the
monitoring of time series data and the identification of patterns in order to predict the performance and possible improvements. Beusker et al. (2012) pro-pose an estimation model for heating energy con-sumption of schools in Germany based on a strategy of detecting critical parameters in buildings through their correlation with actual consumption. For that it was applied linear and non-linear regression models.
2.2 Normalization, indexes and variables
There is no standard procedure for the use of the data collected in energy surveys. It can be found in literature several proposals for the quantities chosen to characterize the consumption, for the procedure applied in the normalization of those quantities, for the indexes employed in the building classification
and for the parameters and variables selected to de-scribe the building.
The quantities typically chosen to evaluate the energy performance of buildings include heating en-ergy demand and real consumption data of electrici-ty, gas and other fuels, for heating proposes or as a total value of consumption. There is also some vari-ability in the method elected to compute those quan-tities. Some studies consider energy related units (J or Wh) and others prefer the economic cost of the consumption.
Quantities need to be normalized in order to al-low a comparison between the performance of build-ings with different characteristics and locations. This normalization can be carried out regarding to differ-ent parameters and variables, such as area, volume, number of students, number of classes, external cli-mate, etc.
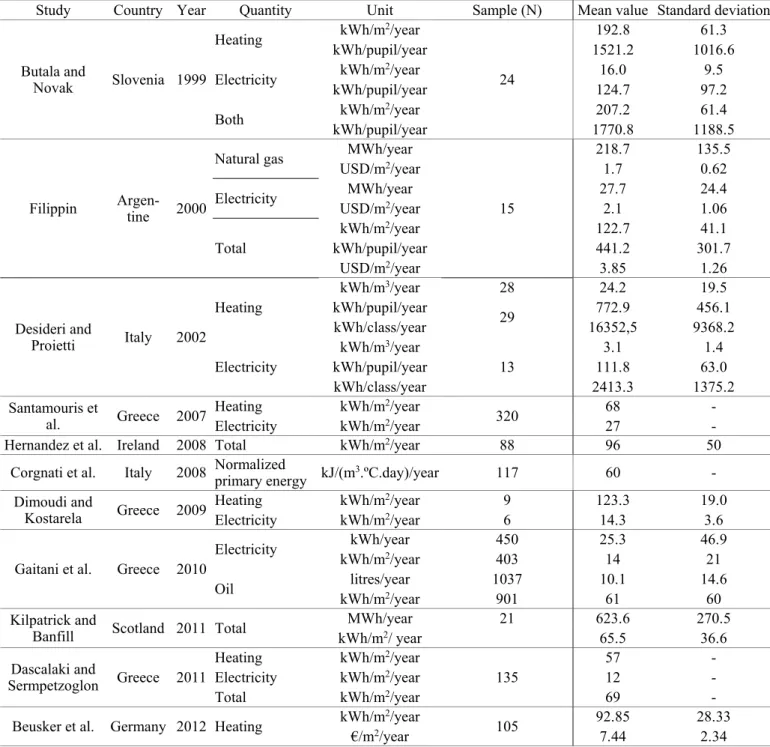
Table 1. Relevant studies
Study Country Year Quantity Unit Sample (N) Mean value Standard deviation
Butala and Novak Slovenia 1999 Heating kWh/m2/year 24 192.8 61.3 kWh/pupil/year 1521.2 1016.6 Electricity kWh/m2/year 16.0 9.5 kWh/pupil/year 124.7 97.2 Both kWh/m2/year 207.2 61.4 kWh/pupil/year 1770.8 1188.5
Filippin Argen-tine 2000
Natural gas MWh/year
15 218.7 135.5 USD/m2/year 1.7 0.62 Electricity MWh/year 27.7 24.4 USD/m2/year 2.1 1.06 Total kWh/m2/year 122.7 41.1 kWh/pupil/year 441.2 301.7 USD/m2/year 3.85 1.26 Desideri and Proietti Italy 2002 Heating kWh/m3/year 28 24.2 19.5 kWh/pupil/year 29 772.9 456.1 kWh/class/year 16352,5 9368.2 Electricity kWh/m3/year 13 3.1 1.4 kWh/pupil/year 111.8 63.0 kWh/class/year 2413.3 1375.2 Santamouris et al. Greece 2007 Heating kWh/m2/year 320 68 -Electricity kWh/m2/year 27
-Hernandez et al. Ireland 2008 Total kWh/m2/year 88 96 50
Corgnati et al. Italy 2008 Normalized primary energy kJ/(m3.ºC.day)/year 117 60 -
Dimoudi and
Kostarela Greece 2009
Heating kWh/m2/year 9 123.3 19.0
Electricity kWh/m2/year 6 14.3 3.6
Gaitani et al. Greece 2010
Electricity kWh/year 450 25.3 46.9
kWh/m2/year 403 14 21
Oil litres/year 1037 10.1 14.6
kWh/m2/year 901 61 60
Kilpatrick and
Banfill Scotland 2011 Total
MWh/year 21 623.6 270.5 kWh/m2/ year 65.5 36.6 Dascalaki and Sermpetzoglon Greece 2011 Heating kWh/m2/year 135 57 -Electricity kWh/m2/year 12 -Total kWh/m2/year 69
-Beusker et al. Germany 2012 Heating kWh/m2/year 105 92.85 28.33
Table 1 presents an overview of the most relevant published studies related to the evaluation of school buildings energy performance making use of real consumption data and it is possible to observe the variability in the quantification and normalization of the results. The data of each survey was also ana-lyzed and computed the respective mean value and standard deviation. It was found that the standard deviation values are globally high, which indicates a significant dispersion of the consumptions around the mean value.
Several studies and regulations suggest the use of indexes to evaluate and classify the performance of school buildings, both in design stage and in service conditions. These indexes are typically based on da-ta of consumption and, as so, dependent on the nor-malization procedure employed (Desideri and Proietti 2002, Hernandez et al. 2008, Corgnati et al. 2008).
3 SCHOOL BUILDINGS CHARACTERIZATION AND METHODOLOGY
The study presented in this article focused on 23 school buildings, situated on the northern coast of Portugal. All are non-rehabilitated buildings, mostly of recent construction, more than 40% of the sample has less than 20 years (Table 2).
Table 2. Distribution according to the year of construction <1970 1970-1979 1980-1989 1990-1994 ≥1995
4 5 4 5 5
The costs of energy and water of each building were obtained from the respective monthly bills, during one year period, provided by the school board. Energy costs includes electricity (heating, lightning, …), gas (cooking and hot water prepara-tion) and oil (hot water preparaprepara-tion).
Buildings were inspected and constructive and operation characteristics recorded, in particular the type of operation (number of students and classes), the geometry, the main constructive elements, facili-ties, heating and ventilation equipment and systems and the main constructive problems and pathologies. Figure 1 shows the distribution of the school
build-ings according to the number of students and the floor area.
Figure 1. Distribution of the school buildings.
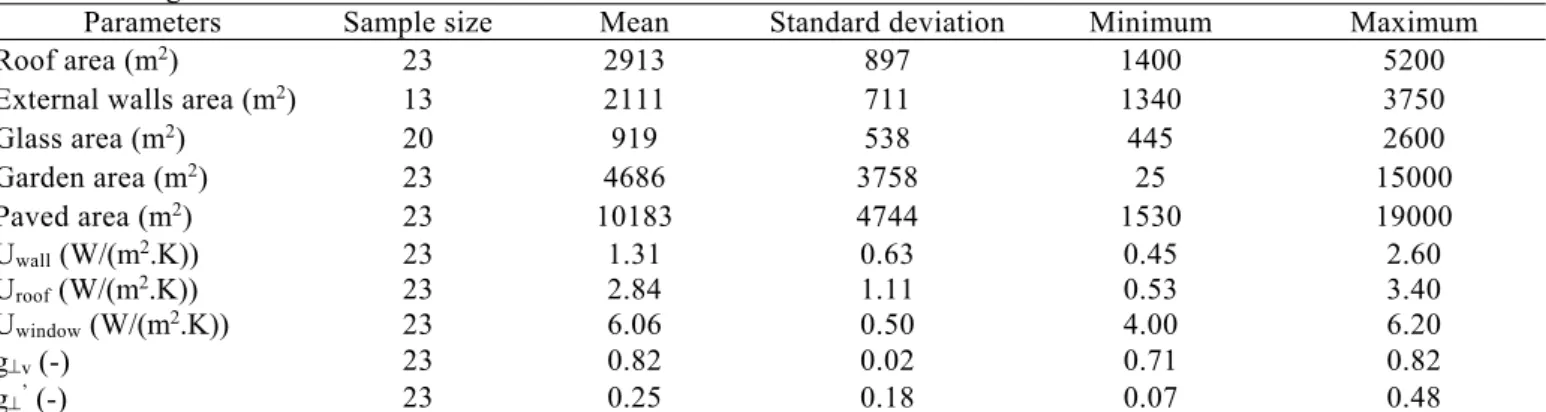
Since the energy performance of buildings is ob-viously dependent on the characteristics of its enve-lope, the most relevant properties were quantified: the heat transfer coefficient of the external walls (Uwall), roof (Uroof) and windows (Uwindow) and the
solar energy transmittance of glasses and windows, with and without solar protection (gv and g’). A
geometric characterization of the buildings was also performed. Table 3 shows the results of the survey and their statistical analysis. In some buildings has not been possible to obtain all the data, therefore it is also presented the size of the sample associated with each variable.
Regarding heating systems, sample can be divid-ed in: (i) Type A schools (five of the analyzdivid-ed schools had electric heating systems in all class-rooms); (ii) Type B schools (individual electric heaters are utilized, usually radiators, in some spe-cific classrooms) (Figure 2).
a) b)
Figure 2. Heating systems. a) Type A schools; b) Type B schools.
Table 3. Building characterization
Parameters Sample size Mean Standard deviation Minimum Maximum
Roof area (m2) 23 2913 897 1400 5200
External walls area (m2) 13 2111 711 1340 3750
Glass area (m2) 20 919 538 445 2600 Garden area (m2) 23 4686 3758 25 15000 Paved area (m2) 23 10183 4744 1530 19000 Uwall (W/(m2.K)) 23 1.31 0.63 0.45 2.60 Uroof (W/(m2.K)) 23 2.84 1.11 0.53 3.40 Uwindow (W/(m2.K)) 23 6.06 0.50 4.00 6.20 gv (-) 23 0.82 0.02 0.71 0.82 g’ (-) 23 0.25 0.18 0.07 0.48
4 RESULTS
4.1 Normalization
The first step was the normalization of the con-sumption values. The procedure adopted for it was defined after a correlation analysis between varia-bles: number of students, area, electricity annual consumption, gas annual consumption and water an-nual consumption. Table 4 summarizes the results obtained exposing the Pearson correlation coeffi-cient (r).
Table 4. Correlation analysis Pearson
correlation coefficient
Consumption Number of
students Area Electricity Gas Water Number of students 1 0.682 0.407 0.091 -0.155 Area 1 0.585 -0.019 0.223 Consumption Electricity 1 -0.069 0.029 Gas 1 -0.108 Water 1
The results of the correlation analysis revealed that was only observed a significant correlation be-tween the number of students and the floor area (r=0.682) and between the floor area and the elec-tricity consumption (r=0.585).
Since the electricity consumption corresponds to the most important share in the total operating costs of these schools and the number of students is corre-lated with the floor area, it was considered that the most appropriate normalization for this sample would be in relation to the floor area.
4.2 Monthly analysis
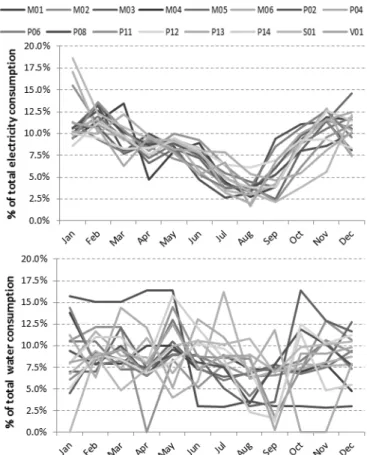
In 7 of the schools studied has only been possible to obtain the annual consumption, so the monthly analysis is thus limited to a sample of 16 buildings. The monthly consumption data was used to identify possible patterns of behaviour that lead to tion profiles. Figure 3 shows the monthly consump-tion of electricity and water.
Electricity consumption throughout the year pre-sents a typified pattern, with higher consumption in the winter months, where the necessity of use of arti-ficial lighting and the heating energy demand are higher, and lower consumption in the summer months that usually correspond to the school holi-days.
With respect to water consumption the distribu-tion is random, making impossible the identificadistribu-tion of a consumption profile. Additionally, is important
to refer that some specific data was not available, although not affecting the overall reading of Figure 3. It can be observed that at least no seasonal effect is present.
Figure 3. Monthly consumption.
Monthly data of electricity consumption was used to identify a profile of annual consumption, based on the calculation of the monthly average. The profile was computed separately for the five school build-ings with heating systems with equipment in all classrooms (Type A schools) and for the rest of the buildings (Type B schools). Similar results were achieved for the two scenarios and, hence, no signif-icant dependence between the consumption profile and the nature of the heating systems was found (Figure 4). 0% 5% 10% 15% 20%
Type A schools Type B schools all
4.3 Annual analysis
Table 5 shows the results of the statistical analy-sis of the number of students, the floor area and the total annual cost of energy (electricity, gas and oil) and water.
It can be concluded that the cost of electricity is the major operational cost of the schools analyzed. The distribution of the annual electricity cost is more homogeneous (Cv = 21%) compared to water (Cv =
72%) and gas (Cv = 57%). Only 4 schools have oil
consumption and consequently the sample is too small to be statistically reliable.
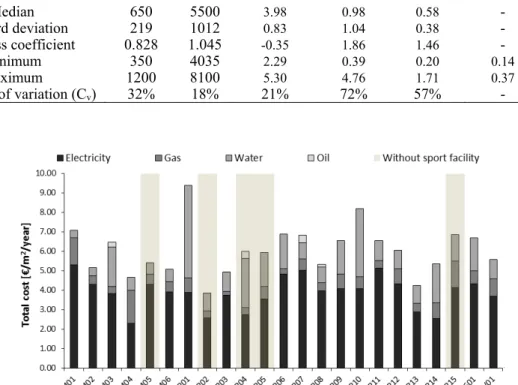
Some school buildings have associated sports fa-cilities. Figure 5 plots the distribution of the annual costs of energy and water, normalized relatively to the floor area, highlighting the schools that do not have sport facilities or do not support the consump-tion costs of energy and water.
In an unexpected manner, the results show that there are no clear evidence of relation between the presence or absence of the sport facility and the costs of energy and water in schools.
Table 5. Statistical analysis of the annual cost
Cost [€/m2]
Number of
students Area[m2] Electricity Water Gas Oil Total
Sample size 23 23 23 23 23 4 23 Mean 678 5663 3.89 1.45 0.66 0.29 6.05 Median 650 5500 3.98 0.98 0.58 - 6.01 Standard deviation 219 1012 0.83 1.04 0.38 - 1.25 Skewness coefficient 0.828 1.045 -0.35 1.86 1.46 - 0.70 Minimum 350 4035 2.29 0.39 0.20 0.14 3.86 Maximum 1200 8100 5.30 4.76 1.71 0.37 9.39 Coefficient of variation (Cv) 32% 18% 21% 72% 57% - 21%
Figure 5. Annual operational costs.
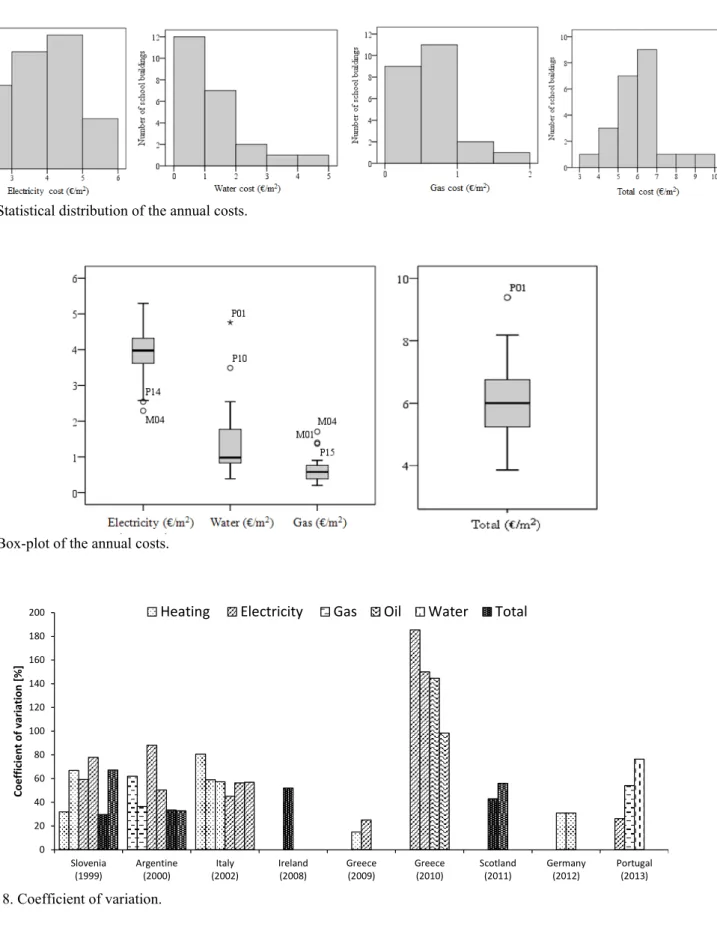
The histograms of the normalized annual costs are illustrated in Figure 6. The distribution of the normalized electricity cost is almost symmetric while water and gas consumptions have right asym-metry.
Another way to statistically analyze the distribu-tion of these samples is using the box-plot represen-tation, where can be observed the outliers of the sample. This form of representation (Figure 7) al-lows to easily identify situations of abnormally high consumption, for example, the water cost at school P01, clearly superior to the average cost. In fact, the water consumption in this school is so uncharacteris-tic that conditions the global performance of the school, making it an outlier even when analyzing the total annual costs.
4.4 Variability analysis
As stated before, there is no standard procedure for the use of the data collected in energy surveys and, therefore, there is an enormous variability in the normalization procedures, in the units and indexes and in the variables considered. These different ap-proaches makes complicated the process of compar-ing the values obtained in different studies.
Additionally, the analysis of the variability on the energy and water consumption and, consequently, on the operational costs of a group of school build-ings, is important, since it can be a useful manage-ment tool for the governmanage-ment entity that oversees the sector. One way to compare the variability of a sam-ple is by calculating the respective coefficient of variation, defined as the ratio of the standard
devia-tion to the mean. The coefficient of variadevia-tion was computed for the studies presented in Table 1 (those that provide the necessary information) and com-pared with the study presented in this paper (Figure 8).
The variability found in most of the studies has different magnitudes, ranging from 20% to 80%. The study on Greek schools, with a very large sam-ple, provided even wider values.
Looking at the base data for each study, the vari-ability can, of course, be explained by the varivari-ability of the outside climatic conditions in each study. For the Portuguese case, that climatic variability was ra-ther low, the importance of adequate management of the facility therefore arises. An adequate method for grouping schools before deriving benchmarks must consequently be defined.
Figure 6. Statistical distribution of the annual costs.
Figure 7. Box-plot of the annual costs.
0 20 40 60 80 100 120 140 160 180 200 Slovenia (1999) Argentine (2000) Italy (2002) Ireland (2008) Greece (2009) Greece (2010) Scotland (2011) Germany (2012) Portugal (2013) Co effi ci en t of vari ati o n [% ]
Heating Electricity Gas Oil Water Total
5 CONCLUSIONS
The data of an energy and water consumption survey, conducted in 23 Portuguese school build-ings, was statistically analysed. The following con-clusions can be stated:
- monthly consumption, over one year, of elec-tricity, water, gas and oil was recorded. Electrici-ty is the most significant operating cost, followed by water;
- correlation analysis showed that only exists a significant correlation between the number of students and the floor area and between the elec-tricity consumption and the floor area;
- electricity consumption presents a clear season-al variation, with higher demand in winter months. For the water consumption no pattern was detected;
- the analysis of the average profile of electricity consumption for schools with and without heating system with equipment in all classrooms indicates no significant differences, suggesting their re-duced use;
- from the results is not possible to identify a clear relation between the presence or absence of a sport facility and the costs of energy and water; - the statistical distribution of the normalized an-nual cost of electricity is almost symmetric while water and gas consumptions have right asym-metry;
- the median value of the total annual costs of en-ergy and water is about 6 €/m2, 4 €/m2 for
elec-tricity and 1 €/m2 for water;
- the variability found in similar studies, per-formed in different countries, can be very differ-ent, enhancing the need for a careful computation of all the information regarding these studies. Using the actual cost of electricity it can be esti-mated that these buildings have an average con-sumption of 30 kWh/(m2.year) which is a low value
for school buildings. In situ measurements carried out in these buildings showed that it was only possi-ble to achieve this level of consumption neglecting internal environmental conditions (indoor air quality and thermal comfort) (Almeida and Freitas 2010). For that reason it is essential that there is great pru-dence in the preparation of the rehabilitation of this schools, since it will most likely result in a signifi-cant increase in the energy demand, and consequent-ly in the operating costs of these buildings, and may even, in some circumstances, make the building management unsustainable.
REFERENCES
Almeida, R. & Freitas, V.P. 2010. Hygrothermal Performance
of Portuguese Classrooms: measurement and computer
simulation. Proceedings of the 1st Central European
Sym-posium on Building Physics (CESBP-2010), Cracow, Po-land, September 13-15.
Beusker, E., Stoy, C. & Pollalis, S.N. 2012. Estimation model and benchmarks for heating energy consumption of schools and sport facilities in Germany. Building and Environment, Vol. 49: 324-335.
Butala, V. & Novak, P. 1999. Energy consumption and poten-tial energy savings in old school buildings. Energy and
Buildings, Vol. 29: 241-246.
CEN, prEN 15217, 2005. Energy performance of buildings –
Methods for expressing energy performance and for energy certification of buildings. Brussels.
Corgnati, S.P., Corrado, V. & Filippi, M. 2008. A method for heating consumption assessment in existing buildings: A field survey concerning 120 Italian schools. Energy and
Buildings, Vol. 40: 801-809.
Dascalaki, E.G. & Sermpetzoglou, V.G. 2011. Energy perfor-mance and indoor environmental quality in Hellenic schools. Energy and Buildings, Vol. 43: 718-727.
Desideri, U & Proietti, S. 2002. Analysis of energy consump-tion in the high schools of a province in central Italy.
Ener-gy and Buildings, Vol. 34: 1003-1016.
Dimoudi, A. & Kostarela, P. 2009. Energy monitoring and conservation potential in school buildings in the C′ climatic zone of Greece. Renewable Energy, Vol. 34: 289-296. European Union 2010. Directive 2010/31/EU of the European
Parliament and of the Council of 19 May 2010 on the ener-gy performance of buildings, Official Journal of the
Euro-pean Communities.
European Union 2012. Guidelines establishing a comparative
methodology framework for calculating cost-optimal levels of minimum energy performance requirements for buildings and building elements (2012/C 115/01), Official Journal of
the European Communities.
EUROSTAT 2012. Statistics Explained Archive: Vol. 4
Agri-culture, Environment, Energy and Transport Statistics,
Eu-ropean Commission.
Filippı́n, C. 2000. Benchmarking the energy efficiency and greenhouse gases emissions of school buildings in central Argentina. Building and Environment, Vol. 35: 407-414. Gaitani, N., Lehmann, C., Santamouris, M., Mihalakakou, G.
& Patargias, P. 2010. Using principal component and clus-ter analysis in the heating evaluation of the school building sector. Applied Energy, Vol. 87: 2079-2086.
Hernandez, P., Burke, K. & Lewis, J.O. 2008. Development of energy performance benchmarks and building energy rat-ings for non-domestic buildrat-ings: An example for Irish pri-mary schools. Energy and Buildings, Vol. 40: 249-254. Kilpatrick, R.A.R. & Banfill, P.F. 2011. Energy consumption
in non-domestic buildings: a review of schools. World
Re-newable Energy Congress 2011, 8-13 May 2011,
Linkoping, Sweden.
Santamouris, M., Mihalakakou, G., Patargias, P., Gaitani, N., Sfakianaki, K., Papaglastra, M., Pavlou, C., Doukas, P., Primikiri, E. & Geros, V. 2007. Using intelligent clustering techniques to classify the energy performance of school buildings. Energy and Buildings, Vol. 39: 45-51.
Stuart, G., Fleming, P., Ferreira, V. & Harris, P. 2007. Rapid analysis of time series data to identify changes in electricity consumption patterns in UK secondary schools, Building