Original:
Aubry, T.; Luís. L. & Dimuccio, L. A. (2012): Nature vs. Culture:
present-day spatial distribution and preservation of open-air rock art in
the Côa and Douro River Valleys (Portugal). Journal of Archaeological
Science, 39 (4), p. 848-866
of open-air rock art in the Côa and Douro River Valleys (Portugal)
Thierry Aubrya, *, Luís Luísa, Luca Antonio Dimucciob, c
a Parque Arqueológico e Museu do Côa, Instituto de Gestão do Património Arquitectónico e Arqueológico, Ministério da Cultura de Portugal, Rua do Museu, 5150-610 Vila Nova de Foz Côa, Portugal
b Centro de Estudos de Geografia e Ordenamento do Território (CEGOT), Departamento de Geografia, Faculdade de Letras, Universidade de Coimbra, Praça da Porta Férrea, 3004-530, Coimbra, Portugal
c
Departamento de Ciências da Terra, Faculdade de Ciências e Tecnologia, Universidade de Coimbra, Largo Marquês de Pombal, 3000-272 Coimbra, Portugal
Abstract
Late-glacial and Iron-Age open-air rock art of the Côa River Valley shows a similar spatial distribution, with several clusters along the Côa and Douro River tributaries that are mostly exposed to the southeast. In this report, we try to determine whether the artists of both periods deliberately chose the same natural panels for rock art or its present-day spatial distribution is imposed by formation and weathering processes, previous or subsequent to the engraving. Geological structural analysis, from regional to field scales, shows a NNE-SSW sinistral strike-slip fault system that crosses the study area, together with a set of fracture/joints with the same orientation and formed by the same tectonic stress. Direct field measurement and the description of 713 natural panels, engraved and un-engraved, reveal that the preserved rock art panels correspond to the most common tectonic fracture/joint systems (NNE-SSW) of the study area. Locally, the hydrographic network is conditioned by the same structural control. Differential weathering exists between the panels exposed on opposite margins of watercourses, with preferential degradation of the rock art panel surfaces exposed to the NW. We propose that, on the scale of the valley, the surface weathering of the rock art panels results from differential solar radiation, humidity, lichen and bryophyte colonisations. Interpretation of field observations, a frequency-probabilistic procedure, pair-wise comparison matrix and geographic information system analysis were combined to evaluate a Côa panel formation and preservation predictive model using archaeological, topographical and hydrological data. Four variables were extracted and weighted from the collected data, including topographic slope and aspect, solar radiation and cost-weighted distance to watercourses, which were used as environmental input data. The archaeological input data (rock art occurrences) were used to calculate the variable ratings and to evaluate both the Côa panel formation and preservation predictive model and external validation maps, with the results showing an agreement of 80% and 70%, respectively. Field verification revealed unknown rock art panels in areas with high and very high values. The Côa panel formation and preservation predictive model provides a useful framework to guide survey and heritage management.
Keywords
Côa River Valley; Late-glacial, Iron Age, Open-air rock art preservation; Landsat imagery; Pair-wise comparison matrix; Frequency-probabilistic procedure; Predictive model
* Corresponding author: Tel.: (00351)239443992, E-mail: thaubry@sapo.pt (Thierry Aubry), Urbanização São Bento, Lote 65, Casais do Campo, 3045-120, Coimbra, Portugal.
Graphical abstract
Research highlights
• Côa River Valley engraved panels formation were conditioned by local tectonic • Rock art was produced in these panels over a period of 30,000 years
• Rock art preservation depends on differential biodegradation of surface panel • Environmental variables also control the weathering of exposed panel surface • A predictive model is a valuable tool to survey and manage this World Heritage Site
1. Introduction
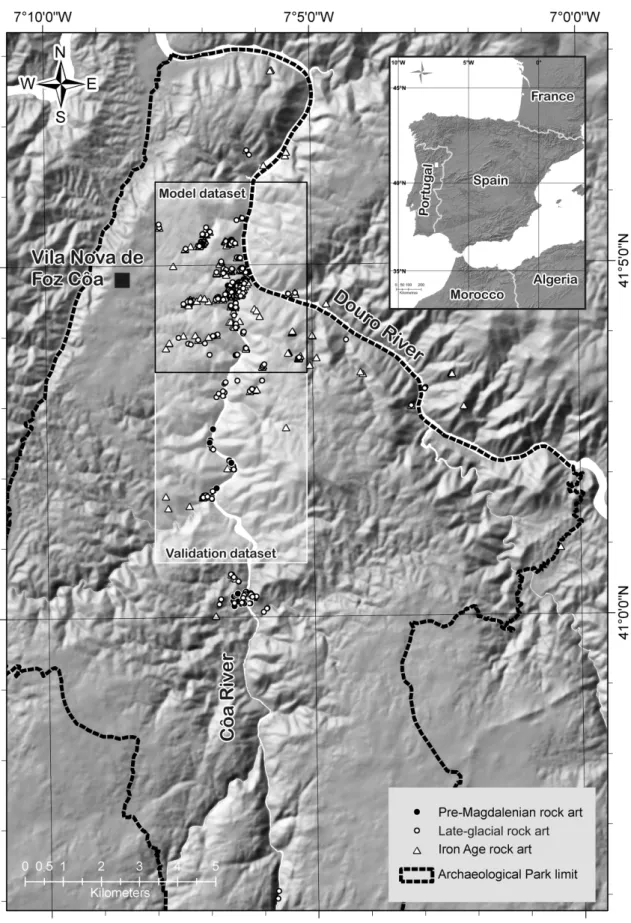
The open-air prehistoric rock art found in the Côa River Valley has been inscribed in the World Heritage List since 1998. The property is located along the last 22 km of the Côa River Valley, around its confluence with the Douro River and some tributaries in northeastern Portugal and corresponds to a buffer area of 200 km2 managed by the Côa Valley Archaeological Park (Fig. 1). Its rock art, mainly engravings, extends from the Upper Palaeolithic to the 1950s, with a peak during the Iron Age (Zilhão, 1995, 1997; Baptista, 1999, 2009). Both archaeological and palaeoenvironmental contexts indicate the existence of pre-Magdalenian and Magdalenian phases for the Upper Palaeolithic cycle of this rock art (Aubry and Baptista, 2000; Aubry and Sampaio, 2008; Aubry et al., 2010).
In a previous paper, we proposed that the pre-Magdalenian phase (> 19,000 yr) of the Côa River Valley open-air rock art, mostly distributed at the boundary between the rocky valley slopes and the floodplain, suffered freeze-thaw weathering during two Late-glacial cold events dated between ca. 18,000 yr to ca. 16,000 yr and ca. 12,000 yr and that rock art panels were (and some still are) buried by colluvial and alluvial deposits in the lower part of the Côa hydrographic basin (Aubry et al., 2010). This geoarchaeological approach permitted better assessments of the preservation processes and interpretations of the oldest rock art phase and its distribution. However, the situation of the post-Last Glacial Maximum (LGM) engravings, which were assigned by comparison with the portable art recovered in stratigraphical unit 4 of the Fariseu site and dated by luminescence and 14C methods to the 10,800-12,400 cal yr BP interval (Aubry and García Diez, 2001; Aubry and Sampaio, 2008; Aubry, 2009; Aubry et al., 2010; Baptista, 2008), is quite distinct. The rock art panels of this phase are detected not only at the interface with the alluvial plain but also along the slopes of the lower portion of the Côa and Douro River Valleys, where it forms discrete clusters along the rivers and their tributaries, mostly on the left margin, and mainly exposed to the southeast (Baptista and García Diez, 2002; Baptista and Reis, 2008) (Fig. 1). This clustering and orientation pattern has been interpreted as reflecting the artists’ choice (Baptista and García Diez, 2002; Fernandes, 2010).
Fig. 1 Location map of the study area. Spatial distribution of the Pre-Magdalenian, Late-glacial and Iron Age rock art phases in the
This study had three main objectives: (1) to establish, by direct field observation of un-engraved and engraved panels, the influence of geological setting, weathering and human factors on the present-day distribution of the rock art stylistically assigned to the Late-glacial (Aubry and Sampaio, 2008; Aubry et al., 2010) in contrast to that of a subsequent phase of open-air rock art assigned to the Iron Age (ca. 2500 yr) through stylistic comparison with Iberian iconography in pottery, jewellery and stelae (Zilhão, 1997; Luís, 2009a, b); (2) to develop a general method to integrate geographical information system (GIS) tools with a pair-wise comparison matrix and frequency probabilistic procedure to compute a predictive model for the study area, aiming at the identification of areas where it is probable that rock art panels were exposed, are still preserved and, thus, were possibly engraved during the Late-glacial and after; (3) to produce a prototype Côa panel formation and preservation (CPFP) predictive model map to guide survey and heritage management in the Côa and Douro River Valleys and other territories with similar geological and climatic settings.
2. Geological setting at regional scale
The lower Côa River Valley and its confluence with the Douro River corresponding to the Alto Douro region is geologically located in the northern sector of the Central Iberian Geotectonic Zone and is part of the Iberian Hercinian Massif, the latter of which consists of the most continuous fragment of Variscan basement in Europe (Ribeiro, 1974, 1981; Ribeiro et al., 1979). The regional geology (Ribeiro, 1974; Silva et al., 1989; Ribeiro et al., 1990; Silva and Ribeiro, 1991; Ribeiro, 2001; Pereira, 2001; Pereira, 2006) is comprised of widespread outcrops of intensely folded and faulted metasedimentary rocks (schist, greywacke and quartzite) intruded by volcanic rocks (granite) ranging in age from the Precambrian to the Ordovician (Cabral, 1989; Silva and Ribeiro, 1991; Carvalho, 1992; Ribeiro, 2001). Both granitic and metasedimentary rocks are crossed by quartz, pegmatite and rhyolite dikes, following the main regional tectonic structures. Tertiary and Quaternary sedimentary rocks (mainly sandstone and conglomerates), thinly fill some topographic depressions or cover the Palaeozoic and Precambrian basement, as well as the Hercinian granitoids (Fig. 2a).
Fig. 2. Geological setting of the study region in northeastern Portugal from Carta Geológica de Portugal 1:500,000 scale (Carvalho,
1992). VFZ = Vilariça Fault Zone. The arrows indicate: the sense of slip (a); coverage area and parameters of Landsat scenes used in this study (b); colour composite of multispectral Landsat 7 ETMplus (Enhanced Thematic Mapper plus) bands 7,4,2 (c); panchromatic Landsat 7 ETMplus band 8 (d); pan-sharpened colour composite image using resolution merging process with (c) and (d) images (e); applying directional filters (i.e., N-S, E-W, N-E and N-W), with size 3 x 3 in pixel size, on the pan-sharpened colour composite image (f).
The tectonic structure is characterised by a fold and thrust belt formed in the Variscan Orogeny. The most remarkable structure crossing the study area, considered the major tectonic structure in northeastern Portugal, is the Vilariça segment of the NNE-SSW trending Manteigas-Vilariça-Bragança fault (called here Vilariça Fault Zone - VFZ) (Fig. 2a). The VFZ exhibits left-lateral strike-slip offsets in the basement rocks and has been considered by several authors as a Late-Variscan fault (Arthaud and Matte, 1975; Ribeiro, 1974, 1981; Ribeiro et al., 1979; Silva and Ribeiro, 1991; Ribeiro et al., 1996; Jabaloy et al., 2002), which was successively reactivated during the Alpine Orogeny, as documented by displacements affecting Cenozoic cover sediments and late Quaternary stream deflections (Cabral, 1985, 1995; Marques et al., 2002; Rockwell et al., 2009; De Vicente et al., 2011).
The relief of the study region shows an irregular topography as a consequence of rigid tectonic and differential erosion related to the down-cutting of the Douro River and its left margin tributaries. Geomorphologically, this area is located in the northern part of the so-called Iberian Meseta – westerly limited by the tectonic alignment Manteigas-Vilariça-Bragança – which is composed by the juxtaposition of extensive peneplanation surfaces, mainly dating to the Cenozoic (Ferreira, 1978; Ribeiro et al., 1987; Cunha and Pereira, 2000; Pereira, 2006; Santos, 2005;). Residual hills are found locally to the east of the VFZ, often related to the outcropping of harder lithotypes (mostly quartzite). Other important morpho-structural features at the regional scale are the Longroiva and Vilariça grabens, interpreted as pull-apart basins resulting from reactivation of the VFZ during the Cenozoic (Cabral, 1985, 1989, 1995; Santos 2005).
East of the VFZ, the Meseta surface, which mainly dips to the northwest, is dissected by a deeply incised hydrographic network formed by tributaries of the Douro River, which flows some hundreds of metres below the highest planation surfaces. Most of these tributaries show a rectilinear path according to the main tectonic structures of the region, which are mostly oriented NNE-SSW and, subordinately, ENE-WSW, NW-SE and N-S (e.g., the Côa River Valley) (Figs. 1 and 2a).
3. Rock art support formation and weathering overview
The Côa River Valley open-air engravings, which were made by pecking, abrasion and fine-line incision, are preserved on naturally sub-vertical surface panels that, according to Zilhão (1995, 1997), correspond
to tectonic fracture/joints offsets in the Precambrian-to-Cambrian schist and greywacke basement as well as Hercinian granitoids.
Locally, gravity-induced rocky movements along the valley slopes are paradoxically responsible for rock art panel exposure but also for their potential destruction. The same forces that expose rock art panel surfaces along some valley slopes also gradually produce block detachment, thus exposing other inner fracture/joint surfaces in a process known as toppling (Rodrigues, 1999).
Besides this meso-scale evolution, other smaller-scale processes and mechanisms concur for the degradation of rock art panel surfaces based on the rock’s cohesion. Schistosity developed in the schist and greywacke rocks during the Hercinian Orogeny is one of them. Erosion by fracture and exfoliation affects the outer limits of most of the panels and preferential erosion along pelitic and less cohesive stratigraphic levels was also noted. Plaque loss (1 cm to 2 cm width) is yet another form of panel erosion loss observed along some areas of the surface. These mechanisms were interpreted as being the consequence of a mechanical debility underneath the surface (Rodrigues, 1999). Because weathering processes sometimes superficially harden the rock with weathering-derived cements such as silica (Pope, 2000), another interpretation (Zilhão, 1995; Dorn, 1997; Pope, 2000; Chauvière et al., 2009) is that a process of siliceous-metallic skin formation follows the exposure of panel surfaces and that such films are responsible for the preservation of the surfaces and the representations subsequently inscribed on them. Plaque is lost due to the cooperative action of differentials between the outer surface of the panel, which is under the influence of such skins, and the inner part, which is not. Such cements have been identified in the Côa River Valley panel surfaces in petrographic thin sections in the form of films mostly composed of silica and aluminium (Dorn, 1997) but also clay, iron and titanium (Chauvière et al., 2009). These films are formed by the migration of such elements from inside the outcrop towards the panel surface and act as a varnish that preserves the surface and its rock art. Despite the coatings, contact with the biosphere may nonetheless entail preferential erosion by the dissolution of silica and disaggregation of altered components, such as feldspars, creating rugged surfaces. Other mineral alterations include pitting, the formation of micro-cavities due to the dissolution of silica, and the disappearance of biotite megacrystals (Rodrigues, 1999).
Biotic weathering of rock art also occurs (Doehne and Price, 2010). Lichens and endolithic organisms living on and inside the rocks interact with it and cause biodeterioration (Syers and Iskandar, 1973;
Adamo and Violante, 2000). This weathering process occurs in two forms: biogeophysical and biogeochemical, both of which are based on the lichen-substrate interaction. Biogeophysical weathering is the result of the mechanical action of lichen thalli and hyphae on the rock causing disaggregation and fragmentation of the surface (Adamo and Violante, 2000). Chemical weathering is more important and is based on dissolution processes or precipitation and the formation of new minerals by the generation of oxalic acid, carbonic acids, and other acids capable of chelating ions such as calcium (Doehne and Price, 2010). An ecological succession has been determined as developing through seven stages, beginning with bacteria colonisation, followed by fungi, algae, lichens, moss and other bryophytes and finally vascular plants (Caneva et al., 1991). Following lichen colonisation, bryophytes, namely Musci, continue this biodeterioration process, contributing to the same biogeophysical and chemical mechanisms (Altieri and Ricci, 1997; Herrera et al., 2004).
Lichen and bryophyte colonisation and growth are the result of a wide range of factors related to climate (temperature, relative humidity, solar radiation, rainfall and atmospheric pressure), surface orientation (rain water, light exposure, wind direction), support (texture, porosity, permeability, hardness and nutrients) and air quality. Among these variables, the climatic, especially micro-climatic, are most important, and small-scale variation in terms of humidity and solar radiation has a great impact on lichen growth (Rattazzi and Romão, 1994).
4. Materials and methods
4.1. Geological structural analysis from regional to field scales
To define the structural and kinetic forcing of rock art panel formation in the study area, we used Landsat imagery because of its synoptic view over large areas, which enable the detection of regional geological features. In particular, lineament analysis of remotely sensed data, either by visual or automatic interpretation, is a valuable source of information for studying the structural setting of a region (Mah et al. 1995; Karnieli et al., 1996; Süzen and Toprak, 1998).
In this study, a Global Landsat Orthorectified Pan-sharpened ETMplus (Enhanced Thematic Mapper plus) image, displayed as a 7,4,2 (RGB) colour composite, and a set of orthorectified panchromatic and
multispectral scenes of Landsat 7 ETMplus sensor (USGS, 2001) were used. These images, acquired in June 2001, cover the northeastern part of Portugal (Fig. 2b). The source of these datasets was the Global Land Cover Facility (www.landcover.org), downloaded from the USGS Global Visualization Viewer (http://www.glovis.usgs.gov/; last access January 2011). The images downloaded from the Glovis web server included the Standard Terrain Correction (Level 1T), with systematic radiometric and geometric accuracy corrections based on ground control points, and a Digital Elevation Model (DEM) for topographical accuracy. Neither atmospheric nor topographic correction was applied.
The ETMplus sensor was launched on 15 April 1999 aboard the Landsat 7 satellite and has been in operation since 1999. The ETMplus has six reflective bands located in the visible and short-wave infrared (SWIR) spectrum with a spatial resolution of 30 m. The ETMplus sensor is based on the Thematic Mapper (TM) sensors onboard Landsat 4 and Landsat 5. Changes to the ETMplus sensor include a new panchromatic band, an increase in the spatial resolution of the thermal band to 60 m compared to 120 m in TM, and the addition of two calibration devices to monitor on-orbit sensor changes (Markham et al., 1997).
The enhanced spatial resolution of the panchromatic band (8) of Landsat ETMplus images provides a large amount of useful information for geological lineament analysis. However, the complementary information of lower-resolution spectral data (multispectral bands of Landsat ETMplus images) can improve the detectability of geological lineaments and increase the accuracy of results (Ricchetti and Palombella, 2007). An effective way to combine these spatial and spectral data at different resolutions is with image fusion techniques (Pohl and Van Genderen, 1998; Zhang, 2004). The pan-sharpening process involves a resolution merging process, which allows for the fusion of the higher-resolution panchromatic band (8) with selected lower-resolution multispectral bands (7,4,2), which enhance geological features, to create a higher-resolution (‘sharpened’) colour image (Fig. 2c, d, e). The colours of the pan-sharpened images remain almost unchanged with respect to the original colour composition (7,4,2) bands. For the interpretation of the geological lineaments, several digital enhancement and detection techniques were applied on the pan-sharpened colour image. Four main direction filters (i.e., S, E-W, E and N-W) measuring 3 x 3 in pixel-size were used in this study (Fig. 2f).
A visual lineament interpretation of both filtered and pan-sharpened images was carried out on-screen using GIS tools. All of the recognised geological features were reported in a georeferenced vector file to produce a lineation map.
A spatial statistical analysis of the lineament orientation was performed to analyse their frequency and main direction. The lineament frequency and length were charted on rose diagrams for directionality analysis. Because lineaments were detected at different scale levels, their lengths are highly variable. Therefore, rose diagrams based on lineament length are more reliable than those based on frequency. This regional framework was subsequently completed by direct field observation on 11 selected valley slope areas and the measurement of a total of 713 panels. Field analysis included the measuring of strike and dip of fracture/joints (i.e., surfaces, or partings in a rock where there has been no displacement), both engraved and un-engraved, based on a selection representative of the density of panel outcrops for each area surveyed. Similar strike measurements were separated by a minimum distance of ca. 10 m. Each of these panels were described and georeferenced in the field. The strike and dip data obtained were used to produce equal-area stereoplots of poles in lower hemisphere projections.
4.2. Assessment of fracture/joint surface weathering
Each panel (corresponding to exposed fracture/joint surfaces) was also described in terms of surface weathering, which was evaluated macroscopically, following the four states (recent, fresh, moderate and highly weathered) previously defined for the study of the region’s rock art (Chauvière et al., 2009). Biodeterioration was specifically described on 253 rock art panels along three transects. The percentage of lichen covering the surface, their genus (following the list proposed by Romão, 1999), and bryophyte colonisation were also evaluated.
4.3. Côa panel formation and preservation predictive model
Predictive modelling, widely used in geology and geography since the 1970s, has also been applied in archaeology and cultural resource management (Verhagen, 2007). It was first developed in the United States by government agencies needing to manage cultural resources in large regions with few known data to predict the location of archaeological sites based on surveys carried out over small areas (Wheatley and Gillings, 2002). Predictive modelling assigns known archaeological data patterns to
unknown times or spaces (Warren and Asch, 2005) and is rooted in the ecological ‘New Archaeology’ principle that states that settlement is mainly determined by environmental factors (Verhagen, 2007) and that these natural variables continue, at least indirectly, to influence current environmental data (Warren and Asch, 2005). Such models can be based on two types of information: (1) either they are based on theory about the distribution of archaeological data and therefore are deductive, or (2) they are inductive, relying on empirical observation (Wheatley and Gillings, 2002). In reality, both approaches are not mutually exclusive (Verhagen, 2007; Wheatley and Gillings, 2002). In this study, we followed an inductive approach.
The representation and preservation of both open-air and cave art motifs directly depends on the complex interactions between the natural support, which is determined by geology, and environmental variations prior to and following the moment of their production (Doehne and Price, 2010). In this study, the selection of the variables used to build the CPFP predictive model was based on direct field observations carried out in an area of ca. 20 square kilometres of the Côa River Valley around its confluence with the Douro River (Fig. 1).
The archaeological input data were represented by the spatial distribution of 430 rock art panels. These data were extracted from the Côa Valley Archaeological Park database established by Mário Reis’ survey (point-vector format at a 1:10,000 scale; Baptista and Reis, 2008). All of the panels submerged by the Pocinho dam reservoir around the confluence of the Côa and Douro Rivers (Fig. 2a) were withdrawn from this set, as the influence of this factor is difficult to constrain and the topography of the flooded area was unavailable to us. Point-vector format data were mapped as raster-based features with a common pixel size of 5 m x 5 m. Because some rock art panels were less than 5 m long, the initial data generated only 421 raster pixel rock art occurrences.
A DEM with a pixel size of 5 x 5 m was generated in GIS from digital topographic and hydrographic contour lines (vector data obtained from digitised topographic maps of Portugal at the 1:10,000 scale, by the Instituto Geográfico Português). This DEM was subsequently used to derive a number of variables in raster format with a pixel size of 5 m x 5 m: slope gradient (slope), down-slope direction (aspect), solar radiation and cost-weighted distance (CWD) to watercourses. The influence of slope on the exposure and conservation/destruction of the rock art panels is clearly related to tectonic controls and, in some cases, consequent landslide occurrences. In turn, aspect controls slope temperature and humidity, which
influence the type of surface weathering. Solar radiation, calculated using a whole year’s (2010) worth of with monthly intervals (sky size resolution of 200 cells, latitude of 45˚, day interval of 14, hour interval of 0.5), was chosen to determine the differential weathering affecting panel surfaces exposed on opposite margins of watercourses. The CWD to watercourses was selected as a variable because the observed distribution of rock art panels revealed clear proximity to local streams.
Before the calculation, the study area was divided into two datasets (model and external validation) of equal area and same geological characteristics (Fig. 1). However, model and validation areas show an archaeological difference. Although Late-glacial and Iron Age rock art are present in both areas, they are more common in the model area, and the pre-Magdalenian motifs are only present in the validation area (Aubry and Baptista, 2000; Aubry et al. 2010). In terms of CPFP predictive model building, these differences are not relevant. In fact, validation of the CPFP predictive model for the post-LGM phase in areas where an earlier Upper Palaeolithic phase is also preserved represents an added strength, proving that the model can be applied to different cultural phases (bearing in mind that our aim is to identify susceptible areas for panel formation and surface conservation regardless of whether they are or when they were engraved, in the Côa River Valley, where the different artists engraved different motifs, sometimes with different techniques, but always on the same types of rock panels).
The assignment of weights to the chosen variables according to their relative importance in explaining the distribution and conservation of rock art panels was based on conventional weighting methodologies in which numerical values assigned to each variable and their categories or classes, generally on an ordinal scale from 1 to 101 (or from 1 to 9). The numerical values assigned to the chosen variables are termed weights, and those assigned to each category or classes of a variable are termed ratings. Higher numerical values of weights or ratings indicate greater relative importance. Weights and ratings are frequently assigned based on expert experience and knowledge of the area under investigation. It is important to note that these weighting systems are highly subjective and may contain implicit biases. To minimise subjectivity and bias in the weighting and rating-assignment process, several quantitative methods can be applied, including statistical analysis, deterministic analysis, probabilistic models, distribution-free approaches and frequency analysis (among others).
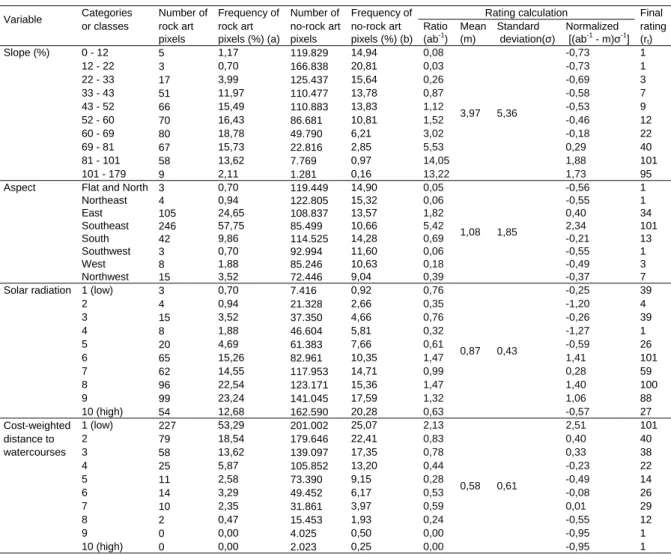
In this study, using the frequency-ratio model, we assigned ratings to the categories or classes of each variable based on their spatial relationships with the occurrence of rock art pixels (i.e., the ratio of the frequency occurrence of rock art pixels and the frequency of non-occurrence of rock art pixels), as shown in Table 1. This ratio expresses the proportional relevance of areas with the occurrence or non-occurrence of rock art; a value of 1 indicates equal proportions and is used as a reference mark. A ratio greater than 1 indicates that the variable category (or class) is more important to the occurrence of rock art panels. A ratio less than 1 indicates that the variable category (or class) is less important in explaining the occurrence of rock art panels. The mean and standard deviation of the ratio-based rating values were calculated for each variable. A normalisation procedure was used for easier interpretation. Final ratings (rt) for the categories of each factor were obtained by transforming the normalised ratings to an ordinal
scale with values from 1 to 101 (Table 1).
Weight assignment was performed using a pair-wise comparison matrix (qualitative method), as described by Saaty (1990, 1994) and Saaty and Vargas (2001). The method employs an underlying 9-point recording scale to rate the relative importance of each criterion on a one-to-one basis (Malczewski, 1999). For better map presentation purposes, the scale assigns a linguistic expression to each corresponding numerical value (Table 2). When using this approach, it is commonly accepted that taking numerical values and assigning them such linguistic expressions that translate into an imprecise terminology creates great ambiguity regarding the results. The numerical values are quantified translations useful for calculating variable weights, and the validity of the numerical values may best be judged by the variable weights and the consistency of the calculation process (Ayalew et al., 2004). Pair-wise comparison, however, is subjective, and the quality of the results is highly dependent on expert judgment.
The results of the pair-wise comparison matrix and the variable weights are shown in Table 2. The quality of the comparison is described by the consistency ratio (CR), which is the ratio between the matrix’s consistency index and a random index. This ranges from 0 to 1. A CR close to 0 indicates the probability that the matrix’s rating was randomly generated. Saaty (1990) recommended a CR<0.1 for comparisons to be valid. The CR in this study was 0.04. The mean and standard deviation of the assigned weight values were calculated. A normalisation procedure was used for easier interpretation. Final weights (wt)
for each variable were obtained by transforming the normalised weights to an ordinal scale with values from 1 to 101.
Table 1. Probabilistic ratings procedure for the different categories of variables used to build the Côa panel formation and
preservation (CPFP) predictive model (rt = normalised ratings transformed on an ordinal scale of values from 1 to 101).
Variable Categories Number of Frequency of Number of Frequency of Rating calculation Final
or classes rock art rock art no-rock art no-rock art Ratio Mean Standard Normalized rating
pixels pixels (%) (a) pixels pixels (%) (b) (ab-1
) (m) deviation(σ) [(ab-1 - m)σ-1 ] (rt) Slope (%) 0 - 12 5 1,17 119.829 14,94 0,08 3,97 5,36 -0,73 1 12 - 22 3 0,70 166.838 20,81 0,03 -0,73 1 22 - 33 17 3,99 125.437 15,64 0,26 -0,69 3 33 - 43 51 11,97 110.477 13,78 0,87 -0,58 7 43 - 52 66 15,49 110.883 13,83 1,12 -0,53 9 52 - 60 70 16,43 86.681 10,81 1,52 -0,46 12 60 - 69 80 18,78 49.790 6,21 3,02 -0,18 22 69 - 81 67 15,73 22.816 2,85 5,53 0,29 40 81 - 101 58 13,62 7.769 0,97 14,05 1,88 101 101 - 179 9 2,11 1.281 0,16 13,22 1,73 95
Aspect Flat and North 3 0,70 119.449 14,90 0,05
1,08 1,85 -0,56 1 Northeast 4 0,94 122.805 15,32 0,06 -0,55 1 East 105 24,65 108.837 13,57 1,82 0,40 34 Southeast 246 57,75 85.499 10,66 5,42 2,34 101 South 42 9,86 114.525 14,28 0,69 -0,21 13 Southwest 3 0,70 92.994 11,60 0,06 -0,55 1 West 8 1,88 85.246 10,63 0,18 -0,49 3 Northwest 15 3,52 72.446 9,04 0,39 -0,37 7
Solar radiation 1 (low) 3 0,70 7.416 0,92 0,76
0,87 0,43 -0,25 39 2 4 0,94 21.328 2,66 0,35 -1,20 4 3 15 3,52 37.350 4,66 0,76 -0,26 39 4 8 1,88 46.604 5,81 0,32 -1,27 1 5 20 4,69 61.383 7,66 0,61 -0,59 26 6 65 15,26 82.961 10,35 1,47 1,41 101 7 62 14,55 117.953 14,71 0,99 0,28 59 8 96 22,54 123.171 15,36 1,47 1,40 100 9 99 23,24 141.045 17,59 1,32 1,06 88 10 (high) 54 12,68 162.590 20,28 0,63 -0,57 27 Cost-weighted 1 (low) 227 53,29 201.002 25,07 2,13 0,58 0,61 2,51 101 distance to 2 79 18,54 179.646 22,41 0,83 0,40 40 watercourses 3 58 13,62 139.097 17,35 0,78 0,33 38 4 25 5,87 105.852 13,20 0,44 -0,23 22 5 11 2,58 73.390 9,15 0,28 -0,49 14 6 14 3,29 49.452 6,17 0,53 -0,08 26 7 10 2,35 31.861 3,97 0,59 0,01 29 8 2 0,47 15.453 1,93 0,24 -0,55 12 9 0 0,00 4.025 0,50 0,00 -0,95 1 10 (high) 0 0,00 2.023 0,25 0,00 -0,95 1
The classes of the variables were classified used natural break method in GIS.
Table 2. Pair-wise comparison matrix for calculating the weights of variables used for build the Côa panel formation and
preservation (CPFP) predictive model. (wt = normalised weight transformed on an ordinal scale of values from 1 to 101).
Variable Slope Aspect Solar CWD to Assigned Mean Standard Normalized Final
radiation watercourses weight (a) (m) deviation (σ) [(a - m)σ-1
] weight (wt) Slope 1 0,44 0,25 0,22 0,86 101 Aspect 1 1 0,44 0,86 101 Solar radiation 1/7 1/7 1 0,08 -0,77 11 CWD to watercourses 1/8 1/8 1/3 1 0,04 -0,95 1
The consistency ratio (CR) for this study was 0.04
CWD = Cost weight distance
Comparison 9-point qualitative scale. 1 = equal importance (contribution to objective is equal); 3 = Moderate importance (attribute is slightly favored over another); 5 = Strong importance (attribute is strongly favored over another) ; 7 = Very strong importance (attribute is very strongly favored over another); 9 = Extreme importance (evidence favoring one attribute is of the highest possible order of affirmation); 2, 4, 6, 8 = Intermediate values (when compromise is needed).
5. Results
5.1. Structural and kinetic forcing for the rock art panels formation
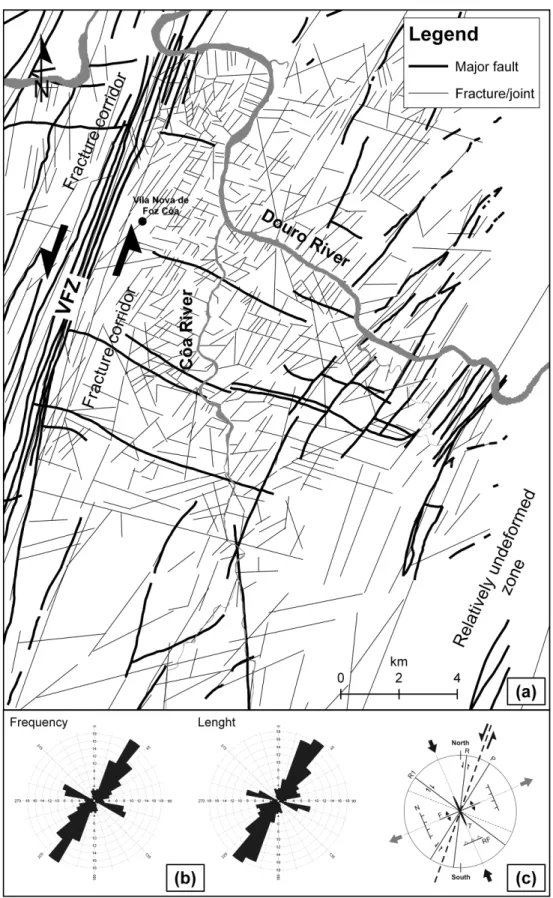
All lineations detected in the processed satellite images, excluding the lithological boundaries, were interpreted as geological features and are reported in Fig. 3a. Major faults were deduced from the literature (Carvalho, 1992; Silva and Ribeiro, 1991; Cabral, 1995; Ribeiro, 2001) and confirmed by satellite image observations; in some cases, they were supplemented by field surveys. Undifferentiated fracture/joints were detected by processed satellite imagery and, in some cases, by field survey.
The systematic fracture/joints detected form regular, planar and sub-parallel sets and most are sub-vertical and opening mode-I feature (Hancock, 1985). From the regional to the field scale, the study area reveals the relationships between fault zones of different orders of magnitude: (1) a regional fault zone represented by one or few lineaments, observed at the regional scale (map view; Fig. 2a); (2) when increasing the scale of observations, the internal structures of regional fault zones, of both lower order (map view) and higher order, can be specified and other fault zones recognised, the latter are formed by several fault zones separated by blocks or lenses of relatively undeformed zones with fracture corridors at the interface between these and the fault zones (Fig. 3a); (3) typical fault zone structures with fault cores surrounded by damage zones at the field scale (non-map view).
All orientation lineament sets observed at the regional scale are also present on a larger scale, where the occurrence of new orientation sets, trending NE-SW and N-S, is observed, with minor structure also visible (i.e., fracture corridors and joints; Fig. 3a). Using the frequency statistical distribution analysis, the rose diagrams of all detected lineaments show a main orientation along the NNE-SSW direction with four secondary orientations: ESE-WNW, NE-SW, N-S and ENE-WSW (Fig. 3b). The fact that orientation sets sub-parallel to the major faults of the area (i.e., NNE-SSW, NE-SW and ESE-WNW) show higher length distributions suggests a scale-invariant tectonic system. On the contrary, fracture/joint sets that are not related to faults (i.e., N-S and ENE-WSW) show lower length distributions (Fig. 3b).
Fig. 3. Lineation map of the study area. The lineations detected by visual interpretation of all the processed Landsat images were
reported. Thick lines represent the major faults where the arrows indicate sense of slip and detected from the literature, supplemented by field surveys. The thin lines are fractures and joints detected by satellite images and, in some cases, are supplemented by field surveys. VFZ = Vilariça Fault Zone (a); rose diagrams with class interval of 10 degrees and population of 705 showing the statistical distribution based on lineament length and frequency detected by the satellite images analysis (b); arrangement of structures associated with a NNE-SSW sinistral shear zone (the VFZ) for the study region. R = synthetic riedel shears; R1 = antithetic riedel shears; N = normal faults; F = fold axis; RF = reverse faults; P = secondary synthetic shears; T = tensional fractures; short black arrows = sigma 1 (maximum compressive stress); short grey arrows = sigma 3 (maximum tensile
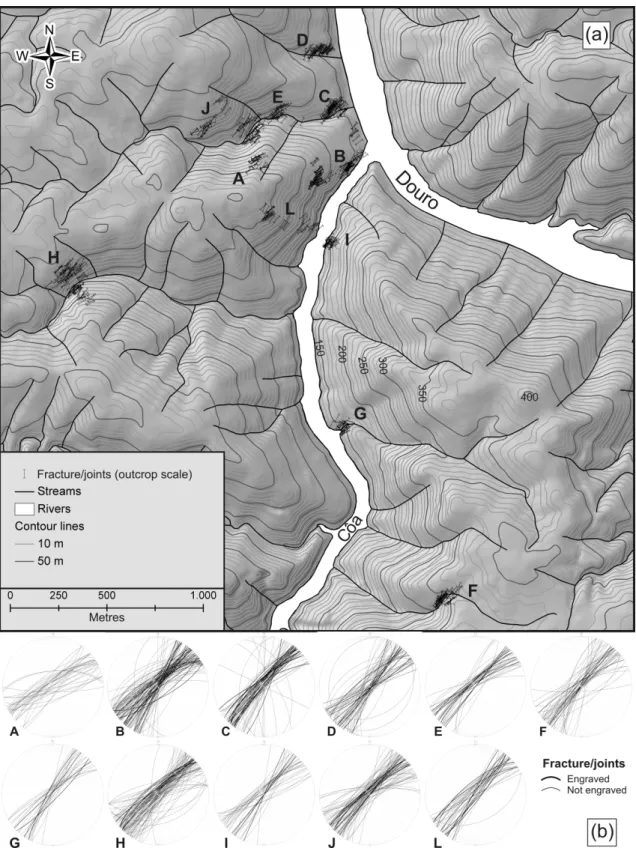
Fig. 4. Fracture/joints strike related to slope topography in the Douro/Côa confluence area (a); orientation in equal-area stereoplot of
poles to fracture/joints (engraved and un-engraved) measured in outcrops of the study area (local scale - no map view) (lower hemisphere projection was used) (b).
The spatial distribution of lineaments indicates that the general strike of the fracture/joint sets is NNE-SSW in the western part of the study region and NE-SW in the central part and to the east. These orientations are commonly sub-parallel to the respective major faults measured at the same site and corresponding to the NNE-SSW sinistral strike-slip VFZ. When sets of fracture/joints have the same orientation as a given fault, it is very likely that these discontinuities represent replicas of that fault formed by the same tectonic stress probably as a result of the release of the residual elastic strain energy preserved in the metasedimentary rocks.
The strike data of un-engraved and engraved panels measured at the field scale reveal the same statistical mean (Fig. 4). The hydrographical down-cutting was forced by this tectonic background and generated the progressive exposition of panels on opposite margins of the watercourse, i.e., facing either SE or NW. Such geologically forced orientation explains the absence of un-engraved panels (and, logically, of engraved ones as well) facing N, S, NE, SW, E and W in the area, independent of cultural choice.
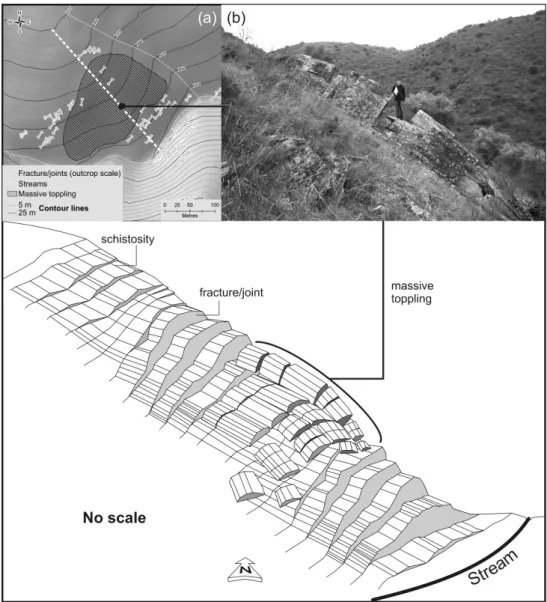
The confrontation of the measured strikes with their associated valley slope inclination indicates that the higher density of panel surfaces observed corresponds to the areas where the fracture-joint/strike tends to be perpendicular to the slope (Fig. 5). This correlation finds a simple physical explanation in the fact that the higher gravity forces imposed on the external compartment during the down-cutting process (toppling) correspond to this special condition. On the contrary, slopes facing NE and SW do not expose rock art panels but schistosity, which develops on the NW-SE vertical plane (i.e., oriented sub-perpendicular to systematic set of joints). The schistosity discontinuity is highly affected by freeze-thaw weathering, feeding slope deposits covering bedrock (Aubry et al., 2010). Such a condition is not favourable to panel exposition, and very few examples of highly weathered historic rock art (18th century onwards) are presently known in schistosity planes. Therefore, the exposure of vertical panels in this gravity/tectonic-induced system depends on two different variables: slope vs. fracture/joint orientations. In some localised slope areas, gravity forces are exerted such that a more important and general toppling process occurs, affecting large compartments from ca. 10,000 m2 to 20,000 m2. In such situations, fracture/joints are generally not observable, and bedrock is covered by slope deposits resulting from these massive landslides, bearing numerous schist fragments (Fig. 5). These fragments were generally exploited for the construction of the stone walls sustaining cultivated terraces in these areas.
Fig. 5. Theoretical scheme explaining rock art panel exposure and massive toppling as the result of the conjugation of fracture/joints
strike, schistosity of the geological basement (schist and greywacke), topographic slope terrain and stream directions (a). Example of massive toppling in an early stage (b).
5.2. Rock art panels distribution of different periods
Late-glacial rock art is easily separable from that of the Iron Age from both thematic and technical points of view. Nevertheless, both feature a similar spatial pattern across the study area (Fig. 6), and the cumulative percentage of each artistic phase, considered individually, do not reveal significant variation regarding each of the variables used to build the CPFP predictive model (Fig. 7). By itself, this fact is a strong argument against the hypothesis of human choice as a unique or even predominant factor in the explanation of the present distribution of the rock art of these periods, as the art was derived from very different societies (segmentary vs. hierarchical) with distinct modes of resource exploitation (nomad hunter-gatherer vs. sedentary agro-pastoral economies).
Fig. 6. Late-glacial and Iron Age rock art spatial distribution in the study region established by stylistic comparison: Vale de José
Esteves’ Panel 16 (inventory number of the rock art panels of the Côa Valley Archaeological Park) (a); portable art on schist slab from the stratigraphic unit 4 of the Fariseu site (dated by luminescence to between 11,000 yr and 12,000 yr and by 14C to 10,000-12,000 cal yr BP) (Aubry et al. 2010) (b); Vermelhosa’s Panel 3 (Baptista, 1999) (c); Vase painting from Numancia, Soria, Spain (Sopeña, 1995) (d); stele from Tona, Barcelona, Spain (Sanmartí and Grego, 2007) (e).
Field observation of the panels in three transects carried out in Vale do Forno (Côa River Valley tributary), Vale do José Esteves (Douro River Valley tributary) and Fonte Frieira (near the mouth of the
biodeterioration level (Fig. 8). These panels present a higher percentage of area covered by lichens (e.g.,
Aspicilia sp., Caloplaca sp., Lecanora sp., Parmelia sp., Physcia sp., Collema sp.) and bryophytes,
mainly mosses (e.g., Polytrichum commune, Scorpiurium circinatum) but also liverworts (e.g., Lunularia
cruciata).
Fig. 7. Cumulative percentage (%C) of different rock art phases in relation to the chosen variables used to build the Côa Panel Formation and Preservation (CPFP) predictive model. CWD = cost-weighted distance.
Of the factors impacting lichen growth patterns, support type (sub-vertical schist and greywacke panels) and air-quality factors can be considered invariant. However, that is not the case with climate and surface orientation. The lower Côa River Valley is part of the continental type ‘Alto Douro’ and ‘Beira interior’ climatic province (Ribeiro et al., 1994), with an average annual temperature around 11ºC and high thermal amplitudes. Summers are hot and dry, reaching up to 40ºC, and the winters are cold, sometimes reaching -10ºC. Rainfall is low during the summer but heavy during the autumn and winter, averaging 700 mm per year in the plateau areas but only 300 mm to 400 mm in the valley bottoms. Within this general framework, small variations in terms of micro-climate have widely recognised implications in terms of relative humidity and solar radiation. This is particularly so where shady and sunny sides of the same valley are concerned (Ayyad and Dix, 1964), but even in the shady sides field work revealed that the lichen genus present (e.g., Aspicilia sp.) requires a minimum amount of solar radiation. This is why some lichen-covered panels have restricted, sheltered areas devoid of lichen (Fig. 8). These data suggest
that the concentration of the rock art of both periods (Iron Age and post-LGM) on surfaces exposed to the southeast reflects the differential preservation of panels with the same tectonic direction but located on opposite margins of broadly east-west-oriented watercourses.
Fig. 8. Rock art panel surface conservation in relation to natural solar radiation, lichen and bryophyte colonisation along three transects: Vale de Forno (a); Vale de José Esteves (b); Fonte Frieira (c); Examples of substantial bryophyte colonisation in a non-sheltered surface of the panel (photo 1) and absence of lichen colonisation in a shaded area (photo 2).
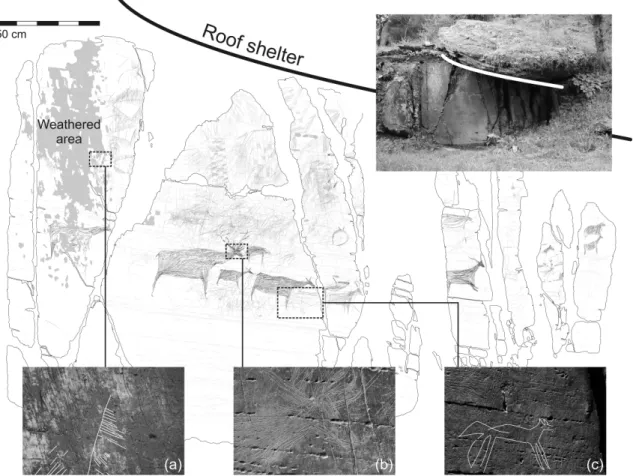
The chronology of the mechanical and biodeterioration observed could be defined from the examples of two panels from the Vale de José Esteves cluster. Panel 16 (inventory number of the rock art panels of the Côa Valley Archaeological Park) of Vale de José Esteves was the only panel known to date in this locality that presented both Late-glacial and Iron Age rock art exposed to the northwest. Only one other panel, assigned to the Iron Age, presented a similar sheltered location (Fig. 6). In contrast, the opposite margin shows 61 engraved panels. Panel 16 from Vale de José Esteves presents unique features. It corresponds to a shelter formed by a large schist slab that covers most of the decorated surface except for its left extremity (Fig. 9). Under the roof slab, the siliceous-metallic coating of the surface is present, and all the figures, either Palaeolithic (Fig. 9b) or Iron Age (Fig. 9c), present good preservation. On the contrary, engravings on the unsheltered part of the surface, composed of fine line triangular symbols and a striated red deer, present a very high degree of weathering manifested by the destruction of the siliceous coating of the rock surface and even the formation of cavities that cut the late Pleistocene motifs (Fig. 9a).
Fig. 9. Rock art Panel 16 from Vale de José Esteves partially protected by a rock shelter (tracing Baptista, 2009) with an example of Late-glacial sign affected by weathering (a); un-weathered Late-glacial red deer motif (b); un-weathered Iron Age canid motif (c).
Additional corroboration of this pattern comes from the fact that during field measurements a new panel with Late-glacial rock art, assigned number 631 (our field inventory numbering), was found upstream of Panel 16 from Vale de José Esteves. This is one of the only panels in this shaded area that is not affected by lichen or bryophyte colonisation due to its small size and position at the base of another rock shelter. Once again, panel microtopography explains why some surfaces are protected from lichen biodeterioration. A new Iron Age panel (inventory number 644) was also found under the same protected conditions.
Two distinct hypotheses can be proposed to explain the situation observed. First, one can suppose that good panel surfaces were available (and engraved) from the Late-glacial through to the Iron Age on non-sheltered panels of the valley side exposed to the northwest and have since been weathered. Alternatively, after 12,000 yr, most of the panels of the northwestern facing valley slopes may have already been too weathered for engraving to be possible.
Bearing in mind Panel 16 from Vale de José Esteves, the parsimonious hypothesis lies between these two propositions. In the most weathered area of this panel, which is not protected by the large roof slab, its Late-glacial motifs are partially destroyed, implying that the weathering of this part of the panel began
after the production of the art, i.e., after the end of the Pleistocene. On the other hand, because the Iron-Age-decorated surfaces avoid areas that are weathered or lichen-covered, a peak in the surface degradation process, which is ongoing, can be posited to coincide with the early-middle Holocene.
5.3. Côa panel formation and preservation maps (model validation and verification)
The CPFP value for each pixel of the model area was obtained using the following equation: CPFP model value = Σrtwt, where rt is the rating for the categories or classes of each variable and wt is the weight
assigned for each variable. The CPFP model value represents the relative susceptibility of each pixel of the model area to the formation and preservation of rock art panels. The natural-breaks classification procedure was used to classify CPFP model values into five susceptibility classes (very low, low, moderate, high, and very high) to produce the CPFP model map in raster format with a pixel size of 5 m x 5 m (Figs. 10 and 11). These classes were based on natural groupings inherent in the data. The GIS software identified break points by picking class breaks that best grouped similar values and maximised the differences between classes. The features were divided into classes with boundaries that were set when there were relatively large jumps in the data values.
The majority of the model area presents low CPFP values (40.5%), followed by very low (19.5%), moderate (16.7%), high (12.1%), and very high (11.2%) values (Fig. 11). As expected, the CPFP predictive model map in Fig. 11 shows that high and very high CPFP values are mostly localised near the left banks of the Côa and the Douro rivers, as a logical consequence of the tectonic fracture framework and the organisation of subsequent Quaternary hydrographic down-cutting. A few areas with high and very high CPFP values can be identified near the right banks of the Douro River as well. These Douro areas follow the exact same pattern as than on the left banks of the Côa tributaries: high slopes along NE-SW direction and exposure to southeast. Some areas with high values in the CPFP model map had already been destroyed by recent deep agricultural disturbance related to vine plantation, and the predictions made could not be verified as a result.
Fig. 10. Flow diagram showing the methodology used in this study to build the Côa panel formation and preservation (CPFP)
predictive model.
External environmental input datasets were used to validate the predictive model, and a CPFP validation map was constructed using the ratings and weights calculated and previously assigned (Fig. 12). The majority of the CPFP validation map is occupied by very low (41.6%), followed by low (35.5%), very high (12.4%), moderate (9.0%), and high (1.4%) values. The CPFP validation map reveals large areas, mostly on the left bank of the Côa River, where rock art has yet not been detected but should exist. Once more, on the right bank, one has to move farther from the Côa River to find areas with high and very high CPFP values. Several small valleys in the right bank of the Côa River have shown potential but lack survey, with very few exceptions already known in a similar position.
Fig. 11. Côa panel formation and preservation model map. Location of the areas surveyed during field verification (a, b) (see Fig.
Fig. 12. Côa panel formation and preservation validation map. Location of the area surveyed during field verification (c) (see Fig.
Fig. 13. Success-rate curves showing the cumulative percentage of rock art occurrence explained by the Côa panel formation and preservation model and validation ranks (read the text for more details).
The archaeological input data (rock art occurrences) were used to evaluate both the CPFP model and validation maps. When the calculated CPFP values of all pixels in the model and validation areas were compared with the pixels of the rock art datasets in GIS, success rate curves could be computed. The success rate curves result from the cross tabulation between the CPFP maps and the rock art map. These curves were used to evaluate the degree of model and validation fits. Thus, the areas under the curves were used to qualitatively assess the respective agreement. The calculated CPFP values of all pixels were sorted in descending order, and the ordered pixel values were divided into 100 classes with cumulative 1% intervals. The success-rate model and validation results are shown as a line graph in Fig. 13. For example, in the case in which all factors were used, the 90% to 100% class of the model area (i.e., areas with very high values; Fig. 11), for which the CPFP model values had a higher rank, could explain 43% of the entire rock art dataset. Furthermore, the 60% to 100% class of the model area (i.e., areas with very high and high values; Fig. 11), for which the CPFP model value had a higher rank, could explain 75% of the rock art dataset. To compare the results quantitatively, the areas under the curves were recalculated based on a total area of 1 indicating perfect agreement. Thus, the areas under the curves were used to
quantitatively assess the agreement of the CPFP model and validation maps. The agreement was 80% and 70%, respectively.
The final step in modelling the CPFP was to verify the availability of sub-vertical schist and greywacke panels with preserved surfaces, possibly with rock art, in two areas with high and very high CPFP model values and one area in a new territory where no rock art was previously known (Fig. 14). Cascalheira, located on the right bank of the Douro River, less than one kilometre upstream of the mouth of the Côa River, was chosen first (Fig. 14a). No rock art is known to date in this area. A brief survey revealed high correlation between areas with high and very high CPFP values and rock art. Twenty new panels, mainly with Iron Age rock art but also historic and a sole dubious Palaeolithic tracing, were discovered. The second area corresponds to a left bank tributary of the Douro (Fig. 14b) downstream of Canada da Moreira, a rock art site identified during the 1990s. Three small sub-areas were surveyed. One of them revealed anthropic destruction related to road construction and another related to massive toppling and thick colluvial deposition masking the bedrock. The last area surveyed showed a high correlation between areas with high and very high CPFP values and rock art bearing Iron Age and Palaeolithic motifs. However, one of the panels identified is located in an area with low CPFP values at the bottom of the valley, close to the stream, under sheltered conditions similar to those of Panel 16 from Vale de José Esteves. The third area, Vale de Iegas (Fig, 14c), is a tributary of the Piscos stream, one of the most significant rock art sites in the Côa River Valley. The eastern side of this area, which possesses very high CPFP values, presented a very high concentration of panels. However, panel surfaces were highly weathered, probably due to their higher altitude. Nevertheless, two panels were found with non-figurative but most likely Palaeolithic engravings. Three other panels with undated rock art were found in this area.
Fig. 14. Field verification of selected areas in both model and validation areas: Cascalheira (a), Canada da Moreira (b), Vale de Iegas (c), with two examples of Iron Age motifs identified at Cascalheira (photo 1) and Canada da Moreira (photo 2).
6. Discussion and conclusions
The Late-glacial and Iron Age rock art of the Côa and Douro River Valleys shows the same spatial distribution in several clusters along those rivers’ tributaries, mainly located on the margins exposed to southeast. The fact that both periods, which featured distinct environmental and cultural contexts, present similar spatial patterns in the study area is a strong argument against the hypothesis of human choice as an explanation for the current distribution of the rock art.
Instead, this spatial pattern is based on panel formation processes imposed by structural geology and Quaternary geomorphologic evolution combined with the differential preservation of the panels’ surfaces. We propose that such differential weathering is dependent on patterns of solar radiation, humidity, and resulting lichen and bryophyte colonisation operating at the individual valley scale. Variations at the micro-scale explain such exceptions as the Panel 16 from Vale de José Esteves and the newly discovered Panel 631. This process of differential biological and mechanical weathering of panels located on opposite valley slopes occurred between the end of the Pleistocene and the beginning of the Iron Age.
Our environment-based model identifies areas where panels have been available and are still preserved, making it possible to compare the spatial distributions of different cultural contexts (Late-glacial to the present) in areas with high and very high CPFP values to establish cultural constraints affecting the distributions beyond those posed by structural geology and weathering. In areas where these factors are invariant, they can explain neither why some panels were engraved and others were not nor why this region presents the largest known concentrations of open-air Palaeolithic and Iberian Iron Age rock art. In the Côa Valley itself, it is also clear that the differences in the spatial distribution of Late-glacial and Iron Age rock art on the one hand and those of the pre-Magdalenian phase on the other will have to be explained by cultural reasons and other preservation variables (Aubry et al., 2010).
These results are promising and allow for new assessments of the impact of cultural and preservation factors on the distribution of the Côa River Valley Palaeolithic and Holocene engravings. This approach can be applied to art from other times and located in other places, but one must bear in mind that models will depend on geological and environmental variables specific to different regions. In the Côa River Valley, the field verification of the CPFP predictive model showed that the model provides a useful
framework to guide future rock art surveys and in an area were anthropic destruction is increasing also provides a valuable tool for the cultural resource management of the World Heritage property located therein.
Acknowledgements
Field work was supported by the Instituto Português de Arqueologia and the Instituto de Gestão do Património Arquitectónico e Arqueológico of the Portuguese Ministry of Culture. English text revision was financially supported by the Centro de Estudos de Geografia e Ordenamento do Território (CEGOT) of Coimbra University. We would like to thank J. Zilhão (Department of Prehistory – University of Barcelona) for stimulating discussions and helpful remarks. Constructive comments by the three anonymous reviewers are gratefully acknowledged.
References
Adamo, P. Violante, P., 2000. Weathering of rocks and neogenesis of minerals associated with lichen activity. Appl. Clay Sci. 16 (5-6), 229–56.
Altieri, A., Ricci, S., 1997. Calcium Uptake in Mosses and its Role in Stone Biodeterioration. Int. Biodeterior. Biodegrad. 40 (2-4), 201-204.
Arthaud, F., Matte, P., 1975. Les décrochements tardi-Hercyniens du sud-ouest de L’Europe. Géométrie et essai de reconstitution des conditions de la déformation. Tectonophysic 25, 139-171.
Warren, R.E., Asch, D.L. 2005. A Predictive Model of Archaeological Site Location in the Eastern Prairie Peninsula, in: Westcott, K.L., Brandon, R.J. (Eds.), Practical applications of GIS for archaeologists: a predictive modeling kit. Taylor & Francis e-Library, Philadelphia, pp. 6-36. Aubry, T., 2009 (Ed.). 200 séculos da história do Vale do Côa: incursões na vida quotidiana do
caçadores-artistas do Paleolítico, Instituto Português de Arqueologia (Trabalhos de Arqueologia 52), Lisbon.
Aubry, T., Baptista, A.M. 2000. Une datation objective de l’art du Côa. La Recherche, Hors série 4, 54-55.
Aubry, T., García Diez, M., 2001. Actualité sur la chronologie et l’interprétation de l’art de la vallée du Côa (Portugal). Les Nouvelles de l’Archéologie 82, 52-57.
Aubry, T., Sampaio, J.D., 2008. Fariseu: new chronological evidence for open-air Palaeolithic art in the Côa valley (Portugal). Project Gallery. Antiquity 82 (316).
Aubry, T., Dimuccio, L.A., Bergadà, M.M., Sampaio, J., Sellami, F., 2010. Palaeolithic engravings and sedimentary environments in the Côa River Valley (Portugal): implications for the detection, interpretation and dating of open-air rock art. J. Arch. Sci. 37, 3306-3319.
Ayalew, L., Yamagishi, H., Ugawa, N., 2004. Landslide susceptibility mapping using GIS-based weighted linear combination, the case in Tsugawa area of Agano River, Niigata Prefecture, Japan. Landslides 1, 73-81.
Ayyad, M.A.G., Dix, R.L., 1964. An analysis of a vegetation-microenvironmental complex on prairie slopes in Saskatchewan. Ecol. Monogr. 34 (4), 421-442.
Baptista, A.M., 1999. No tempo sem tempo: A arte dos caçadores paleolíticos do Vale do Côa, Parque Arqueológico do Vale do Côa, Vila Nova de Foz Côa.
Baptista, A.M., 2008. Aspectos da arte magdalenense e tardiglaciar no Vale do Côa, in: Santos, A.T., Luís, L. (Eds.), Do Paleolítico à contemporaneidade: estudos sobre a história da ocupação humana em Trás-os-Montes, Alto Douro e Beira Interior (Fórum Valorização e Promoção do património regional: Actas das Sessões, Vol. 3). ACDR de Freixo de Numão, Oporto, pp. 14-31. Baptista, A.M., 2009. O paradigma perdido: O Vale do Côa e a arte paleolítica de ar livre em Portugal.
Edições Afrontamento; Parque Arqueológico do Vale do Côa, Porto.
Baptista, A.M., Reis, M., 2008. Prospecção da arte rupestre no Vale do Côa e Alto Douro portugés: Ponto da situação em julho de 2006, in: Balbín Behrmann, R. de (Ed.), Arte al aire libre en el Sur de Europa. Junta de Castilla y Léon, pp. 145-192.
Baptista, A.M., García, Diez, M., 2002. L’art paléolithique dans la vallée du Côa (Portugal): la symbolique dans l'organisation d'un sanctuaire de plein air, in: Sacchi, D. (Ed.), L’art paléolithique à l'air libre: le paysage modifié par l'image (Tautavel, Campôme, 7-9 octobre 1999). GAEP & GÉOPRE, Saint-Estève, pp. 187-205.
Cabral, J., 1985. Estudos de neotectónica em Trás-os-Montes oriental. Postgraduate thesis, Faculty of Science, Lisbon University.
Cabral, J., 1989. An example of intraplate neotectonic activity, Vilariça basin, Northeast Portugal. Tecton. 8, 285-303.
Cabral, J., 1995. Neotectónica em Portugal Continental. Mem. Inst. Geol. Min. 31.
Caneva, G., Nugari, M.P., Salvadori, O., 1991. Biology in the conservation of works of art, ICCROM, Roma.
Carvalho, D., (1992). Carta Geológica de Portugal, Escala 1: 500 000, Serviço Geológico de Portugal & Instituto Geográfico e Cadastral, Lisbon.
Chauvière, F.X., Tymula, S., Calame, A., Dechanez, I., 2009. Conservation et évolution des surfaces rocheuses gravées et piquetées de la Vallée du Côa: les données du projet ‘Quinta da Barca Sul’, in: Aubry, T. (Ed.), 200 séculos da história do Vale do Côa: incursões na vida quotidiana do caçadores-artistas do Paleolítico. Instituto Português de Arqueologia (Trabalhos de Arqueologia 52), Lisbon, pp. 443-477.
Cunha, P.P., Pereira, D.I., (2000) Evolução Cenozóica da area de Longroiva-Vilariça (NE Portugal). Ciências da Terra, Universidade de Lisboa, 14, 91-100
De Vicente, G., Cloetingh, S., Van Wees, J.D., Cunha, P.P., 2011. Tectonic classification of Cenozoic Iberian foreland basin. Tectonophysics 502, 38-61.
Doehne, E., Price, C.A., 2010. Stone Conservation: An overview of Current Research, Second ed. Getty Publications, Los Angeles.
Dorn, R.I., 1997. Constraining the Age of the Côa Valley (Portugal) Engravings with Radiocarbon Dating. Antiquity 71, 105-115.
Fernandes, A.P.B., 2010. Slope orientation of rock art sites in the Côa Valley, Portugal: A case study in the spatial distribution of open-air Upper Palaeolithic rock art, in: L’art pléistocène dans le monde/Pleistocene art of the world/Arte pleistocénico del Mundo, IFRAO Congress, September 2010 – Symposium: Pleistocene art in Europe (Pre-Acts).
Ferreira, A.B., 1978. Planaltos e montanhas do norte da Beira, Mem. Cent. Estud. Geogr. 4, Lisbon. Hancock, P.L., 1985. Brittle microtectonics: principles and practice. J. Struct. Geol. 7 (3-4), 437-457. Herrera, L. K., Arroyave, A., Guiamet, P., Gómez de Saravia, S., Videla, H., 2004. Biodeterioration of
peridotite and other constructional materials in a building of the Colombian cultural heritage. Int. Biodeterior. Biodegrad. 54, 135-141.
Jabaloy, A., Galindo-Zaldívar, J., González-Lodeiro, F., 2002. Palaeostress evolution of the Iberian Peninsula (Late Carboniferous to present-day). Tectonophysics 347, 159-186
Karnieli, A., Meisels, A., Fisher, L, Arkin, Y., 1996. Automatic extraction and evaluation of geological linear features from digital remote sensing data using a Hough transform. Photogramm. Eng. Remote Sens. 62, 525-531.
Luís, L., 2009a. ‘Per petras et per signos’: A arte rupestre do Vale do Côa enquanto construtora do espaço na Proto-história, in: Sanabria Marcos, P.J. (Ed.), Lusitanos y vettones: Los pueblos prerromanos en la actual demarcación Beira Baixa - Alto Alentejo - Cáceres. Junta de Extremadura & Museo de Cáceres (Memorias 9), Cáceres, pp. 213-240.
Luís, L., 2009b. Rock Art as Land Art: A Diachronic View of the Côa Valley (NE Portugal) Post-Palaeolithic Rock Art, in: Balbín Behrmann, R. de, Bueno Ramirez, P., González Antón, R., Arco Aguilar, C.D. (Eds.), Grabados rupestres de la fachada atlántica europea y africana: Rock Carvings of the European and African Atlantic Façade. Archaeopress (BAR Int. Series 2043), Oxford, pp. 129-147.
Markham, B.L., Boncyk, W.C., Helder, D.L., & Barker, J.L., 1997. Landsat-7 Enhanced Thematic Mapper Plus Radiometric Calibration. Can. J. Remote Sens. 23(4), 318−332.
Marques, F.O., Mateus, A., Tassinari, C., 2002. The Late-Variscan fault network in central –northern Portugal (NW Iberia): A re-evaluation. Tectonophysics 359, 255-270.
Mah, A., Taylor, G.R., Lennox, P., Balia, L., 1995. Lineament analysis of Landsat Thematic Mapper images, Northern Territory, Australia. Photogramm. Eng. Remote Sens. 61, 761-773.
Pereira, E., 2001. Carta Geológica de Portugal, escala 1: 200 000 e Noticia Explicativa da Folha 2, Instituto Nacional de Engenharia, Tecnologia e Inovação, Lisbon.
Pereira, D.M.I., 2006. Sedimentologia e estratigrafia do Cenozóico de Trás-os-Montes oriental (NE Portugal). Ph.D. thesis, Minho University, Braga, Portugal.
Pohl, C., Van Genderen, J.L., 1998. Multisensor image fusion in remote sensing: concept, methods and applications. Int. J. Remote Sens. 19, 823-854.
Pope, G.A., 2000. Weathering of Petroglyphs: direct assessment and implications for dating methods. Antiquity 74, 833-843.
Rattazzi, A., Romão, P.S., 1994. A biodegradação do granito nos monumentos megalíticos: a acção dos líquenes, Estudos Pré-históricos 2, pp. 343-347.
Ribeiro, A., (1974). Contribution à l´étude tectonique de Trás-os-Montes oriental. Mem. Serv. Geol. Port. 24 (N. Série), Lisbon.
Ribeiro, A., 1981. A geotraverse through the Variscan fold belt in Portugal, in: Zwart, H.J., Dornsiepen, U.F. (Eds), The Variscan Orogen in Europe. Geol. Mijnbouw 60, 41-44.
Ribeiro, A., Antunes, M.T., Ferreira, M.P., Rocha, M.P., Soares, A.F., Zbyszewski, G., Moitinho de Almeida, F., Carvalho, D, Monteiro, J.H., (1979). Introduction à la géologie générale du Portugal, Serviço Geológico de Portugal, Lisbon.
Ribeiro, A., Pereira, E., Dias, R., (1990). Allochthonous Sequences: Structure in the Northwest of the Iberian Peninsula, in: Dallmeyer, R.D., Martinez Garcia, E. (Eds.), Pre-Mesozoic Geology of Iberia. Springer-Verlag, Berlin, pp. 220-236.
Ribeiro, A., Baptista, R., Cabral, J., Matias, L., 1996. Tectonic stress pattern in Portugal Mainland and the adjacent Atlantic region (West Iberia). Tectonics 15(3), 641-659.
Ribeiro, M.L., (2001). Carta geológica simplificada do Parque Arqueológico do Vale do Côa, escala 1: 80 000, Instituto Geológico e Mineiro, Lisbon.
Ribeiro, O., Lautensach, H., Daveaus, S., 1987. Geografia de Portugal: Vol. 1: A Posição Geográfica e o Território, Ed. João Sá da Costa, Lisbon.
Ribeiro, O., Lautensach, H., Daveau, S., 1994. Geografia de Portugal: Vol. 2: O Ritmo climático e a paisagem, Ed. João Sá da Costa, Lisbon.
Ricchetti, E., Palombella, M., 2007. Production of Geological Lineament Map of Southern Italy using Landsat 7 ETM+ imagery. Boll. Soc. Geol. Ital. 126 (3), 567-572.
Rockwell, T., Fonseca, J., Madden, C., Dawson, T., Owen, L. A., Vilanova, S., Figueiredo, P., 2009. Palaeoseismology of the Vilarica Segment of the Manteigas-Braganca Fault in northeastern Portugal. Geol. Soc. Special Publ. 316 (1), 237-258.
Rodrigues, J.D., 1999. Conservação da Arte Rupestre do Parque Arqueológico do Vale do Côa. Relatório 241/99 – GERO. Unpublished report presented to the Instituto Português de Arqueologia. Romão, P.S., 1999. Colonização liquénica nas rochas xistosas do Parque Arqueológico do Vale do Côa.
Unpublished report presented to the Parque Arqueológico do Vale do Côa.
Saaty, T., 1990. The analytic hierarchy process: planning, priority setting, resource allocation, RWS Publications, Pittsburgh.
Saaty, T., 1994. Fundamentals of decision making and priority theory with analytic hierarchy process, RWS Publications, Pittsburgh.
Saaty, T., Vargas, L.G., 2001. Models, methods, concepts and applications of the analytic hierarchy process, Kluwer Academic, Boston.
Sanmartí i Grego, J., 2007. El arte de la Iberia septentrional, in Abad Casal, L., Soler Díaz, J.A. (Eds.), Arte Ibérico en la España Mediterránea: Actas del Congreso (Alicante, 24-27 de octubre de 2005). Instituto Alicantino Juan Gil-Albert, Alicante, pp. 239-264.
Santos, J.G., 2005. As bacias de Mirandela, Macedo de Cavaleiros e de Vilariça-Longroiva: Estudo de geomorfologia. Ph.D. thesis at Coimbra University, Portugal.
Silva, A.F., Ribeiro, M.L., 1991. Carta Geológica de Portugal em escala 1: 50 000 e Notícia explicativa da Folha 15-A: Vila Nova de Foz Côa, Serviço Geológico de Portugal, Lisbon.
Silva, A.F., Rebelo, J.A., Ribeiro, M.L., 1989. Carta Geológica de Portugal em escala 1: 50 000 e Notícia explicativa da Folha 11-C: Torre de Moncorvo, Serviço Geológico de Portugal, Lisbon.
Syers, J.K., Iskandar, I.K. (1973). Pedogenetic significance of lichens, in: Ahmadjian, V., Hale, M. E. (Eds.), The Lichens. Academic Press, New York, pp. 225-248.
Sopeña, G., 1995. Ética y ritual: Aproximación al estudio de la religiosidad de los pueblos celtibéricos, Institución Fernando el Católico, Zaragoza.
Süzen, M.L., Toprak, V., 1998. Filtering of satellite images in geological lineament analyses: an application to a fault zone in Central Turkey. Int. J. Remote Sens. 19, 1101-1114.
USGS, 2001. Landsat ETM+ Pan-Sharpened, Scene EPP203R032_7F20010620, Orthorectified remote-sensing image and Scene ELP203R032_7T20010620, USGS Center for Earth Resources Observation and Science (EROS), Sioux Falls, SD USA, 2001/06/20.
Verhagen, P., 2007. Case Studies in Archaeological Predictive Modelling, University Press, Leiden. A Predictive Model of Archaeological Site Location in the Eastern Prairie Peninsula, in: Wescott, K. L.: Brandon, R. J. (Eds.), Practical Applications of GIS for Archaeologists: A Predictive Modeling Toolkit. Taylor & Francis, Philadelphia, pp. 6-36.
Wheatley, D., Gillings, M., 2002. Spatial Technology and Archaeology: The archaeological applications of GIS, Taylor & Francis, New York.
Zhang, Y., 2004. Highlight Article: Understanding Image Fusion. Photogramm. Eng. Remote Sens. 70, 657-661.
Zilhão, J., 1995. The age of the Côa Valley (Portugal) rock-art, validation of archaeological dating to the Palaeolithic and refutation of ‘scientific’ dating to Historic and Proto-Historic times. Antiquity 69, 883-901.
Zilhão, J., 1997. Arte rupestre e Pré-história do Vale do Côa. Trabalhos de 1995-1996. Ministério da Cultura, Lisbon.